

Ijraset Journal For Research in Applied Science and Engineering Technology
A Novel method of QRS Detection Using Adaptive Multilevel Thresholding with Statistical False Peak Elimination
Authors: A. Rajani, V. Sandeep
DOI Link: https://doi.org/10.22214/ijraset.2022.46848
Certificate: View Certificate
Abstract
Heart is the vital organ of a Human Body, because of its involvement in various works and processes in the entire body such as blood pumping etc., so recording a heart function is also a great thing, it is done through ECG signals. ECG signal records the electrical signals and activity of a Human Heart based on the electrical signals released by the Heart. ECG signal consists of PQRST waves, which are the reference points on an ECG signal. But, recording them is much easy than extracting and analyzing them, so, as to extract them, we are applying an advanced adaptive multi-level thresholding (AAMT) along with a selective statistical false peak elimination for the detection of QRS peaks of an ECG signal. Initially, median and moving average filters are applied for removing noise as well as terms. After AAMT is implemented on the complete dataset of ECG signals. Then selective statistical false peak elimination (SSFPE) is implemented for removing noise terms that might be missed out during filtering. At last, a search back stage will be implemented to search for low amplitude useful peaks. We used MIT-BIH arrhythmia and fantasia databases and got a higher accuracy in detecting and sensitivity is increased to 99.3 for MIT-BIH arrhythmia and 99.7 for fantasia database compared to existing previous methods.
Introduction
I. INTRODUCTION
The Heart of a Human body is an essential and most vital organ. The human heart is responsible for various processes inside our body. Heart’s main purpose is to pump blood to various parts of the body which is the most important task for our body. The human heart emits electrical signals at a very low volts of the order of 60mV, so, we have to record those electrical signals for checking and validating the functions of a healthy heart, the recording of the electrical activity of the human heart is done by Electro-Cardio-Gram (ECG) signals. But, the problem with those ECG signals is their complexity during plotting and analyzing.
An ECG signal consists of PQRST waves of which QRS are principal components. QRS waves are also difficult to detect, but we can detect R peaks easily.
There exists a number of techniques for detecting R peaks, such as Fourier Transform (FT), Direct Cosine Transform (DCT), Fast Fourier Transform (FFT) and application of Wavelets such as Continuous Wavelet, Discrete Wavelet etc. Transforming a signal into frequency domain and taking the instantaneous peaks of the signal will result in R peaks. R peaks can be extracted using statistical analysis with thresholds of different lengths.
The extraction of remaining waves such as, Q or S can also be done by statistical analysis. That involves thresholding at different instants. Q and S peaks along with R forms a complex trio of QRS peak which is a quite different and difficult to be extracted. There exist several techniques in extraction and detection of QRS peaks but, here, we are using an advanced adaptive multi-level thresholding (AAMT) combined with selective statistical false peak elimination (SSFPE) for detecting or extracting QRS peaks from an ECG signal record.
An ECG signal contains PQRST waves of which QRS are the most important waves, but, the extraction of a Q, R, S or any wave is quite difficult and challenging, for that we are implementing an advanced adaptive multi-level thresholding (AAMT) combined with selective statistical false peak elimination (SSFPE) for detecting or extracting QRS peaks from an ECG signal record. After, all the statistical analysis of the segments it uses a search back stage for detecting any missed out true peaks in the ECG signal segment., we have used MIT-BIH arrhythmia and fantasia databases for the implementation.
A. Types of Noises in ECG Signals
There exists a number of noises that corrupts the ECG signal in a different manner. Some degrade the signal’s strength, some completely the spectral characteristics of the signal and some completely change or destroys the signal. Such as, Baseline Wander, Power line interference and motion artifacts. The motion artifacts are due to the motion of the person during the process of fetching the ECG from the person. Person’s movement can affect the signal’s quality from a low level to a considerable level or even higher. The power line interference is a typical type of noise that occurs due to the interference of electrical signals that does not belongs to the activity of the Heart. The interference of the signals that are captured by the ECG during the initial process. Baseline Wander is a type of noise produced in ECG signals because of the poor equipment or presence of any disturbances in the middle and presence of any electrical equipment near to the person who’s taking the ECG test.
B. Median and Moving Average Filter
The usage of a Median filters cascaded with Moving Average filter is the whole new approach of this work. Median filters are generally used for removing noise from the signals. The median filter uses the median values to replace the noisy terms. Usually, the noisy terms deviate from the remaining terms in a locality. They might be too high or too low than the regular values in the particular location. Median filter calculates the median of the particular location and check for its neighbors to replace the deviated values. Thereby, reducing or minimizing the noise from the signal.
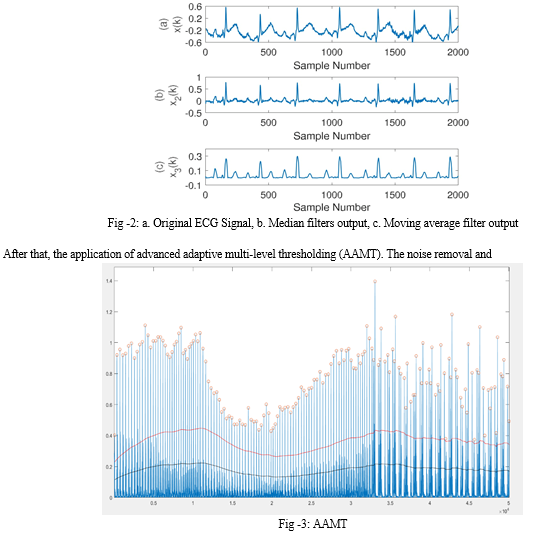
Moving Average filter is also a noise removing filter from the signals. Moving average filter is a type of FIR filter which eliminates noise terms. Moving average filter by its name, this calculates the series of averages from the signal locations or instants that moves over a series of instants on the signal. Later, it replaces the moving averages with the noisy terms to eliminate the noise from the original signal. Moving average filter followed by two median filters gives more robust signal than the existing methods or techniques. Later, the de-noised or noise free (almost) signal is sent to the Advanced Adaptive Multi-Level Thresholding (AAMT) for the detection of QRS peaks or waves from the noise removed ECG signal.
ECG signal noise elimination actually made easy through the process of applying a median filter along with the moving average filter. Two median filters are employed to get noise suppressed at two levels making the signal to noise ratio improvement. Later, an additional filter known as, moving average filter is applied to remove the noise at another level, making the noise eliminated at even low levels. Signal to noise ratio is further more improvised for the ECG signal and making it easier for detection by the processes involved in the work. De-noised signal at each level is made easy, through this type of application of filters at multiple levels. This type of approach makes the signal to noise ratio improving even better than the previously existing works.
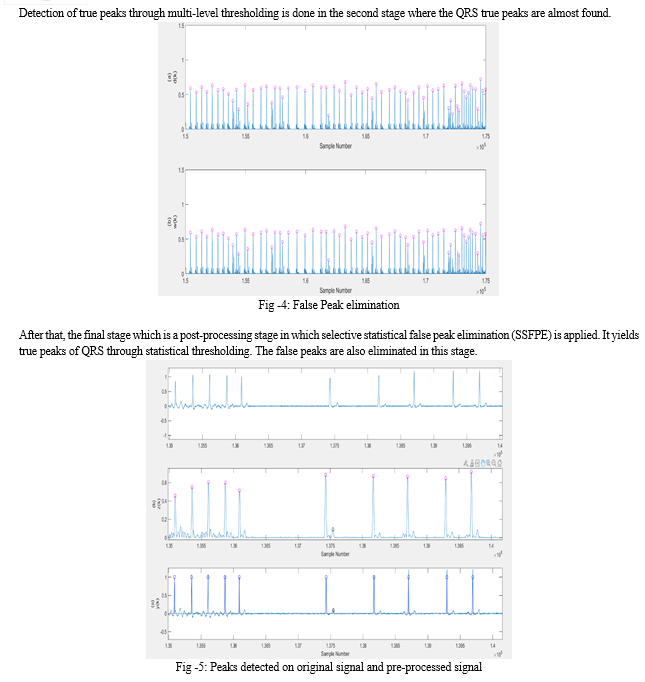
C. AAMT
The Advanced Adaptive Multi-Level Thresholding (AAMT) is extension of the existing technique known as Adaptive Multi-level Thresholding (AMT).
The AAMT for detecting or extracting QRS peaks of an ECG signal are quite impressive, because the current technique takes beats as well as amplitude thresholds than the existing AMT technique. The AAMT consumes less time than the AMT. The peaks are first extracted and their locations along with their amplitudes are recorded and their average value is taken. It uses two levels called signal level and noise level which are initially taken as zero or 0 for reference. Later, the averages are used to replace the locations where the noise terms will be present that means deviation from the remaining neighbors at that particular location.
Later, updating these levels at every stage when we find a new true peak or a discarded noise peak. Here, we use another two thresholds both for noise and true peaks, R a threshold of lower amplitude below which peaks are the noise peaks and are discarded and T a threshold of high amplitude above are true peaks and updated. The resultant gets the pseudo peaks with a much more accuracy in detection after being filtering of noise and interference terms in the previous level. If all the pseudo peaks are extracted the signal is segmented with less than 50K samples and with each segment containing two times the samples taken by existing AMT technique. After that, the segments are sent to the next stage for removing noise terms.
AAMT uses thresholds at multiple levels or stages to detect or extract peaks or waves even more accurately. AAMT implements a new type of a combination of median filter along with a moving average filter to de-noise the ECG signal. A combination of two median filters cascaded with a moving average filter makes the noise removal more. Three stages of noise removing from the ECG signal is the new approach used by this paper. Later, the de-noised signal is thresholded at each level and the peaks or waves are detected using multi-level thresholding. The obtained ECG signal is segmented into several segments of length maximum of 50K samples and sent to the next stage known as Selective Statistical False Peak Elimination (SSFPE).
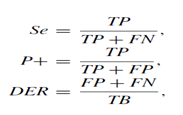
D. Selective Statistical False Peak Elimination (SSFPE)
The Selective Statistical False Peak Elimination (SSFPE) is a statistical analysis of the extracted ECG segments. The technique uses statistical thresholds and selection to eliminate any false peaks present in the segments. After, the segmented ECG signals are extracted, the SSFPE uses the pseudo true peaks for analysis and calculates the difference between the peaks that lie adjacent and a mean peak to peak difference as well as their weights are also calculated. After, all the statistical analysis of the segments it uses a search back stage for detecting any missed out true peaks in the ECG signal segment. The thresholding technique yields several true positive peaks at this stage. Later, a search back stage is employed for detecting the missed-out peaks. Search back works like feedback for the system where it checks once again for the remaining missed out true peaks
II. PROPOSED METHOD
The proposed work starts with a Pre-processing stage, detection of peak stage followed by a post-processing stage. The initial stage extracts the suitable information from an ECG signal by suppressing noise or interferences. The detection is done in two times to make the detection robust; first detection is done through AAMT using R-peaks with an adaptive threshold. The second detection is done by SSFPE through segmented and analysis of previously detected peaks. At last, the search back stage tries to detect any missed out true peaks.
Pre-processing stage involves the elimination of the noise and interference terms from the signal through two Median filters and a Moving Average filter. Median filters aim to filter the median values that are higher through a sample of ECG signal. After that, the moving average filter also aims for average valued peaks in the signal. Median filters are the one which calculates the median values of the signal in a location where the noise will be present. After the calculation of median for the locality verifies the neighbors of the particular location, if any value has more deviation or not. If any value has a high deviation that may be very high value or very low value that value will be replaced by the previously calculated median value. Likewise, the median filtering is applied two times to reduce or nullify the noise at more levels. This type of approach makes the signal to noise ratio improving much better than the previously existing works.
The moving average filter is also a noise removing filter mainly chooses to filter the high frequencies. Moving average filter calculates the average of a particular location and that average calculation is moved over the entire signal. This way, the moving average filter calculates the series of averages of the locations over the signal. Later, the averages are used to replace the locations where the noise terms will be present that means deviation from the remaining neighbors at that particular location. Thereby, improvising the signal to noise ratio to a new level that is much better than the previous works.
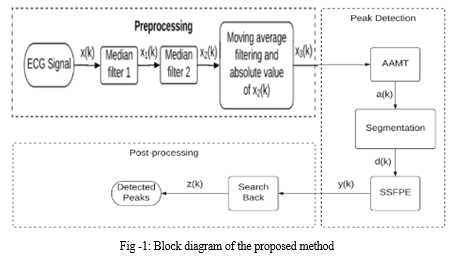
Detection of Peak stage involves multi-level thresholding by AAMT, it starts with initially setting the min peak interval to 280ms which avoids elimination of true positive peaks that consists of Ectopic beats. After that, the locations and amplitudes of the peaks are calculated, through them the average will also be calculated. Noise and signal values are used to count the true as well as ignored false peaks of noise. Two thresholds are also initialized one of them is a low amplitude threshold for eliminating false noise peaks and other is upper threshold for true peak identification. Later, the ECG signal is segmented with utmost of 50K samples per signal. The segmented signal is sent to the next stage for the detecting of any peaks that are missed out during the current process.
After, all the statistical analysis of the segments it uses a search back stage for detecting any missed out true peaks in the ECG signal segment. If any value has a high deviation that may be very high value or very low value that value will be replaced by the previously calculated median value. Likewise, the median filtering is applied two times to reduce or nullify the noise at more levels. After, all the statistical analysis of the segments it uses a search back stage for detecting any missed out true peaks in the ECG signal segment. The thresholding technique yields several true positive peaks at this stage. Later, a search back stage is employed for detecting the missed-out peaks.
Post-processing stage involves a statistical analysis of the segmented ECG samples and based on the analysis thresholds are calculated. Those thresholds are used to extract the true peaks that are left out during the previous process. The thresholding technique yields several true positive peaks at this stage. Later, a search back stage is employed for detecting the missed-out peaks. Search back works like feedback for the system where it checks once again for the remaining missed out true peaks. After, the segmented ECG signals are extracted, the SSFPE uses the pseudo true peaks for analysis and calculates the difference between the peaks that lie adjacent and a mean peak to peak difference as well as their weights are also calculated.
III. RESULTS
At the initial stage which is a pre-processing stage the original ECG signal is plotted.
A Search back stage which is like feedback for the post-processing stage, where the technique once again checks for any missed-out peaks during the entire processes which makes the technique even more robust. Finally, the true positive peaks are detected, that are QRS peaks of an ECG signal. Three terms are used to see the performance of the proposed method, and these are sensitivity (Se), positive predictivity (PC), and detection error rate (DER) which are represented by,
where, TP is the true positive that is the number of annotated beats detected properly, FN is the false negatives that are the number of missed beats from the annotations, FP is the false positive that is the number of beats that are not annotated but still detected by the algorithm and TB is the total number of beats annotated in the record.
TABLE 1.
Results from the MIT-BIH arrhythmia database.
--------------------------------------------------------------------------------------------------------------------------------------------
Rec. No. TB DB TP FP FN Se (%) P+ (%) DER(%)
--------------------------------------------------------------------------------------------------------------------------------------------
100 2273 2273 2273 0 0 100 100 0
101 1867 1864 1864 0 3 100 99.84 0.16
102 2187 2184 2184 0 3 100 99.86 0.14
103 2083 2083 2083 0 0 100 100 0
104 2229 2222 2222 0 7 100 99.69 0.31
105 2589 2594 2586 8 3 99.69 99.88 0.42
106 2033 2023 2023 0 10 100 99.51 0.49
107 2134 2133 2133 0 1 100 99.95 0.05
108 1757 1746 1745 1 12 99.94 99.32 0.74
109 2532 2526 2526 0 6 100 99.76 0.24
111 2130 2115 2115 0 15 100 99.3 0.7
112 2539 2539 2539 0 0 100 100 0
113 3550 3480 3480 0 70 100 98.03 1.97
114 1984 1983 1982 1 2 99.95 99.9 0.15
115 1952 1953 1952 1 0 99.95 100 0.05
116 2394 2388 2388 0 6 100 99.75 0.25
117 2546 2486 2486 0 60 100 97.64 2.36
118 2279 2279 2279 0 0 100 100 0
119 1988 1988 1988 0 0 100 100 0
121 1862 1861 1861 0 1 100 99.95 0.05
122 2476 2476 2476 0 0 100 100 0
123 1519 1520 1519 1 0 99.93 100 0.07
124 1618 1615 1615 0 3 100 99.81 0.19
200 2597 2589 2588 1 9 99.96 99.65 0.39
201 1977 1958 1952 6 25 99.69 98.74 1.57
202 2147 2131 2131 0 16 100 99.25 0.75
203 2846 2669 2665 4 181 99.85 93.64 6.5
205 2645 2642 2642 0 3 100 99.89 0.11
207 2091 2047 2037 10 54 99.51 97.42 3.06
208 2938 2929 2929 0 9 100 99.69 0.31
209 3006 3006 3005 1 1 99.97 99.97 0.07
210 2634 2622 2619 3 15 99.89 99.43 0.68
212 2749 2749 2749 0 0 100 100 0
213 3249 3238 3238 0 11 100 99.66 0.34
214 2262 2256 2255 1 7 99.96 99.69 0.35
215 3364 3347 3347 0 17 100 99.49 0.51
217 2205 2205 2203 2 2 99.91 99.91 0.18
219 2170 2153 2153 0 17 100 99.22 0.78
220 2045 2048 2045 3 0 99.85 100 0.15
221 2428 2427 2426 1 2 99.96 99.92 0.12
222 2527 2501 2494 7 33 99.72 98.69 1.58
223 2603 2594 2594 0 9 100 99.65 0.35
228 2042 2018 2017 1 25 99.95 98.78 1.27
230 2256 2256 2256 0 0 100 100 0
231 1577 1573 1572 1 5 99.94 99.68 0.38
232 3049 2898 2876 22 173 99.24 94.33 6.4
233 3076 3069 3069 0 7 100 99.77 0.23
234 2753 2753 2753 0 0 100 100 0
--------------------------------------------------------------------------------------------------------------------------------------------
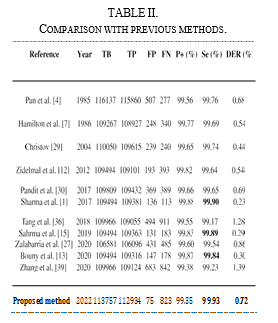
Total 113757 113009 112934 75 823 99.93 99.35 0.72
-------------------------------------------------------------------------------------------------------------------------------------------
IV. DISCUSSION
The ECG signal is taken from two databases namely, MIT-BIH Arrhythmia and Fantasia databases. The ECG signal is corrupted from noise already, so, removing the noise by the application of a combination of filters. Two Median filters along with a Moving Average filter helps in reducing the noise to a greater extent. Noise removing is done at three times, by two median filters and a moving average filter, so noise is reduced to lower level than the previously existed processes. Later, the noise removed ECG signal is moved to the AAMT for detecting the QRS Peaks. After, the QRS Peaks are detected it segmented into 50K samples of ECG signal each. These segments are sent to SSFPE for further detection of QRS true Peaks, if any missed out. Later, a search back stage is implemented to again search for the QRS Peaks, this stage makes our work even more robust in determining the QRS Peaks.
Conclusion
We can finally conclude that, the QRS peaks are extracted and detected using AAMT which employs a median filtering along with a moving average filter to filter out noise and interference terms from the original ECG signal and left out true peaks are again detected with SSFPE, later, a search back stage is employed to make the detection even more robust. The present technique of advanced adaptive multi-level thresholding (AAMT) gives better results compared with the previous technique of AMT where, it uses more data and thresholds for processing.
References
[1] T. Sharma and K. K. Sharma, ‘‘QRS complex detection in ECG signals using locally adaptive weighted total variation denoising,’’ Comput. Biol. Med., vol. 87, pp. 187–199, Aug. 2017. [2] B.-U. Kohler, C. Hennig, and R. Orglmeister, ‘‘The principles of software QRS detection,’’ IEEE Eng. Med. Biol. Mag., vol. 21, no. 1, pp. 42–57, Aug. 2002R. Nicole, “Title of paper with only first word capitalized,” J. Name Stand. Abbrev., in press. [3] R. M. Rangayyan, Biomedical Signal Analysis, 33, John Wiley & sons, 2015X. Lu, M. Pan, and Y. Yu, ``QRS detection based on improved adaptive threshold,\'\' J. Healthcare Eng., vol. 2018, pp. 18, Mar. 2018. [4] J. Pan, W.J. Tompkins, A real-time QRS detection algorithm, IEEE Trans. Biomed. Eng. (3) (1985) 230-236. [5] J.D. Drake, J.P. Callaghan, Elimination of electrocardiogram contamination from electromyogram signals: an evaluation of currently used removal techniques, J. Electromyogram. Kinesiology. 16 (2) (2006) 175-187. [6] P. S. Hamilton and W. J. Tompkins, ``Quantitative investigation of QRS detection rules using the MIT/BIH arrhythmia database,\'\' IEEE Trans. Biomed. Eng., vol. BME-33, no. 12, pp. 1157 1165, Dec. 1986.
Copyright
Copyright © 2022 A. Rajani, V. Sandeep. This is an open access article distributed under the Creative Commons Attribution License, which permits unrestricted use, distribution, and reproduction in any medium, provided the original work is properly cited.

Download Paper
Paper Id : IJRASET46848
Publish Date : 2022-09-21
ISSN : 2321-9653
Publisher Name : IJRASET
DOI Link : Click Here
 Submit Paper Online