

Ijraset Journal For Research in Applied Science and Engineering Technology
Agriculture Data Analytics in Crop Yield Estimation using IBM Cognos
Authors: Dr. Gururaj T, Prerana Prakash Latti, Rakshanda B, Rakshit V M, Ranjana B
DOI Link: https://doi.org/10.22214/ijraset.2022.45775
Certificate: View Certificate
Abstract
Analytics is the interpretation of data pattern that assist decision- making and performance improvement. Agriculture Data analytics in crop yield helps in analysing some important visualization, creating a dashboard and by going through these we will get most of the insights of Crop production in India. IBM Cognos Analytics integrates reporting, modelling, analysis, exploration, dashboards, stories, and event management so we can understand our organization\'s data, and make effective decisions. A dashboard helps us to monitor events or activities at a glance by providing key insights and analysis about our data on one or more pages or screens. In this project, we visualize, analyse and gain most of the insights by creating a dashboard.
Introduction
I. INTRODUCTION
Agriculture is the backbone of Indian Economy. In India, majority of the farmers are not getting the expected crop yield due to several reasons. The agricultural yield is primarily depends on weather conditions. Rainfall conditions also influences the rice cultivation. In this context, the farmers necessarily requires a timely advice to predict the future crop productivity and an analysis is to be made in order to help the farmers to maximize the crop production in their crops. Yield prediction is an important agricultural problem. Every farmer is interested in knowing, how much yield he is about expect. In the past, yield prediction was performed by considering farmer's previous experience on a particular crop. The volume of data is enormous in Indian agriculture. The data when become information is highly useful for many purposes. IBM Cognos Business Intelligence is a web-based integrated business intelligence suite by IBM. It provides a toolset for reporting, analytics, score carding, and monitoring of events and metrics. The software consists of several components designed to meet the different information requirements in a company. IBM Cognos has components such as IBM Cognos Framework Manager, IBM Cognos Cube Designer, IBM Cognos Transformer. Cognos Analysis Studio helps business users get fast answers to business-related queries. Reporting studio allows you to create pixel-perfect reports for your organization. Cognos event studio allows you to assign a specific event that sends a notification to the stakeholder in your organization. Cognos Metric Studio allows you to monitor and analyze business metrics of your organization by building a scorecard environment.
II. LITERATURE SURVEY
M. A. Jayaram and Netra Marad, “Fuzzy interference Systems for Crop Prediction”, Journal of Intelligent Systems, 2012, 21(4), pp.363-372[1]. Prediction of crop yield is signi?cant in order to accurately meet market requirements and proper administration of agricultural activities directed towards enhancement in yield. Several parameters such as weather, pests, biophysical and morphological features merit their consideration while determining the yield. However, these parameters are uncertain in their nature, thus making the determined amount of yield to be approximate. It is exactly here that the fuzzy logic comes into play. This paper elaborates an attempt to develop fuzzy inference systems for crop yield prediction. Physio morphological features of Sorghum were considered. A huge database (around 1000 records) of physio morphological features such as days of 50 percent ?owering, dead heart percentage, plant height, panicle length, panicle weight and number of primaries and the corresponding yield were considered for the development of the model. In order to ?nd out the sensitivity of parameters, one-to-one, two-to-one and three-to-one combinations of input and output were considered. The results have clearly shown that panicle length contributes forth yield as the lone parameter with almost one-to-one matching between predicted yield and actual value while panicle length and panicle weight in combination seemed to play a decisive role in contributing for the yield with the prediction accuracy re?ected by very low RMS value.
P. Vindya “Agricultural Analysis for Next Generation High Tech Farming in Data Mining” , Anna University, Trichy, Tamilnadu, India, 5 May 2015[2]. Recent developments in Information Technology for agriculture field have become an interesting research area to predict the crop yield [1].
In today’s world, the amount of information stored has been enormously increasing day by day which is generally in the unstructured form and cannot be used for any processing to extract useful information using mining technique [2]. This paper presents a brief analysis of data mining methods and agriculture techniques, farm types, soil types, prediction using Multiple Linear Regression (MLR) technique for the selected region. This work mainly focuses on analyzing the agricultural analysis of organic farming and inorganic farming, time cultivation of the plant, profit and loss of the data and analyzes the real estate business land in a specific area and comparison of irrigated and unirrigated land. It concentrates organic, inorganic and real estate data sets from which the prediction in agriculture will be achieved. The purpose is to estimate difference in efficiency and prediction between organic and inorganic farming. This work aims at finding suitable data models that achieve a high accuracy and a high generality in terms of yield prediction capabilities.
Crop Yield Prediction Using Machine Learning A research group investigated the utilization of various information mining methods which will foresee rice crop yield for the data collected from the state of Maharashtra, India. A total of 27 regions of Maharashtra were selected for the assessment and the data was collected related to the principle rice crop yield influencing parameters such as different atmospheric conditions and various harvest parameters i.e Precipitation rate, minimum, average, maximum and most extreme temperature, reference trim cultivable area, evapotranspiration, and yield for the season between June to November referred as Kharif, for the years 1998 to 2002 from the open source, Indian Administration records. WEKA a Java based dialect programming for less challenging assistance with information data sets, assigning design outcomes tool was applied for dataset processing and the overall methodology of the study includes, (1) pre-processing of dataset (2) Building the prediction model utilizing WEKA and (3) Analyzing the outcomes. Cross validation study is carried out to scrutinize how a predictable information mining method will execute on an ambiguous dataset. Study applied 10-fold higher cross validation study design to assess the data subsets for screening and testing. Identified and collected information was randomly distributed into 10 sections where in one data section was used for testing while all other data sections were utilized for the preparation information. Study reported that the method applied was supportive in the precise estimation of rice crop yield for the state of Maharashtra, India. The precise quantification of the rice productivity in various climatic conditions can help farmer to understand the optimum condition for the higher rice crop yield [8].
Simulation models based on field experiment are valuable technologies for studying and understanding crop yield gaps, but one of the critical challenge remain with these methods is scaling up of these approach to assess the data collated between different time intervals from the broader geographical regions. Satellite retrieved data have frequently been revealed to present data sets that, by itself or in grouping with other information and model designs, can precisely determine the yields of crop in agricultural lands. The yield maps developed shall provide an unique opportunity to overcome both spatial and temporal based scaling up challenges and thus improve the ideology of crop yield gaps prediction. A review was conducted to discuss the applications of remote sensing technology to determine the impact and causes of yield gaps. Even though the example discussed by the research group demonstrates the usefulness of remote sensing in the prediction of yield gaps, but also many areas of possible application with respect to the crop yield assessment, prediction and improvement remain unexplored. Study proposed two less complicated, easily assessable methods to determine and quantify the yield gaps between various agricultural fields. First method works closely with the constructive maps representing the average crop yields, it can be used directly to accesses specific crop yield influencing factors for further studies whereas the second method use the remote sensing technology to retrieve the data for providing the useful information regarding the crop yield prediction and estimation [14].
III. SYSTEM DESIGN
System design thought as the application of theory of the systems for the development of the project. System design defines the architecture, data flow, use case, class, sequence and activity diagrams of the project development.
A. IBM Cognos Analytics
IBM Cognos Analytics is a set of business intelligence tools available on cloud or on- premise. The primary focus is in the area of Descriptive Analytics, to help users see the information in your data through dashboards, professional reporting and self-service data exploration. In this work, we used the IBM cognos data analytics for analysing the crop yield data.
Following are important features of IBM Cognos:
- Get Connected - Connect your data effortlessly Import data from CSV files and spreadsheets. Connect to cloud or on-premises data sources, including SQL databases, Google BigQuery, Amazon, Redshift, and more.
- Prepare your data – Prepare and connect data automatically Save time cleaning your data with AI-assisted data preparation. Clean and prep data from multiple sources, add calculated fields, join data, and create new tables.
- Build visualizations - Create dynamic dashboards easily Quickly create compelling, interactive dashboards. Drag and drop data to create auto- generated visualizations, drill down for more detail, and share using email or Slack.
- Identify Patterns – Uncover hidden patterns Ask the AI assistant a question in plain language, and see the answer in visualization. Use time series modelling to predict seasonal trends.
- Generate Personalised Reports – Create and deliver personalized reports Keep your stakeholders up-to-date, automatically. Create and share dynamic personalized, multi-page reports in the formats your stakeholders want.
- Gain Insights - Make confident data decisions Get deeper insights without a data science background. Validate what you know, identify what you don't with statistically accurate time-series forecasting and pinpoint patterns to consider.
- Stay Connected – Go Mobile Stay connected on the go with the new mobile app. Access data and get alerts right from your phone.
Important Components of Cognos Software:
a. Cognos Connection: Cognos connection is a web portal that allows users to access Cognos 10 and studios. Based on your assigned role, you can use this component to retrieve, view, publish, manage, and organize companies’ reports, scoreboards, and agents. The Administrator also using Cognos Connection to establish roles and user permissions and manage the Cognos Connection content.
b. Cognos Business Insight: Cognos Business Insight allows users to create their dashboard using any object. All content which the user is permitted to view will be presented as an object. This can be used in your workspace to create a fully personalized dashboard.
c. Cognos Query Studio: Cognos Query Studio helps business users to get fast answers to business related queries. It helps organizations to better understand the product, customer, and organizational needs. It also helps them to react quickly and stay ahead of the competition.
d. Cognos Analysis Studio: Cognos Analysis Studio helps businesses to find and focus on things which are important to the business. It also helps to understand the latest trends, compare data, and assess business performance for multidimensional analysis.
e. Cognos Business Insight Advanced: Cognos business insight Advanced is a new module included in Cognos 10. It combines Cognos query studio and Cognos Analysis Studio. It offers robust authoring environment for business peoples.
f. Cognos Report Studio: Using the Cognos reporting tool, you can create pixel-perfect reports for your organization. It allows you to create charts, maps, lists, or any other available report type using relational or multidimensional data sources.
g. Cognos Event Studio: This tool allows you to assign a specific event that sends a notification to the stakeholder in your organization. You can create agents which enables you to your events and thresholds. Therefore, the event occurs or threshold is reached the agent sends the notification.
h. Cognos Metric Studio: Cognos Metric Studio allows you to monitor and analyse business metrics of your organization by building a scorecard environment. It also helps you to establish criteria and then monitor your organization to see how it is responding as the changes made in the criteria.
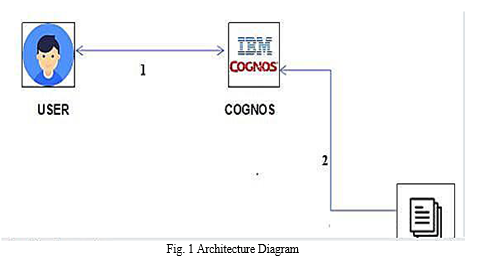
B. System Architecture
IBM Cognos Analytics provides dashboards and stories to communicate your insights and analysis. You can assemble a view that contains visualizations such as a graph, chart, plot, table, map, or any other visual representation of data. Explore powerful visualizations of your data in IBM Cognos Analytics and discover patterns and relationships that impact your business. A dashboard helps you to monitor events or activities at a glance by providing key insights and analysis about your data on one or more pages or screens.
The following are the modules in our work:
- Uploading data.(dataset)
- Cleaning data (prepare data).
- Analysing and interpreting (exploration).
- Visualizing data (dashboard creation).
If we have not already signed up for IBM cognos Analytics then you can sign up here. By signing up for IBM cognos Analytics, two services will be created - Spark and Object Store in your IBM Cloud account.
a. Create the workbook: To create a new workbook, click on Cognos Analytics under Provisioned instance. The Cognos Analytics welcome screen will open automatically.
b. Data Upload: In this project we have uploaded crop_production dataset.
c. Data Pre-processing: The dataset consists of attributes Moisture, rainfall, Average, Humidity, Mean Temp, max Temp, Min temp, alkaline, sandy, chalky, clay, millet, yield, Outcomes. We will be using the .csv to perform the pre-processing.
d. Database Connection: Connecting to Db2 DB, which is part of the IBM Cloud Pak for Data cluster for building dashboards. Now add tables to the data module that you want to use for building your dashboard. In the same window, under the Schemas tab, select the schema name where your data is actually loaded. Next, click on Load metadata. In this case, we loaded the data in DB schema. All the database tables under that schema, the Meta data of the tables will be loaded to Cognos Analytics content store. We can click the New icon and then click Upload files. Go to where you saved crop_DataSet.csv and select it. After successful upload of the file, you should same screen below. You'll see predefined templates for easy arrangement and alignment of visualizations and other elements in a dashboard. Select the blank template and then click OK. Now add a data asset to this dashboard so that we can build some insights through visualizations.
e. Combine Worksheets into a Dashboard: A dashboard is a consolidated display of many worksheets and related information in a single place. It is used to compare and monitor a variety of data simultaneously. The different data views are displayed all at once. Steps to create the Dashboard:
- At the bottom of the workbook, click the “New Dashboard” icon.
- From the sheets list at left, drag views to the dashboard at right onto the Dashboard Workspace in the indicated location
- Change the target size of the dashboard by making a selection from the size drop- down list in the Dashboard section of the navigation menu on the left and adjust the object sizes accordingly.
- Remove unnecessary filters from the dashboard and make the essential filters as floating type and arrange them accordingly.
- Click on the first object on the Dashboard and click on “Use as Filter”.
f. Create a Story: A story is a sequence of visualizations that work together to convey information. User can create stories to tell a data narrative, provide context, demonstrate how decisions relate to outcomes, or to simply make a compelling case. Steps to create the Storyboard:
- Click the “New Story” tab. IBM Cognos opens a new story as the starting point.
- In the lower-left corner of the screen, choose a size for the story.
- By default, the story gets its title from the sheet name. To edit it, right-click the sheet tab or double click and choose “Rename Sheet”.
- To start building the story, drag sheets into the story point or double-click a sheet on the left to add it to a story point.
- Click “Add a caption” to summarize the story point.
- To add another story point, click “Blank” to use a fresh sheet for the next story point.
- Repeat the above steps until all story points are added.
g. Publishing Workbooks and Dashboards: We can share the work with the rest of the team by publishing it to Tableau Server or Tableau Online. After it’s published, the team can access it through web browser or the Tableau mobile app. publishing data sources can also help to centralize data management. Steps to Publish a Workbook to IBM Cognos Online:
- Make sure a worksheet or dashboard tab is active.
- Select Server > Publish Workbook.
- Sign in to Tableau Online using the IBM Cognos Online Credentials.
- In the Publish Workbook dialog box, select the project, enter a name for the workbook along with the description
Conclusion
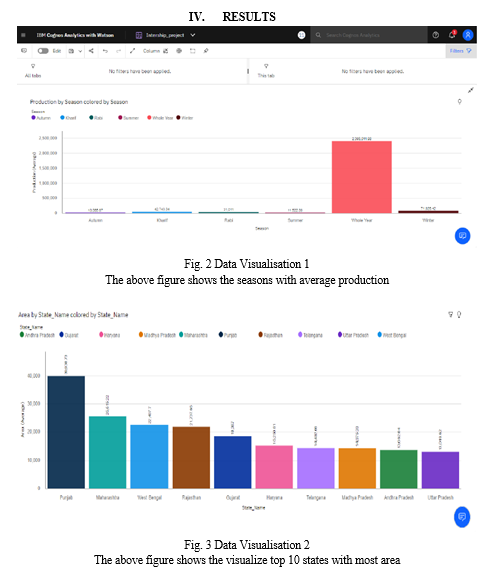
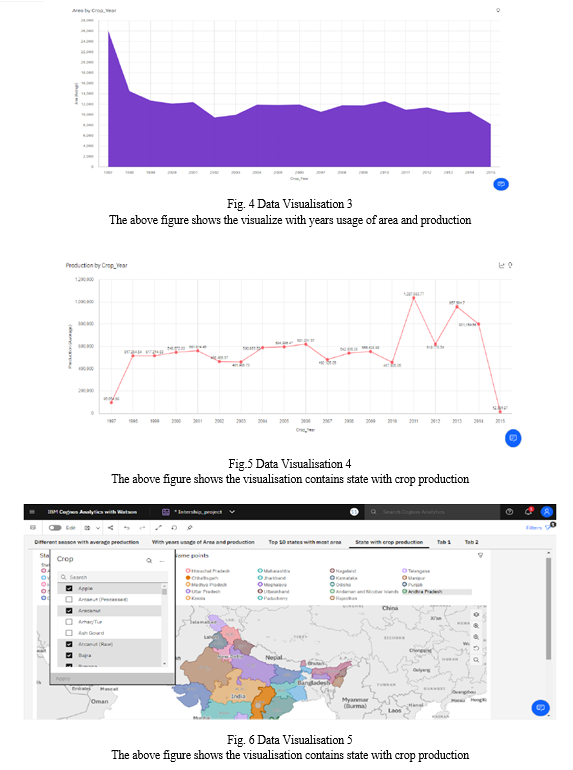
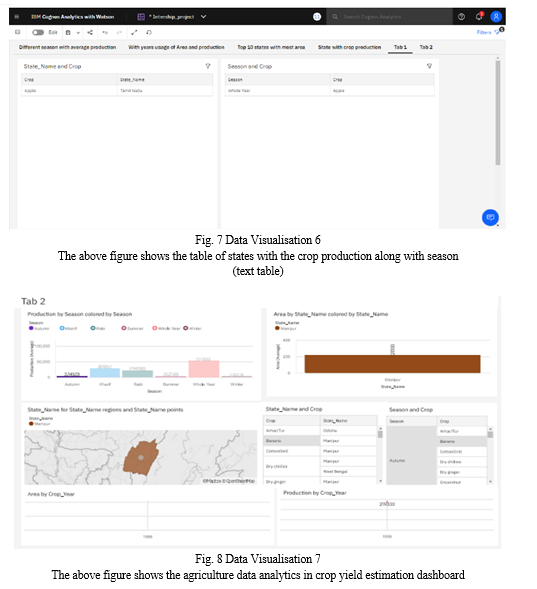
As a result of penetration of technology into agriculture field, there is a marginal improvement in the productivity. The innovations have led to new concepts like digital agriculture, smart farming, precision agriculture etc. In the literature, it has been observed that analysis has been done on agriculture productivity, hidden patterns discovery using data set related to seasons and crop yields data. We have noticed and made analysis about different crops cultivated, area and productions in different states and districts using IBM Cognos some of them are 1) Seasons with average productions. In this analytics we come to know in which seasons the average production is more and in which seasons the production is less. 2) Production by crop year. In this analysis we come to know in which years the production is high and low. 3) Production by District. With this analytics we can aware of the districts with the selected crops cultivated and states too.4) Production by Area. From this we can know how much area should be cultivated and the production will be getting will be estimated. Finally created the dashboard and made analysis that in which state and in which year with crop area and to what extent the production will be are analysed.
References
[1] M. A. Jayaram and Netra Marad, “Fuzzy interference Systems for Crop Prediction”, Journal of Intelligent Systems, 2012, 21(4), pp.363-372. [2] P. Vindya “Agricultural Analysis for Next Generation High Tech Farming in Data Mining” , Anna University, Trichy, Tamilnadu, India, 5 May 2015 [3] Dakshayini Patil, M .S, Shirdhonkar. Rice Crop Yield Prediction using Data Mining Techniques: An Overview. International Journal of Advanced Research in Computer Science and Software Engineering, 2017; 7(5):427-431. [4] David B. Lobell, The use of satellite data for crop yield gap analysis, Field Crops Research-143, 2013; 56–64. [5] https://www.toolbox.com/hr/hr-analytics/articles/what-is-hr-analytics/ [6] https://www.ibm.com/downloads/cas/WVJBQERV
Copyright
Copyright © 2022 Dr. Gururaj T, Prerana Prakash Latti, Rakshanda B, Rakshit V M, Ranjana B. This is an open access article distributed under the Creative Commons Attribution License, which permits unrestricted use, distribution, and reproduction in any medium, provided the original work is properly cited.

Download Paper
Paper Id : IJRASET45775
Publish Date : 2022-07-19
ISSN : 2321-9653
Publisher Name : IJRASET
DOI Link : Click Here
 Submit Paper Online