

Ijraset Journal For Research in Applied Science and Engineering Technology
Treatment Analysis of COVID-19 Patient with Age Factor Using Chi Square Test
Authors: Amit Shekhar , Dr. Sachin Patel
DOI Link: https://doi.org/10.22214/ijraset.2022.40262
Certificate: View Certificate
Abstract
A hypothesis provides the map that guides and expedites the exploration of the phenomena under consideration. A hypothesis pin points the problem.. The hypothesis provides the investigator with the most efficient instrument for exploring and explaining the unknown facts. A hypothesis provides the framework for drawing conclusions. These hypotheses simulate the investigator for further research studies. In this paper used Hypothesis testing with chi square test to analysis COVID -19 Patient treatment and age factors. Using Hypothesis testing we want to check State for the null and alternative hypotheses. The null hypotheses say that COVID -19 patient treatment and age factors are related with each other and alternate hypothesis say that there is no relationship exist COVID -19 patient treatment and age factors. We have taken more 1000 COVID -19 infected patient treatment with age factor. We select a random sample of 300 and 400 patient and by experimental analysis we found that the age is not a factor for required treatment. COIVD-19 infected patient can we any of the age group and required treatment are dependent on the immunity system of the patient.
Introduction
I. INTRODUCTION
It is the presumptive statement of a proposition which the investigator seeks to prove. It is a condensed generalization. This generalization requires knowledge of principles of things or essential characteristics which pertain to entire class of phenomena. The theory when stated as a testable proposition formally and clearly and subjected to empirical or experimental verification is known as hypothesis. The hypothesis furnishes the germinal basis of the whole investigation and remains to test it out by facts. The hypothesis is based on some earlier theory and some rationale whereas postulates are taken as granted true. An assumption is the assumed solution of a major problem. It may be partially true. The scientific research process is based on some hypotheses. The nature of sciences and mathematics are based on postulates. The statistic is based on some assumptions which are considered approximate science. The assumptions are helpful in conducting a research work in behavioral sciences hypothesis, regardless of its source, states what a researcher is looking for.
II. FUNCTIONS OF HYPOTHESIS
A hypothesis also performs the following significant functions –
- Test Theories: It is a set of inter-related propositions or statements organized into a deductive system that offers an explanation of some phenomenon. Facts constitute a theory when they are assembled, ordered and seen in a relationship. Suggest new theories: A hypothesis, even though related to some existing theory, may, after tested, reveal certain ‘facts’ that are not related to the existing theory or disclose relationships other than those stated in the theory. It does not support the existing theory but suggests a new theory.
- Describe Social Phenomenon: A hypothesis also performs a descriptive function. Each time a hypothesis is tested empirically, it tells us something about the phenomenon it is associated with. If the hypothesis is empirically supported, then our information about the phenomenon increases. Even if the hypothesis is refuted, the test tells us something about the phenomenon we did not know before.
- Suggest Social Policy: A hypothesis, after its testing, may highlight such ‘ills’ of the existing social or legislative policy. In such a situation, the tested hypothesis helps us in formulating (or reformulating) a social policy. It may also suggest or hint at probable solutions to the existing social problem(s) and their implementation.
III. LITERATURE SURVEY
In 2013 Joginder Kaur proposed “Techniques Used in Hypothesis Testing in Research Methodology A Review”. They reviewed the methods to select correct statistical tests for research projects or other investigations. They reviewed the methods to select correct statistical tests for research projects or other investigations. Research is a scientific search on a particular topic including various steps in which formulating and testing of hypothesis is an important step. To test a hypothesis there are various tests like Student’s t-test, F test, Chi square test, ANOVA etc. and the conditions and methods to apply these tests are explained here. Only the correct use of these tests gives valid results about hypothesis testing.
In 2014 Peter Samuels Birmingham City University proposed “Statistical Hypothesis Testing”. They should formulate one or more hypotheses each leading to two possible outcomes: Null Hypothesis (NH or H0): Assumes no difference, association or relationship between the variables Alternative Hypothesis (AH or H1 or HA): Assumes a difference, association or relationship between the variables The use of an appropriate statistical hypothesis test will allow you to decide between these two outcomes by examining the probability value of the test statistic. They relate back the outcome of the hypothesis testing to particular variables in your study; don't just conclude with 'reject the null hypothesis [2].
In 2015 Valentina Cipriani, et al proposed “Statistics note 7: multiple hypotheses testing to adjust or not to adjust”. They are more likely than not to find at least one test significant. In other words, if we go on carrying out tests of significance we are very likely to find a spurious significant result. In the field of statistics, this phenomenon is known as the problem of multiple testing or the multiplicity problem.1 Consider the ABC study which compared age-related macular degeneration with standard National Health Service (NHS) care.2 This study was conducted on 131 patients and found that 21 (32%) of patients treated with bevacizumab gained ≥15 letters compared with two (3%) of those in the standard care group with an OR of 18.1 (95% CI 3.6 to 91.2; p<0.001)[20].
In 2016 Syed Muhammad et al proposed “Formulating and Testing Hypothesis” They cannot take a single step forward in any inquiry unless we begin with a suggested explanation or solution of the difficulty which originated it. Such tentative explanations are suggested to us by something in the subject-matter and by our previous knowledge. When they are formulated as propositions, they are called hypotheses.
The hypothesis (plural hypotheses) is a tentative solution of a problem. This is the operational meaning of the term hypothesis. Hypothesis is the composition of some variables which have some specific position or role of the variables i.e. to be verified empirically. It is a proposition about the factual and conceptual elements. Hypothesis is called a leap into the dark. It is a brilliant guess about the solution of a problem [22].
In 2017 Jinyuan Chang et al proposed “Simulation-Based Hypothesis Testing of High Dimensional Means under Covariance Heterogeneity”. They Study the problem of testing the mean vectors of high dimensional data in both one-sample and two-sample cases. The proposed testing procedures employ maximum-type statistics and the parametric bootstrap techniques to compute the critical values.
Theoretical properties of the proposed tests are investigated. Through extensive numerical experiments on synthetic data sets and an human acute lymphoblastic leukemia gene expression data set, we illustrate the performance of the new tests and how they may provide assistance on detecting disease-associated gene-sets. The proposed methods have been implemented in an R-package HDtest and are available on CRAN.
In 2018 Daniel Goldman proposed “The Basics of Hypothesis Tests and Their Interpretations”. They summarize the nature of hypothesis tests, as well as their interpretations, including the importance of understanding the underlying phenomenon being tested. They assume that our null hypothesis is true. Then make a number of observations, and estimate the probability of seeing those observations, under the assumption that our null hypothesis is true. They also assume that observations we make are not unusual: if they observe something, we assume that it is not an extremely rare observation. Admittedly, the example that provided was pathological. They are generated through our understanding of real world phenomenon [6].
In 2019 Frank Emmert Streib , and Matthias Dehmer proposed “Understanding Statistical Hypothesis Testing: The Logic of Statistical Inference”. They provided a primer on statistical hypothesis testing. Due to the difficulty of the problem, they were aiming at an accessible level of description and presented the bare backbone of the method. They avoided application domain specific formulations in order to make the knowledge transfer easier to different application areas in data science including biomedical science, economics, management, politics, marketing, medicine, psychology or social science [7].
In 2020 Dan-Yu Lin proposed “Evaluating the Efficacy of COVID-19 Vaccines”. It is important to evaluate the effect of vaccination on disease severity.
To provide a full picture of vaccine efficacy and make efficient use of available data, we propose using SARSCoV-2 infection, COVID-19, and severe COVID-19 as dual or triple primary endpoints. We demonstrate the advantages of this strategy through realistic simulation studies.
They showed how this approach can provide rigorous interim monitoring of the trials and efficient assessment of the durability of vaccine efficacy.
They presented a simple and rigorous framework to consider the totality of evidence when evaluating the benefit of a COVID-19 vaccine in reducing SARS-CoV-2 infection, COVID-19, and severe COVID-19[8].
IV. PROBLEM STATEMENT
Some of the problem when we are performing parametric and non-parametric tests (hypothesis test) these are
- We would like to say something about the population from which the samples come, and this is best done with estimates of parameters and confidence intervals.
- It is difficult to do flexible modeling with given data set so we need some kind of hypothesis.
- Hypothesis tests usually have more statistical power than other equivalents test. So we need to detect significant differences when they truly exist.
V. THE PROCESS OF HYPOTHESIS TESTING
A. Step 1: Construct a Hypothesis
During this stage we formulate two hypotheses to test:
- Null hypothesis (Ho): A hypothesis that proposes that the observations are a result of a pure chance and there is no effect relationship or difference between two or more groups.
- Alternative hypothesis (Ha): A hypothesis that proposes that the sample observations are influenced by some non-random cause and there is an effect or difference between two or more groups. It is the claim trying to prove with an experiment.
B. Step 2: Set the Significance Level (α)
The significance level (denoted by the Greek letter α) is the probability threshold that determines when you reject the null hypothesis. We can choose a significant level of 0.01, 0.05, or 0.10, but any value between 0 and 1 can be used. Setting the significant level α = 0.01 means that there is a 1% chance that alternative hypothesis when null hypothesis is actually true.
C. Step 3: Calculate the Test Statistic Computed from sample data, the test might be:
Chi-Square: To compare categorical variables.
Given a test statistic, we can assess the probabilities associated with the test statistic which is called a p-value. P-value is the probability that a test statistic at least as significant as the one observed would be obtained assuming that the null hypothesis was true. The smaller the p-value, the stronger the evidence against the null hypothesis.
D. Step 4: Drawing a Conclusion
Compare the calculated p-value with the given level of significance α. if the p-value is less than or equal to α, we reject the null hypothesis and if it is greater than α, we fail to reject the null hypothesis. In the above example, since our p-value is less than 0.05, we reject the null hypothesis and conclude that giving a discount has an effect on the quantity of the orders.
E. Step 5: Decision Errors
When we decide to reject or fail to reject the null hypothesis, two types of errors might occur.
- Type I error: A Type I error occurs when we reject a null hypothesis when it is true. The probability of committing a Type I error is the significance level α.
- Type II error. A Type II error occurs when we fail to reject a null hypothesis that is false.
VI. ILLUSTRATE WITH EXAMPLE
Table 1 observed frequency for Corona Disease Treatment and Age Factor
|
Age Factor /Corona disease Treatment |
Above 70 year |
Between 60 to 70 year |
Between 50 to 59 year |
Between 40 to 49 year |
Below 40 year |
Total |
|
Ventilator |
24 |
48 |
28 |
12 |
8 |
120 |
|
Home quarantine |
16 |
48 |
60 |
48 |
28 |
200 |
|
ICU |
8 |
12 |
12 |
4 |
4 |
40 |
|
Hospitalized coved center |
4 |
12 |
12 |
8 |
4 |
40 |
|
Total |
52 |
120 |
112 |
72 |
44 |
400 |
The numbers in this table are known as the observed frequencies.
For instance,
- There is 4 Corona disease Treatment categories and 5 Age factor ;
- We succeeded in taking random sample from our entire sample of n = 400 respondents
- We have total 24 patients are ventilator respondents with a Age factor more than 70 and We have total 16 patient home quarantine respondents with a Age factor more than 70.
- We have total 48 patient ventilator respondents with Age factor between 60 to 70 and we have 48Home quarantine respondents with age factor 60 to 70.
- We have12Hospitalizedcovid care patient respondents with age factor between 50 to 59.
A. Chi-Square Test - Column Percentages
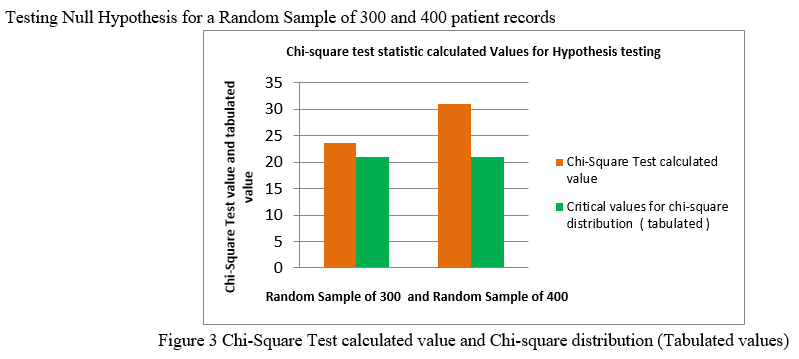
Table 2 Percentages of age factor and Corona disease Treatment for random sample 400
|
Age factor / Corona DiseaseTreatment |
Above 70 year |
Between 60 to 70 year |
Between 50 to 59 year |
Between 40 to 49 year |
Below 40 year |
Total |
|
Ventilator |
46.15% |
40% |
25% |
16.66% |
18% |
30% |
|
Home quarantine |
30.76% |
40% |
53.57% |
66.66% |
63.63% |
50% |
|
ICU |
15.38% |
10% |
10.71% |
5.55% |
9% |
10% |
|
Hospitalized covid center |
7.6% |
10% |
10.71% |
11% |
9% |
10% |
|
Total |
100% |
100% |
100% |
100% |
100% |
100% |
Table 2 shows for each Age factor percentages of respondents that fall into each Corona Disease Treatment status category.. If we inspect the first row, we see that 46.15% of respondents with age factor more than 70 year Corona Disease Treatment needs ventilator.
- Expected Frequencies
Expected frequencies are the frequencies we expect in our sample if the null hypothesis holds.
If factor and Corona Disease required Treatment are independent in our population, then we expect this in our sample too.
These expected frequencies are calculated as
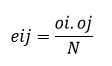
- eij is an expected frequency;
- oi is a marginal column frequency;
- oj is a marginal row frequency;
- N is the total sample size.
So for our first cell, that'll be
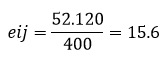
2. Residuals
Insofar as the observed and expected frequencies differ, our data deviate more from independence. So how much do they differ? First off, we subtract each expected frequency from each observed frequency, resulting in a residual. That is,
rij=oij-eij
For our example, this results in (5 * 4 =) 20 residuals. Larger (absolute) residuals indicate a larger difference between our data and the null hypothesis. We basically add up all residuals, resulting in a single number: the χ2 (pronounce “chi-square”) test statistic.
3. Test Statistic
The chi-square test statistic is calculated as
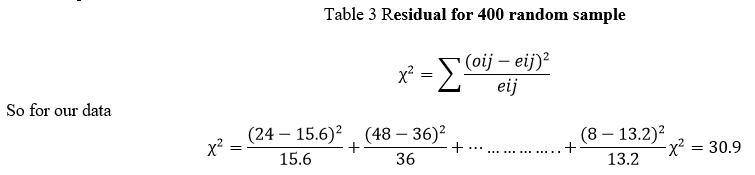
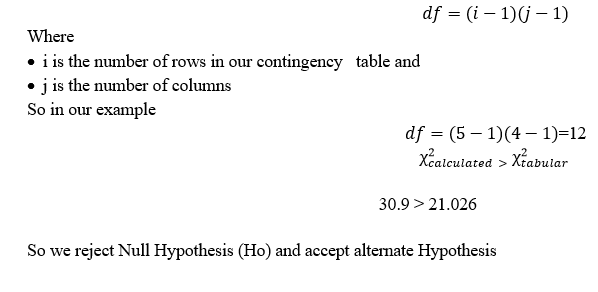
B. Chi-Square Test - Degrees of Freedom
We'll get the p-value we're after from the chi-square distribution if we give it 2 numbers:
- The χ2 value (30.9) and
- The degrees of freedom (df).
The degrees of freedom are basically a number that determines the exact shape of our distribution.
Now, degrees of freedom -or df- are calculated as
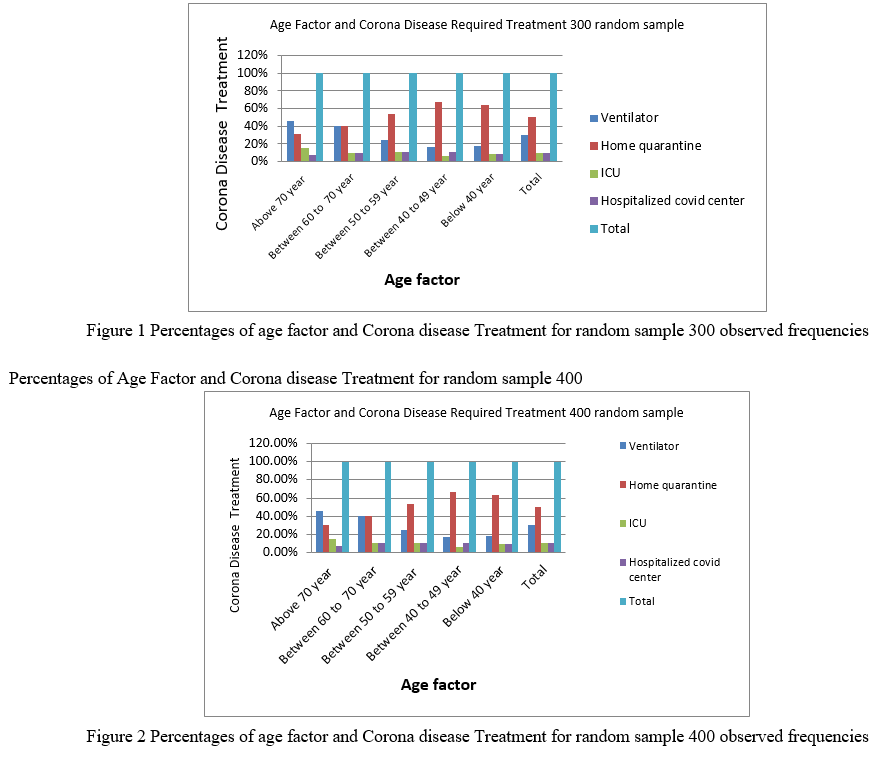
VII. ILLUSTRATE WITH EXAMPLE
Age Factor and Corona disease Treatment for random sample 300.
Conclusion
There are several methods exist for performing statistical test but these method are dependent upon the type of data and variables. In the proposed work chi-square independence test used for testing if two categorical variables are related in some population. We perform following important task, State the null and alternative hypotheses, Specify the decision rule and the level of statistical significance for the test, i.e., .05, .01, or .001 Compute the expected values and compute the chi-square statistic, We have taken 1000 data form 3 dedicated COVID-19 hospitals and five COVID-19 care centre. The data is sorted into different age group and COVID-19 treat type given to patient. We have taken four treatment type ICU, Ventilator, Hospitalized covid center, Home quarantine and different age from 25 to 80 age groups persons. We used random sample of 300 and 400 to test hypothesis
References
[1] Valen E. Johnson1 “Revised standards for statistical evidence” Department of Statistics, Texas A&M University, College Station, TX 77843-3143 Edited by Adrian E. Raftery, University of Washington, Seattle, WA, and approved October 9, 2013 (received for review July 18, 2013). [2] Peter Samuels Birmingham City University Statistical Hypothesis Testing Technical Report · April 2014 Mollie Gilchrist and Peter Samuels Reviewer: Ellen Marshall www.statstutor.ac.uk Birmingham City University of Sheffield [3] Kim, Jae “How to Choose the Level of Significance: A Pedagogical” Note 31 August 2015 Online at https://mpra.ub.uni-muenchen.de MPRA Paper No. 66373, posted 01 Sep 2015 06:34 UTC. [4] Marko A. “Null Hypothesis Significance Testing In Simulation” Proceedings of the 2016 Winter Simulation Conference [5] Sendil Mourougan, Hypothesis Development and Testing IOSR Journal of Business and Management (IOSR-JBM) Volume 19, Issue 5. Ver. I (May. 2017). [6] Daniel Goldman “The Basics of Hypothesis Tests and Their Interpretations” August 2018 https://www.researchgate.net [7] Frank Emmert-Streib , and Matthias Dehmer “Understanding Statistical Hypothesis Testing: The Logic of Statistical Inference” 27 July 2019; Accepted: 9 August 2019; Published: 12 August 2019 Mach. Learn. Knowl. Extr. 2019. [8] Bradley E. Alger “Hypothesis-Testing Improves the Predicted Reliability of Neuroscience” Research this version posted February 4, 2019. [9] Jingyi Jessica Li and XinTong “Statistical Hypothesis Testing versus Machine Learning Binary Classification: Distinctions and Guidelines” Department of Data Sciences and Operations, Los Angeles, CA 90089, Correspondence: https://doi.org 2020. [10] Dan-Yu Lin, Donglin Zeng Evaluating the Efficacy of COVID-19 Vaccines medRxiv preprint doi: https://doi.org/10.1101 this version posted October 5, 2020. [11] David Delgado-Gómez “Improving the Teaching of Hypothesis Testing Using a Divide-and-Conquer Strategy and Content Exposure Control in a Gamified Environment” Mathematics 2020, 8, 2244; doi:10.3390/math8122244. [12] Bradley E. Alger Scientific Hypothesis-Testing Strengthens Neuroscience Research 2020 Department of Physiology and Program in Neuroscience, University of Maryland . [13] Ghaith Habboub, MD Matthew M. Grabowski “The embedded biases in hypothesis testing and machine learning Neurosurg Focus” Volume 48 • May 2020 Unauthenticate
Copyright
Copyright © 2022 Amit Shekhar , Dr. Sachin Patel . This is an open access article distributed under the Creative Commons Attribution License, which permits unrestricted use, distribution, and reproduction in any medium, provided the original work is properly cited.

Download Paper
Paper Id : IJRASET40262
Publish Date : 2022-02-07
ISSN : 2321-9653
Publisher Name : IJRASET
DOI Link : Click Here
 Submit Paper Online