

Ijraset Journal For Research in Applied Science and Engineering Technology
Application of Response Surface Methodology (RSM) in optimization of Surface Modification using Friction Stir Processing
Authors: Shashikant Sharma, M. K. Gaur
DOI Link: https://doi.org/10.22214/ijraset.2022.40411
Certificate: View Certificate
Abstract
Surface modification is the process of enhancing surface properties either through physical, chemical and biological effects in order to achieve superior surface quality. In this dissertation, initially the Aluminium composite is prepared using reinforcement of Boron Carbide nanoparticle which is inserted in a groove prepared on the specimen (AA5083 plate). Furthermore, the specimens are then taken for various tests including Ultimate Tensile Strength, Yield Strength, and characterization of material with the help of XRD and Tribological behavior of material respectively. Results are noted and taken to Analysis of variance for checking the feasibility of the designed model. It is discovered that, p- values for various responses were less than 0.05 which indicates that model is significant while lack of fit is maintained insignificant. Eventually, for obtaining the optimum values for various responses, F value was taken in order to investigate the dominating parameters. Finally conclusion were drawn which reveals that raising the TRS and Number of passes while dropping the TTS promotes better results.
Introduction
I. INTRODUCTION
Friction Stir processing (FSP) is an extension to Friction Stir welding (FSW) is used for microstructure modification [8]. Significant changes are seen in Microstructures due to the plastic deformation, mixing and thermal exposure present in the Stir Zone (SZ) [9].
Solid mixing and mechanically activated effect, produced due to extreme deformation of FSP, are the effects manifested while in situ reaction occurs in FSP [8, 10]. Precursor is developed through powder mixture of constituents via conventional hot pressing
(HP) or sintering route and after that FSP is performed for fabricating in- situ AMC's [8, 10]. Crucial aim of HP or sintering is to develop billet with sufficient ductility and strength for upcoming FSP. With variations in parameters of HP, variation in in-situ reactions is seen which has a direct impact on microstructure evolution, mechanical properties of composites. This effect is reflected due to size and structure of reinforcing particles developed during sintering [10]. The friction stir process experiment will be conducting at the Figure 1.
A. Working Principle of FSP
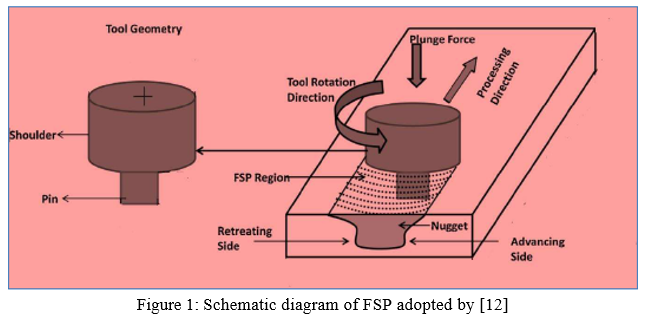
The tool designed for the processing is non-consumable tool, which is developed with two special parts i.e. the bigger shoulder and the smaller lower probe. Initially the tool is given a high rotational speed followed by work piece being brought to contact with tool such that shoulder starts touching the work piece. The tool is provided the motion in such a direction such that plastic deformation and heating supplements the temperature of material and it is deformed with lower flow stress [11].
The combined effect of translation and rotation of the tool generates asymmetry in characteristics at two sides namely the advancing side (AS) where the translation of tool follows the rotation and the other is retreating side (RS) where the direction turns up to be opposite. Figure 1. Schematic diagram of friction stir processing adopted by [12] evident that microstructure generated in the two different scenarios will be different. Due to the above processing, Stir zone formation occurs at the centre where due to sheer plastic deformation and thermal exposure, at the centre of the processed zone microstructure refinement is absolutely observable.
P.R. et al. [12] worked on Al-Si alloy which is developed through FSP at variable speed ranging from 800rpm to 1400rpm and its speed vary from (60-150)mm/min and the plunger force developed between (4-9)KN. Experimentation was carried out using SEM and optical microscope. Results were generated to study the changes in mechanical properties and machinability of the specimen. Finally it was registered that YS, UTS and ductility got increased significantly.
R. Vaira et al. [15] applied the FSP on AA5083 with the agenda of enhancing the wear resistance. FSP was conducted using face centered central composite with initial input parameters as TRS, TTS and TSD. Results were carried out which depicts that the wear resistance of most of the FSPed specimens were greater than initial material and eventually a model is prepared to analyse the correlation between the process parameters and the wear resistance.
Vipin et al. [21] worked on Aluminium alloy by considering speed, feed and depth of cut as the initial input parameters for the purpose of performing FSP. Optimization is carried using Taguchi orthogonal array with its 3 levels. The entire experimentation is delivered through CNC with specifically designed tools.
Nitin et al. [22] worked on AA7005 alloy for purpose of enhancing resistance using titanium and boron carbide reinforcement nanoparticles. Surface composites were prepared using FSP which was further tested using the Micro Hardness Test and depth of penetration. Results manifested that both micro hardness and depth of penetration were higher than the initial base metal, thus ballistic mass efficiency got improved significantly.
Ali et al. [23] worked on Aluminium composite having SiC nanoparticles. The developed specimens were tested to check various properties such hardness, ductility, yield strength and finally the tensile properties. Significant improvements were registered in terms of hardness, while strain rates saw a hike at elevated temp. Finally it can be stated that YS was also improved tremendously up to 240% as seen by the data obtained through results.
Issac et al. [24] worked on Aluminium AA6061 along with some components of Magnesium and Cu, where the reinforcement used is FA, which is cost effective by nature. After the successful preparation of composition it is put to various equipment’s namely optical microscope, SEM and finally EBSD.
Very few studies related to coating in the surface of aluminum alloy AA5083 of FSP zone are mentioned in literature. Various types of reinforcement (Artificial and different type of natural reinforcement) can be used during modification of surface of aluminum alloy AA5083 with the help of FSP to enhance the micro structural and physical properties. Refrigeration of FSP zone is mentioned in very rare literatures. Cooling Agents which can be employed for such purpose could be water, liquid nitrogen and methanol respectively.
II. EXPERIMENT METHOD
A. Design of Experiment (DOE)
In the detailed research studies, it is quite evident that FSP process parameters such as depth of penetration, traverse speed, tool tilt angle etc has a crucial role to play in physical and chemical properties of the applied specimen. Traditional design technique is applied in areas where a single parameter is varied and its impact is visualized, which implies a requirement to perform several experiment in order to investigate its significance. The entire process is quite tedious and time killing. Basically the experiment design processes consist of 3 fundamentals:
- Randomization: Experimental runs should be arranged in a random order for the purpose of neutralizing the impact of outer noise factors.
- Replication: For every factor combination it is anticipated to achieve similar experimental runs which helps in calculation of experimental errors generated. For identifying if given differences in the data are mathematically varying; error measurement is the crucial element.
- Blocking: This parameter is helpful in mitigating the impact of factors which influences the response but is quite insignificant for our purpose. These are referred to as noise factors. Similar experimental situations are generally referred to as Block, in which the experimenter partitions up the investigation from the mathematical design into groups that follows each block [14]. Entire process is carried forward for investigating the input parameters and to develop statistical models to understand the connection among the parameters.
Steps followed to achieve the above condition are:
a. Identification of essential process control factors
b. Deciding the working scope of the procedure control factors, viz. TRS, TTS and Number of Passes
c. Developing the design matrix
d. Conducting the examinations according to the design matrix
e. Recording the reactions viz. Vickers hardness, % Elongation, UTS and YS.
f. Developing the numerical models
g. Checking the adequacy of the models
h. Finding the significance of coefficient
i.Developing the final proposed models
j. Plotting of diagrams and drawing conclusion
k. Discussion of the outcomes
4. Identification Of Numerous Process Control Factors: On behalf of the FSP geometry there are basically 3 specific parameters which need to be considered such as the TRS, TTS and number of passes. For the experimentation purpose the considered parameters are Vickers hardness, % Elongation, UTS and YS.
5. Deciding The Range Of The Process Factors: Preliminary runs are performed by varying a single parameter while maintaining the other parameters as constant. Working range is kept constant by observing the FSP geometry for the smooth appearance and the Non-appearance of fixed deformities. The upper and lower limits were coded as +1 and -1, individually. The coded esteems for middle of the road esteems can be computed from the relationship, Where, Xi is the required coded estimation of a variable X, when X is any estimation of the variable from Xmin to Xmax; Xmax and Xmin are the most extreme and least levels of the factors. They chose procedure parameters and their upper and lower restrains together with documentations and units are given in Table 1.
B. Developing the design framework
A 3 factor 3 level composite design matrix was utilized for the experiment. A Face centered CCD matrix covers more noteworthy design space than the factorial design matrix lattice, consequently bringing about more prominent exactness of the established relationship. Table 1 demonstrates the 20 sets of coded conditions used to frame the outline lattice-
C. Work piece Composition and its Properties
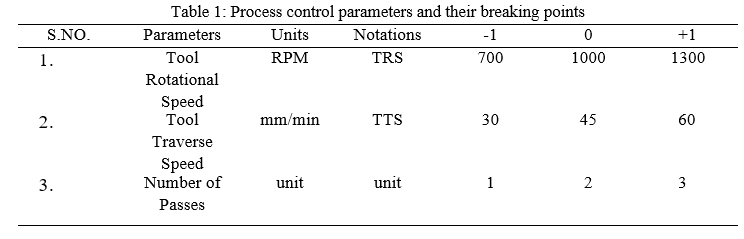
AA 5083 is used for the experiment. The size of work piece used is 200mm (length), 80mm (width) and 6mm (thickness) as per the requirements of Friction Stir Processing Machine. A total of 10 plates were used to perform 20 experiments. The composition of AA5083 (Shown in figure: 2) is as follows in Table 2:
III. STATISTICAL ANALYSIS
Models are developed on behalf of control system for FSP process to judge surface properties and to construct correlate input parameters like TTS, TRS and Number of passes to UTS, YS and % Elongation. These models are inserted to the computer in order to judge the surface quality for a particular combination of process parameter. The final data was gathered to analyse the non-linearity of models and then the feasibility of the model is judged using ANOVA and plots. Design expert 11.0.6 (Trial version) was used for this purpose.
A. Developments of Statistical Models
The output response in relation with input process parameter can be expressed as: -
Y = f (TRS, TTS, Number of Passes)
Y = Friction Stir Process response;
TRS = Tool Rotational Speed;
TTS = Tool Traverse Speed;
B. Investigating the feasibility of the model
ANOVA technique is useful for investigation of the feasibility of the proposed model. According to this method:
- F ratio marks the platform for evaluating the confidence test, wherein the similarity is tested between the calculated and the reference tabulation.
- Important condition that relies for feasibility is that Calculated F ratio should always fall short of the reference value, which indicates that model is suitable enough for feasibility. For our analysis, we have assumed the confidence level to be 95%.
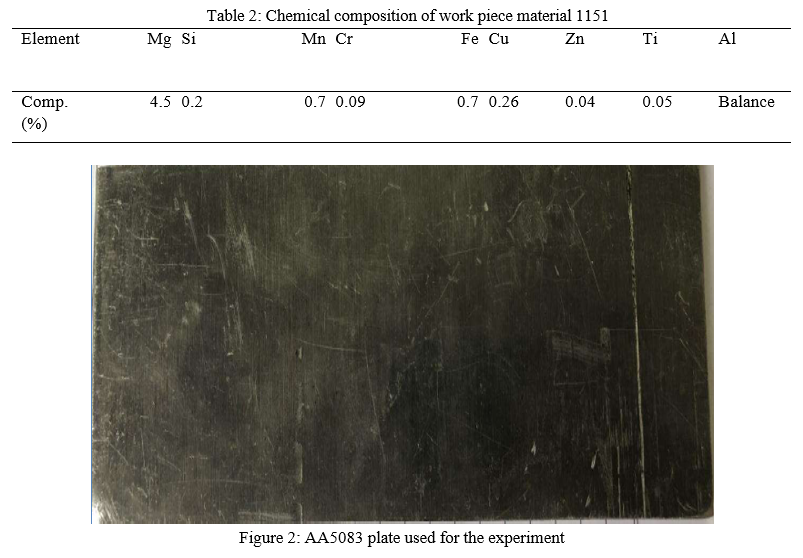
C. Response 1: UTS
Sum of squares is Type III - Partial
The Model F- value of 144.41 indicates that the current model under investigation stands significant. Small percentage proportion of occurrence of F value higher could happen on account of noise i.e. 0.01%.
P value should not exceed the figure of 0.05 in order to remain significant. It is observed that A, B, C, AC, BC, A2, B2, C2 were crucial/significant terms. If the P-values reach above the figure of 0.1; it reflects that model stands insignificant. Thus if the number of insignificant terms are higher in any model, it is recommended to shorten the model by decreasing the parameter in order to enhance the model. Finally, the Lack of fit F value should remain insignificant for a model in comparison to the pure error. For the current model we achieved 58.81% chance of lack of fit F-value, which could primarily arise due to noise factors.
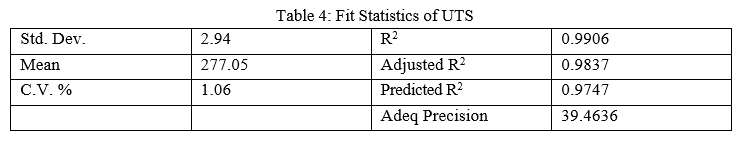
The Predicted R2 value is in close approximation with the Adjusted R2 value with a slight variation of 0.2.
Adeq Precision enables the user to calculate the S/N ratio. This ratio stands suitable at a desired value of 4 which is 39.464 in our case, thus the signal achieved is quite desirable. Further, this model entitles itself to be satisfiable in the design area.
Final Equation in Terms of Coded Factors of UTS
UTS = +270.66+3.33*A-2.50*B+17.01*C+0.8839*AC-1.15*BC-3.33*A2+5.16*B2+2.68*C2
Equations obtained in terms of coded factors are suitable to make assumptions regarding data for given levels of each parameter. Usually, the higher parameters are mark coded as +1 while the lower parameters are referred with-1. Factor coefficient evaluation is beneficial for quantifying the relative effect of the factors in coded equations.
Final Equation in Terms of Actual Factors of UTS
UTS=+261.70000+0.211091*TRS-5.68303*TTS-0.346970*Number of Passes+0.008333*TRS *Number of Passes-0.216667*TTS * Number of Passes0.000105*TRS2+0.064848*TTS2+7.59091*Number of Passes2
The equation developed on account of actual parameters can be utilized for framing assumption about the output data for given level of each parameter. It is required for each level to be quantified in their respective units for each parameter. This equation should be exempted from examining the relative effect of each parameter as the initial coefficient are magnified to settle up with the units of each parameter while the intercept is not adjusted to the centre of the design area.
C. Response 2: YS
Sum of squares is Type III - Partial
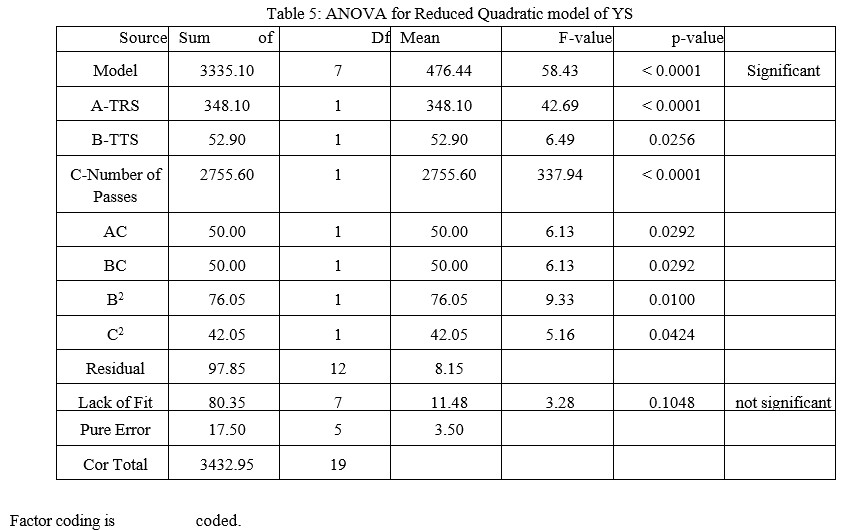
The Model F-value of 58.43 indicates that the current model under investigation stands significant. Small percentage proportion of occurrence of F value higher could happen on account of noise i.e. 0.01%.
P-values should not exceed the figure of 0.0500 in order to remain significant. It is observed that A, B, C, AC, BC, B2, C2 were crucial/significant terms. If the P-values reach above the figure of 0.1; it reflects that model stands insignificant. Thus if the number of insignificant terms are higher in any model, it is recommended to shorten the model by decreasing the parameter in order to enhance the model.
Finally, the Lack of fit F value should remain insignificant for a model in comparison to the pure error. For the current model we achieved 10.48% chance of lack of fit F-value, which could primarily arise due to noise factors. Non-significant lack of fit is good -- we want the model to fit.
Table 6: Fit Statistics of YS
|
Std. Dev. |
2.86 |
R2 |
0.9715 |
|
Mean |
163.55 |
Adjusted R2 |
0.9549 |
|
C.V. % |
1.75 |
Predicted R2 |
0.8824 |
|
|
|
Adeq Precision |
27.6854 |
The Predicted R2 value is in close approximation with the Adjusted R2 value with a slight variation of 0.2.
Adeq Precision enables the user to calculate the S/N ratio. This ratio stands suitable at a desired value of 4 which is 27.6854 in our case, thus the signal achieved is quite desirable. Further, this model entitles itself to be satisfiable in the design area.
Final Equation in Terms of Coded Factors of YS
YS =+162.92+3.51*A-1.37*B+9.87*C-0.8839*AC+0.8839*BC+1.72*B2-1.28*C2
Equations obtained in terms of coded factors are suitable to make assumptions regarding data for given levels of each parameter. Usually, the higher parameters are mark coded as +1 while the lower parameters are referred with-1.Factor coefficient evaluation is beneficial for quantifying the relative effect of the factors in coded equations.
Final Equation in Terms of Actual Factors of YS
YS =+144.66667+0.036333*TRS-2.43667*TTS+31.93333*Number of Passes-0.008333*TRS * Number of Passes+0.166667*TTS * Number of Passes+0.021667*TTS2-3.62500*Number of Passes2
The equation developed on account of actual parameters can be utilized for framing assumption about the output data for given level of each parameter. It is required for each level to be quantified in their respective units for each parameter. This equation should be exempted from examining the relative effect of each parameter as the initial coefficient are magnified to settle up with the units of each parameter while the intercept is not adjusted to the centre of the design area.
IV. RESULT AND DISCUSSION
A. Analysis of Result
- Effect of Analysis on UTS
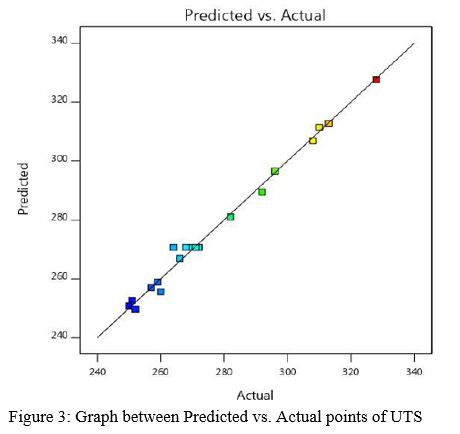
The above graph depicts actual data of UTS on x-axis while predicted data of UTS on the y-axis. Red dots represent highest value of UTS while a blue dot represents the least values of UTS. From the graph, it is evident that actual data approaches similarity to predicted data. The graph shows that correlation between Predicted and Actual data points.
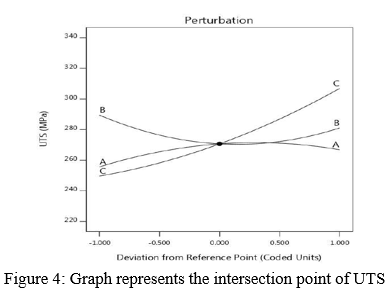
The above graph depicts deviation from eference point on x-axis while UTS on the y-axis. This graph is called perturbation curve. In this graph, 3 different coding factors named as A, B and C is intersecting at a point.
2. Effect of Analysis on YS
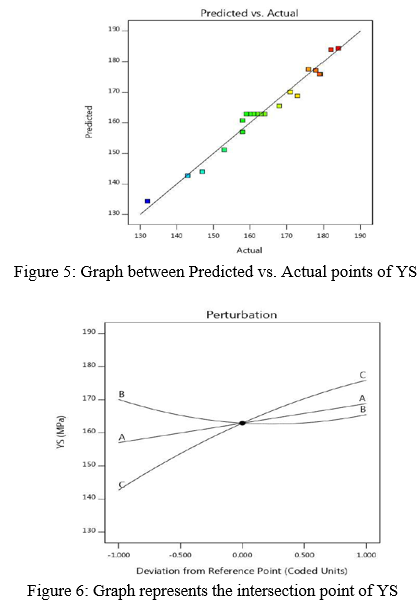
The above graph depicts actual data of YS on x-axis while predicted data of YS on the y-axis. Red dots represent highest value of YS while a blue dot represents the least values of YS. From the graph, it is evident that actual data approaches similarity to predicted data.
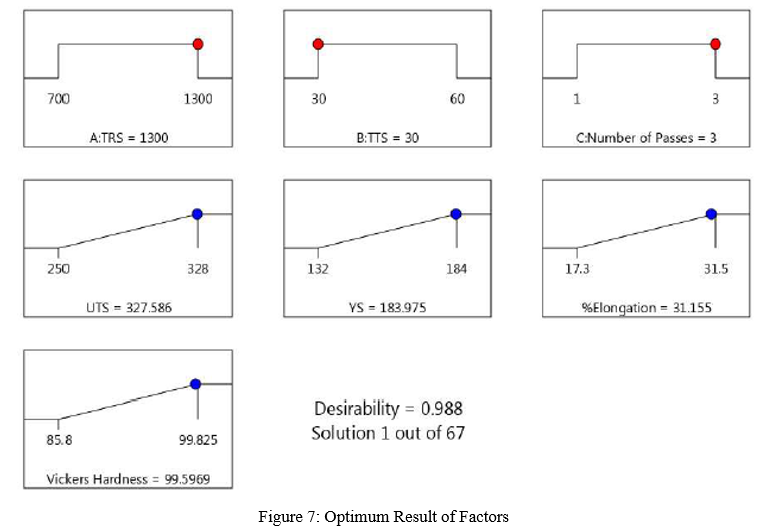
The above graph depicts deviation from reference point on x-axis while YS on the y-axis. This graph is called perturbation curve. In this graph, 3 different coding factors named as A, B and C are intersecting at a point.
B. Optimization of Result
The important step is the optimization of result of the experiment. Optimizations of different response parameter are described following below:
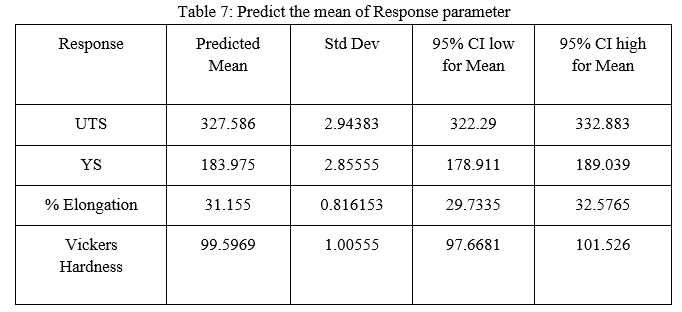
The optimum result has obtained at maximum value of TRS = 1300 MPa, minimum value of TTS = 30 mm/min and number of Passes = 3 unit. The optimum values are for UTS = 327.586 MPa, YS = 183.975 MPa, %Elongation =31.155% and Vickers Hardness= 99 HV with the desirability 98.80 %.
C. Point Prediction
This Table 7 describe the predict the mean of response parameter, Std Dev , 95% CI low for Mean and 95% CI high for Mean on the basis of data points of responses. The point predictions of Responses are following below in the Table 5.1:
D. Discussion
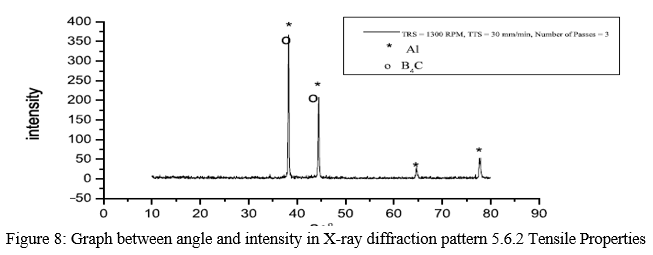
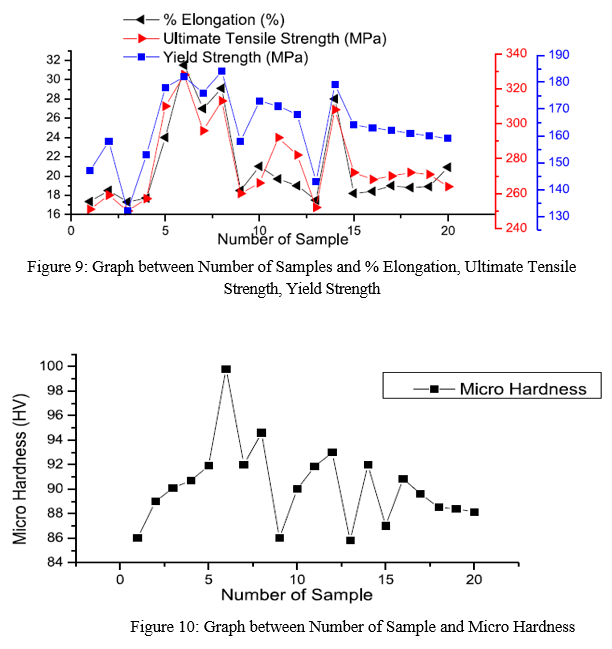
- XRD Testing: In this experiment of FSP occur different testing procedures. For the characterization of material is to find out the chemical composition and the phases of the material. Peaks are detected in this X ray diffraction pattern. Figure 8 shows the graph between angle and intensity in X ray diffraction pattern.
In this experiment perform the experimentation of tensile strength in which identifies the Ultimate Tensile Strength, Yield Strength, %Elongation of the base metal and 20 experiments. Base metal have identified the ultimate tensile strength = 302 MPa, Yield Strength = 153 MPa, % Elongation = 33.8%.The maximum tensile strength was achieved in the B4C nano particles with three passes.
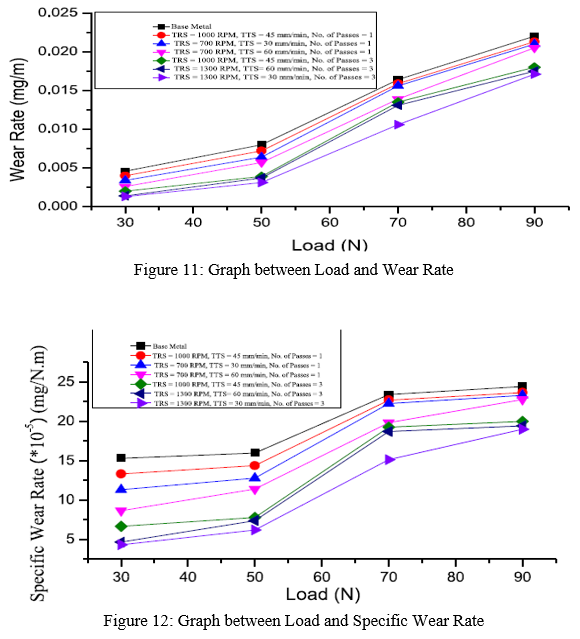
2. Wear Behaviours: In dry sliding wear behaviours testing was performed in the different specimens. The weight loss of base material is higher than the specimens of FSP zone. The hard specimen has less weight loss so low wear rate of the hard specimen occurred. Higher load, higher wear rate is observed. Figure 11 depicts the relationship between loads and wear rate.
Conclusion
This dissertation presented the work for the investigation of surface modification of Aluminium Alloy using Friction Stir Processing using Reinforcement of Boron Carbide by adopting Response Surface Methodology for optimization. Results were generated, on account of which following conclusions can be drawn as:- 1) Results presented that UTS has major influential role primarily from Number of Passes having F value of 943.86, followed by TRS with F value of 36.19 and finally TTS having F value of 20.36. 2) Results presented that YS has major influential role primarily from Number of Passes having F value of 337.94, followed by TRS with F value of 42.69 and finally TTS having F value of 6.49. 3) The optimum result has obtained at maximum value of TRS = 1300 MPa, minimum value of TTS = 30 mm/min and number of Passes = 3 unit. The optimum values are for UTS = 327.586 MPa, YS = 183.975 MPa, %Elongation =31.155% and Vickers Hardness= 99 HV with the desirability 98.80 %. 4) The interactions between TRS and TTS (AxB), TRS and Number of Passes (AXC) and TTS and Number of Passes (BxC) significantly affect the performance characteristics. 5) It concludes that maximum hardness can be achieved when tool rotational speed and number of passes have maximum value and tool traverse speed have minimum value with the B4C nano particle. 6) Higher load, higher wear rate can be observed.
References
[1] Kurt, A., Uygur, I., & Cete, E. (2011). Surface modifications of aluminum by friction stir processing. Journal of Materials Processing Technology, 211(3), 313-317. [2] Rathee, S., Maheshwari, S., Siddiquee, A. N., & Shrivastava, M. (2017). Effect of tool plunge depth on reinforcement particles distribution in surface composite fabrication via friction stir processing. Defence technology, 13(2), 86-91. 68 [3] Nascimento, F., Santos, T., Vilaça, P., Miranda, R. M., & Quintino, L. (2009). Microstructural modification and ductility enhancement of surfaces modified by FSP in aluminium alloys. Materials Science and Engineering: A, 506(1-2), 16-22. [4] Mironov, S., Sato, Y. S., & Kokawa, H. (2019). Friction-stir processing. Nano crystalline Titanium, 55–69. Doi10.1016b978-0-12-814599-9.00004-3. [5] Guru, P. R., Khan, F., Panigrahi, S. K., & Ram, G. J. (2015). Enhancing strength, ductility and machinability of a Al–Si cast alloy by friction stir processing. Journal of manufacturing processes, 18, 67-74. [6] Sharma, V., Prakash, U., & Kumar, B. M. (2015). Surface composites by friction stir processing: A review. Journal of Materials Processing Technology, 224, 117-134. [7] Montgomery, D. C. (2017). Design and analysis of experiments. John wiley & sons. [8] Gopan, V., Sreekumar, P. S., Chandran, J. P., Vijay, W., & Kumar, M. S. (2018). Experimental Investigation on the Effect of Process Parameters on Friction Stir Processing Of Aluminium. Materials Today: Proceedings, 5(5), 13674-13681. [9] Pol, N., Verma, G., Pandey, R. P., & Shanmugasundaram, T. (2018). Fabrications of AA7005/TiB2-B4C surface composite by friction stir processing: Evaluation of ballistic behaviours. Defence Technology. [10] Hosseinzadeh, A., & Yapici, G. G. (2018). High Temperature Characteristics of Al2024/SiC Metal Matrix Composite fabricated by Friction Stir Processing. Materials Science and Engineering: A. [11] Dinaharan, I., & Akinlabi, E. T. (2018). Low cost metal matrix composites based on aluminum, magnesium and copper reinforced with fly ash prepared using friction stir processing. Composites Communications, 9, 22-26.
Copyright
Copyright © 2022 Shashikant Sharma, M. K. Gaur. This is an open access article distributed under the Creative Commons Attribution License, which permits unrestricted use, distribution, and reproduction in any medium, provided the original work is properly cited.

Download Paper
Paper Id : IJRASET40411
Publish Date : 2022-02-18
ISSN : 2321-9653
Publisher Name : IJRASET
DOI Link : Click Here
 Submit Paper Online