

Ijraset Journal For Research in Applied Science and Engineering Technology
Arduino Based Pressure Sensor Integration in the Measurement of Flow Field
Authors: Sharabanna ., Venkatesh
DOI Link: https://doi.org/10.22214/ijraset.2023.52078
Certificate: View Certificate
Abstract
In fluid mechanics, study of velocity profile for a fluid flow gives better understanding about the nature and physics of fluid. We use manometer and pitot static tube in conventional way to measure the velocity profile .But advances in sensor we can use Arduino with the pressure sensor and study the velocity profile with easy and portable way. The study of velocity measurement has been done with help of sensor and electronics component.
Introduction
I. INTRODUCTION
Fluid Flow is a part of fluid mechanics and deals with fluid dynamics. It involves the motion of a fluid subjected to unbalanced forces.
This motion continues as long as unbalanced forces are applied. For example, if you are pouring water from a mug, the velocity of water is very high over the lip, moderately high approaching the lip, and very low at the bottom of the mug. The unbalanced force is gravity, and the flow continues as long as the water is available and the mug is tilted.
A. Fluid Pressure
A measurement of the force per unit area. Fluid pressure can be caused by gravity, acceleration, or forces in a closed container. Since a fluid has no definite shape, its pressure applies in all directions.
In a fluid column, as the depth increases, the pressure increases as well. Pressure (P) increases because as you go deeper, fluid at a lower depth has to support fluid above it as well. Therefore to define fluid pressure, we can say that it is the pressure at a point within a fluid arising due to the weight of the fluid.
Pressure in liquids is equally divided in all directions, therefore if a force is applied to one point of the liquid, it will be transmitted to all other points within the liquid.The pressure in fluids can be calculated using the following relation:
P = hρg (Pressure = Height or Depth of the liquid × Density of the liquid × Gravitational pull (9.81m/s)).
Pressure is a scalar quantity. The SI Unit (International System of Unit) of pressure is the Pascal, or Newton per meter squared (N/m^2).
B. Flow Velocity
Velocity is the most straightforward term, as it is the average speed of a fluid flowing through the pipe. Think of flow velocity like you consider the speed of your car. Except, instead of recording flow velocity in MPH or km/h, fluid is typically in m/s or ft/s.
Flow Rate: This is the volume of fluid that passes through the pipe per unit of time, recorded in m3/s or ft3/s.
As the equation below shows, flow rate is positively correlated with velocity—as the speed of the fluid increases, the amount (or volume) of fluid passing through the pipe during a given time period also increases.
The characteristics of laminar and turbulent flow are very different. To understand why turbulent or laminar flow is desirable in the operation of a particular system, it is necessary to understand the characteristics of laminar and turbulent flow.
C. Flow Regimes
All fluid flow is classified into one of two broad categories or regimes. These two flow regimes are laminar flow and turbulent flow. The flow regime, whether laminar or turbulent, is important in the design and operation of any fluid system. The amount of fluid friction, which determines the amount of energy required to maintain the desired flow, depends upon the mode of flow. This is also an important consideration in certain applications that involve heat transfer to the fluid.
D. Flow Velocity Profiles
Not all fluid particles travel at the same velocity within a pipe. The shape of the velocity curve (the velocity profile across any given section of the pipe) depends upon whether the flow is laminar or turbulent. If the flow in a pipe is laminar, the velocity distribution at a cross section will be parabolic in shape with the maximum velocity at the Centre being about twice the average velocity in the pipe. In turbulent flow, a fairly flat velocity distribution exists across the section of pipe, with the result that the entire fluid flows at a given single value.
Figure 5 helps illustrate the above ideas. The velocity of the fluid in contact with the pipe wall is essentially zero and increases the further away from the wall.
Features
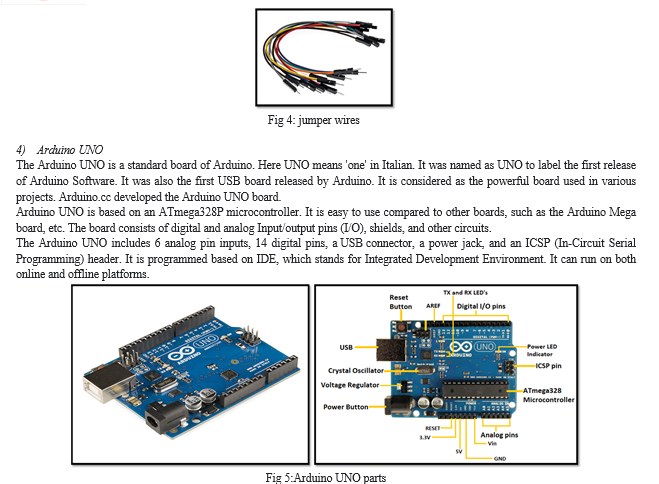
- Board mount pressure sensor series with analogue voltage output and digital i2c output
- calibrated and temperature compensated
- Differential/relative, bidirectional differential, absolute and barometric sensor versions
- Wide variety of pressure ranges: 0.054 psi (1.5 inch water) up to 100 psi full scale
- piezo resistive sensor with high precision digital signal conditioning
- Total accuracy < 0.5 %fso at room temperature for standard pressure ranges
- teb < 1.0 %fso (-25 … 85 °c) for standard pressure ranges
- High long term stability
- Fast response time (typ. < 1 ms)
- Supply voltage range: 4.75 … 5.25 v
- Analog output: 0.5 to 4.5 v ratiometric
- Digital output via i2c interface: 15 bit for pressure and temperature measurement
- Programmable i²c-address
- Ceramic dip-8 package (width: 0.6 inch)
- Package options for tubing or manifold mount (o-ring sealing)
- Substitute product for sm5852 / sm5812
- Rohs Compliant
E. Typical Applications
- Static and dynamic pressure measurement
- Barometric pressure measurement
- vacuum monitoring
- Gas flow
- Fluid level measurement
- Medical instrumentation
- Heating, ventilation and air conditioning
II. LITERATURE SURVEY
Design an Optical Transducer for Pressure Measurement Ashraf Hamza1, Ahmed Khames2, Ali Lesewed3, M. Saad4: This paper presents the optical transducer for pressure measurement. Where, there are many and different types of instruments to measure pressure, such as mechanical measuring instruments and electrical measuring instruments. Each one of them depend on a different working principle.
This type of measuring instruments are highly used since this type is used in airplanes and other places, because it is easy to assemble and disassemble, easy to use, easy to repair, accurate in measuring values, high quality, Its working principle does not depend on few mechanical elements and sensitive to small changes of the pressure. The optical pressure transducer has been designed based on the principle work of the diaphragm and photoconductive circuit
Arduino UNO Components Details
- ATmega328 Microcontroller- It is a single chip Microcontroller of the ATmel family. The processor code inside it is of 8-bit. It combines Memory (SRAM, EEPROM, and Flash), Analog to Digital Converter, SPI serial ports, I/O lines, registers, timer, external and internal interrupts, and oscillator.
- ICSP pin - The In-Circuit Serial Programming pin allows the user to program using the firmware of the Arduino board.
- Power LED Indicator- the ON status of LED shows the power is activated. When the power is OFF, the LED will not light up.
- Digital I/O pins- The digital pins have the value HIGH or LOW. The pins numbered from D0 to D13 are digital pins.
- TX and RX LED's- The successful flow of data is represented by the lighting of these LED's.
- AREF- The Analog Reference (AREF) pin is used to feed a reference voltage to the Arduino UNO board from the external power supply.
- Reset button- It is used to add a Reset button to the connection.
- USB- It allows the board to connect to the computer. It is essential for the programming of the Arduino UNO board.
- Crystal Oscillator- The Crystal oscillator has a frequency of 16MHz, which makes the Arduino UNO a powerful board.
- Voltage Regulator- The voltage regulator converts the input voltage to 5V.
- GND- Ground pins. The ground pin acts as a pin with zero voltage.
- Vin- It is the input voltage.
- Analog Pins- The pins numbered from A0 to A5 are analog pins. The function of Analog pins is to read the analog sensor used in the connection. It can also act as GPIO (General Purpose Input Output) pins.
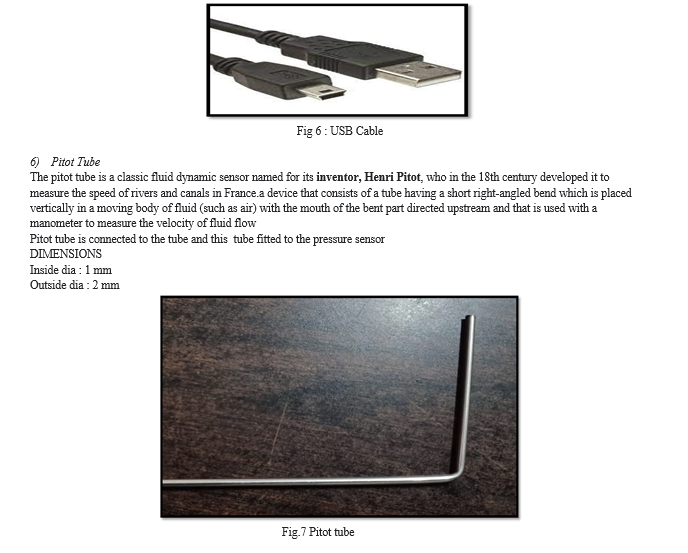
Arduino is an open-source electronics platform based on easy-to-use hardware and software. Arduino boards are able to read inputs - light on a sensor, a finger on a button, or a Twitter message - and turn it into an output - activating a motor, turning on an LED, publishing something online. You can tell your board what to do by sending a set of instructions to the microcontroller on the board. To do so you use the Arduino programming language (based on Wiring), and the Arduino Software (IDE), based on Processing. Over the years Arduino has been the brain of thousands of projects, from everyday objects to complex scientific instruments. A worldwide community of makers - students, hobbyists, artists, programmers, and professionals - has gathered around this open-source platform, their contributions have added up to an incredible amount of accessible knowledge that can be of great help to novices and experts alike. The components of Arduino UNO board are shown below:
5. USB Cable
Soldered Nano compatible, Nano Cable Mini USB to USB ( cable colour might change from the one shown in picture) ATmega328 Operating Voltage (logic level): 5V Input Voltage (r1ecommended): 7V ~ 12V Input Voltage (limits): 6V ~ 20 VDigital I/O Pins: 14 (of which 6 provide PWM output) Analog Input Pins: 8 DC Current per I/O Pin: 40mAFlash Memory: 32KB (ATmega328) (of which 2 KB used by bootloader) SRAM: 2KB (ATmega328) EEPROM: 1KB (ATmega328) Clock Speed: 16MHz"
IV. METHODOLOGY
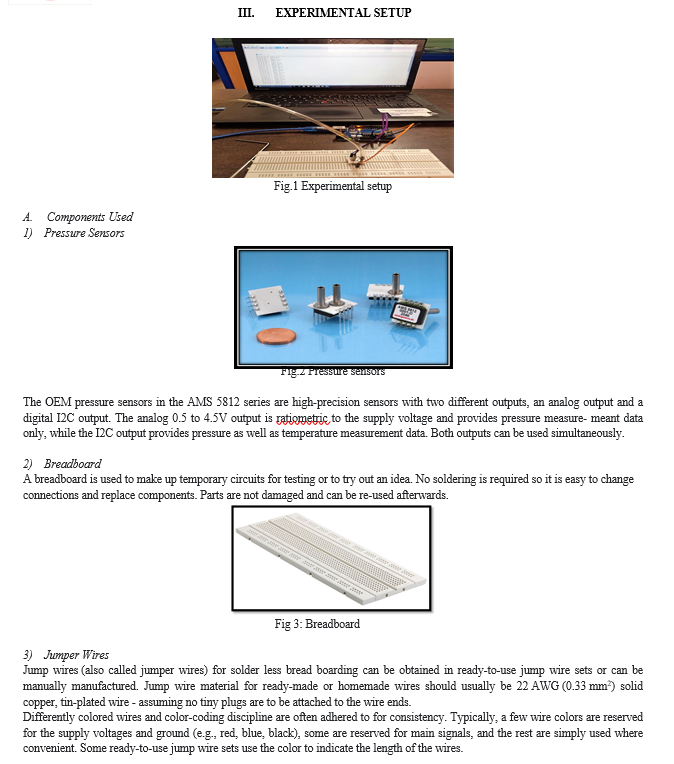
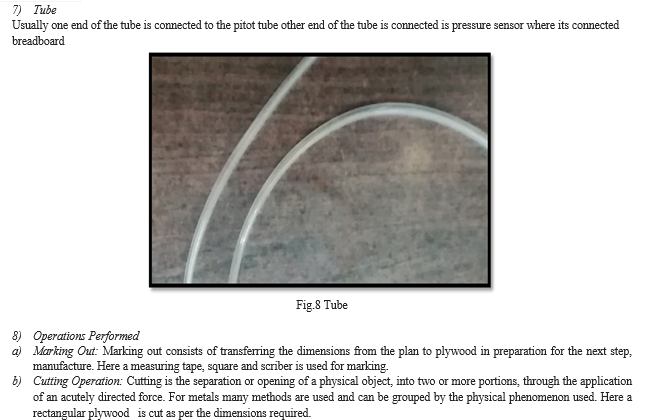
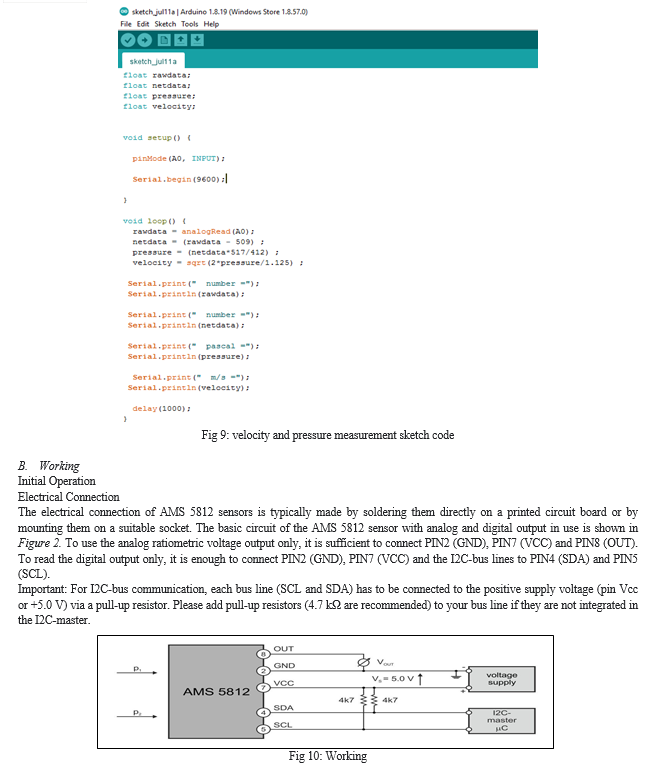
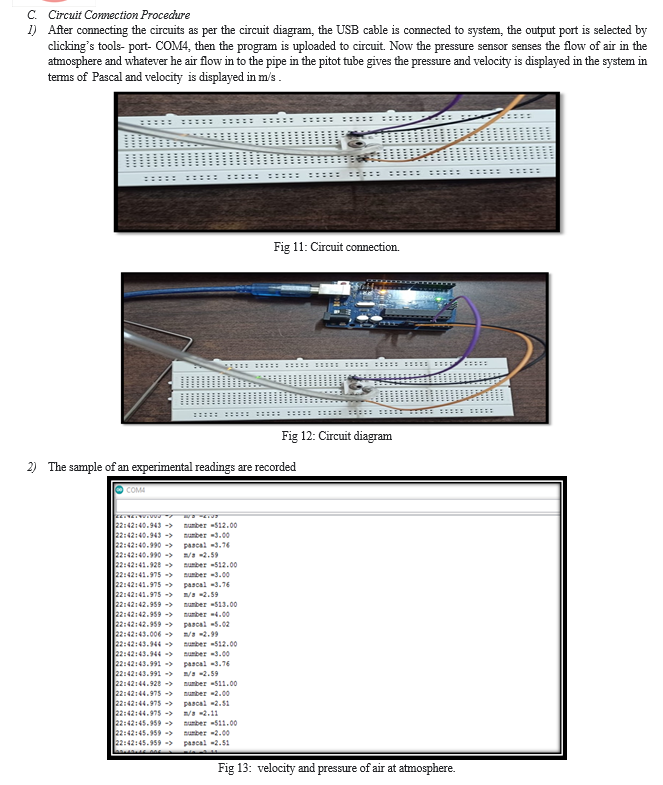
The Arduino board and pressure sensor is connected through the jump wires and breadboard as shown in the circuit diagram below. It is given to the system consisting of suitable program through the USB cable.
Pressure sensor is connected or pinned into the breadboard, then by using jumper wires one is connected to the ground. Then input value is given to 5v in the arduino uno, output pin in the bread boad is connected to the Ao pin .USB cable one end is conned to the arduino uno other end is connected to the system.
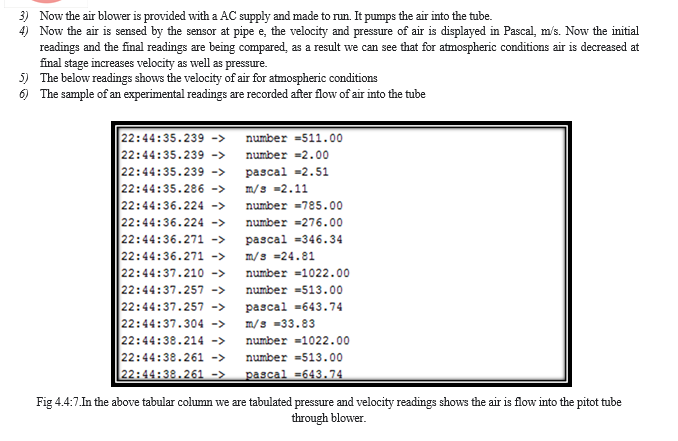
There are two ports in the pressure sensor, tube is connected exactly opposite to the dotted line indicated in the pressure sensor means first port by using air drier, air as a working fluid used in this project .the tube is connected to the pitot tube in order to measure the velocity of flow in the tube. Once program sketch is verified it showing compile is done then uplod next output will be displayed. Initially open atmospheric velocity of air is very low, once air flow enters into the tube using blower values gradually Increases as show in the fig, output will be displayed in the desktop
A. Software Description
The software which we use here is Arduino IDE. The main features we need to know about it are:
- Code area: This is where you will type all your code.
- Verify: This allows you to compile your code to code the Arduino understands. Any mistakes you have made in the syntax of your code will be shown in the info panel.
- Upload: This does the same as verify but will then send your code to your Arduino if the code is verified successfully.
- Info panel: This will show any errors during compiling or uploading code to your Arduino.
- Serial Monitor: This will open a window that allows you to send text to and from an Arduino.
D. Advantages
- Ease to handle in a simpler manner.
- Requires less maintenance.
- The technology doesn’t bring any unemployment issues as it only safeguards the employees either be the chemical industry or the physically challenged persons.
- Accuracy
- Durability
- Less space required for setup
- Good reliability
E. Disadvantages
- Very low frequency response
- Components are sensitive
F. Applications
- Stagnation pressure measurement
- Drag force measurement
- Velocity measurement
- Flow measurement
V. RESULTS AND DICUSSIONS
This report mainly focus on the velocity and pressure measurement of air, also we can draw the velocity profile. Here it is done by passing the air in to the Pitot tube equipment by using a blower. Containing sensor and arduino UNO setup using program. Through series of values we can observed velocity and pressure initially very low for atmospheric conditions, after when air flow in to the tube increases gradually sensor will sense displayed the output.
A. Future Scope
- We measure differential pressure.
- This set up can be implement in wind tunnel, Drag force & Air Drag.
- With the help of this setup we can implement and also draw velocity profile.
References
[1] Overview of Animatronics\". National TSA Conference Competitive Events Guide. IRJET 2011. [2] Ashraf Hamza1, Ahmed Khames2, Ali Lesewed3, M. Saad4 “Design an Optical Transducer for Pressure Measurement “IRJET Volume: 03 Issue: 03 | Mar-2016,M .L’; [3] Alan S. Morris, “Measurement and instrumentation principles,” 1 st ed., 2001 [4] Design an Optical Transducer for Pressure Measurement Ashraf Hamza1, Ahmed Khames2, Ali Lesewed3, M. Saad4- Volume: 03 Issue: 03 | Mar-2016 [5] https://www.sciencebuddies.org/science-fair-projects/references/how-to-use-a-breadboard) [6] https://www.javatpoint.com/arduino-uno:
Copyright
Copyright © 2023 Sharabanna ., Venkatesh . This is an open access article distributed under the Creative Commons Attribution License, which permits unrestricted use, distribution, and reproduction in any medium, provided the original work is properly cited.

Download Paper
Paper Id : IJRASET52078
Publish Date : 2023-05-12
ISSN : 2321-9653
Publisher Name : IJRASET
DOI Link : Click Here
 Submit Paper Online