

Ijraset Journal For Research in Applied Science and Engineering Technology
Comparative Analysis of Face Milling in Dry and Wet Condition of Al 8011 For Minimum Surface Roughness in Face Milling
Authors: Mr. Barigora Fabien , Mr. P. Vijayakumar, Mr. M Sudhahar
DOI Link: https://doi.org/10.22214/ijraset.2022.44667
Certificate: View Certificate
Abstract
The quality of machined components is evaluated in respect of how closely they adhere to set product finish, and reflective properties. Dimensional accuracy, tool wear and quality of surface finish are three factors that manufacturers must be able to control at the machining operations to ensure better performance and service life of engineering component. Aluminum alloys are extensively used as a main engineering material in various industries such as automotive industries, the mould and the die components manufacture and the industry in which weight is the most important factor. The purpose of this research is to investigate the effect of the main factors of the surface roughness and flatness in aluminum 8011 face milling with dry and wet condition. This experimental investigation to be conducted by using VMC controlled milling machine with 30mm face milling cutter with carbide multiple inserts. The same parameters were executed during the operation only difference minimum quantity lubricant for one set of operation and another set of operation without lubricant. The experimental results were evaluated using Taguchi technique minimum surface finish obtained at medium speed and maximum feed and depth of cut 0.222 µm in the dry condition during the face milling operation. The minimum flatness was obtained 0.012 mm at wet condition. minimum surface finish obtained through dry condition. Optimal control factor and ANNOVA calculations were found for face milling operation of AA8011.
Introduction
I. INTRODUCTION
In modern industry the goal is to manufacture low-cost, high-quality products in short time. Automated and flexible manufacturing systems are employed for that purpose along with CNC machines that are capable of achieving high accuracy and very low processing time. Face millings the second most common method (after turning) for metal cutting and especially for the finishing of machined parts. According to theoretical models the cutting force depends on the area of the chip (feed and depth of cut), the tool path (width of cut), the material and cutting tool properties and some experimentally determined constants. Restrictions concerning the available power, chip fraction mechanism and the dynamic characteristics of the workpiece – cutting tool – machine system, have an impact on cutting conditions, which is reflected on surface roughness, surface texture and dimensional deviations of the product. Surface roughness is a measure of the technological quality of a product and a factor that greatly influences manufacturing cost. It describes the geometry of the machined surface and combined with the surface texture, which is process dependent, can play an important role on the operational characteristics of the part (e.g. appearance of excessive friction and/or wear). The achievement of a desirable value is a repetitive and empirical process that can be very time consuming. The part must be machined more than once until an acceptable value is obtained.
A. Milling
Milling is the process of removing metal by feeding the work past a rotating multipoint cutter. In milling operation, the rate of metal removal is rapid as the cutter rotates at a high speed and has many cutting edges. Thus, the jobs are machined at a faster rate than with single point tools and the surface finish is also better due to multipoint cutting edges. The action of the milling cutter is vastly different from that of a drill or lathe tool. In milling operation, the cutting edge of the cutter is kept continuously in contact with the material being cut. The cuts pick gradually. The cycle of operation to remove the chip produced by each tooth is first a sliding action at the beginning, the cutter meets the metal and then crushing action takes place just after it is leading finally to the cutting actions. The versatility and accuracy of the milling process causes it to be widely used in modern manufacturing.
B. CNC Machining
The optimization of various processing parameters of a CNC milling machine effectively determines some critical process control factors/parameters or combinations of such parameters who will establish a close relation with the desired output of a machine. By considering all above, in this project, a new & basic approach is taken to study & analyze the relative significance of factors/parameters & their special combinations using suitable standard Experimental Design Methodology Method and Suitable analysis software. After determining the relative significance; it can be simple to understand the factors/parameters or their special combinations to be changed to increase process efficiency & output characteristics of CNC milling machine. The selection of optimal cutting parameters is a very important issue for each machining machine in order to enhance process efficiency & output characteristics of CNC milling machine which further leads towards an influence on surface quality of machining products. Thus, to improve the process efficiency & output characteristics of CNC milling machine it is very important & necessary to optimize the various processing parameters of CNC milling machine.
C. Experimental Plan
The proposed work approach and methodology has been elaborately shown in the flow chart.
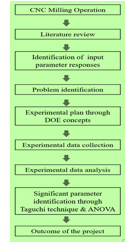
II. CNC MILLING OVERVIEW & INPUT PARAMETERR
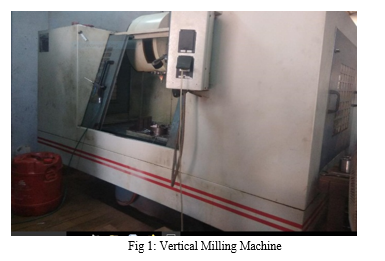
A. Vertical Millimg Machine
Computer Numerical Control (CNC) Milling is the most common form of CNC. CNC mills can perform the functions of drilling and often turning. CNC Mills are classified according to the number of axes that they possess. Axes are labeled as x and y for horizontal movement, and z for vertical movement, as shown in this view of a manual mill table. A standard manual light-duty mill (such as a Bridgeport™) is typically assumed to have four axes: Table x.
- Table y.
- Table z.
- Milling Head z.
The number of axes of a milling machine is a common subject of casual "shop talk" and is often interpreted in varying ways. We present here what we have seen typically presented by manufacturers. A five-axis CNC milling machine has an extra axis in the form of a horizontal pivot for the milling head, as shown below.
This allows extra flexibility for machining with the end mill at an angle with respect to the table. A six-axis CNC milling machine would have another horizontal pivot for the milling head, this time perpendicular to the fifth axis. CNC milling machines are traditionally programmed using a set of commands known as G-codes. G-codes represent specific CNC functions in alphanumeric format.
B. Experimental Setup
The experiments were conducted based on L 9 orthogonal array with respect to full factorial design. The three factors and each three levels with two replicates were considered based on machine tool specifications and tool manufacturer recommendations.
- Machine Specifications: The experiments were conducted based on L9 orthogonal array with Taguchi design. BATLIBOI CHETAK-75MC model was used to perform the coated and uncoated end milling operation. The Specification of Milling machine is Table size is 950x520mm, X-Axis Traverse is 762mm, Y-Axis Traverse is 510 mm, z Axis traverse is 510mm.
III. MACHINING PARAMETER
A. Taguchi Approach
Basically, experimental design methods were developed original fisher. However experimental design methods are too complex and not easy to use. Furthermore, many experiments must be carried out when the number of the process parameters increases, to solve this problem, the Taguchi method uses a special design of orthogonal arrays to study the entire parameter space with a small number of experiments only. The experimental results are then transformed into a signal – to – noise (S/N) ratio to measure the quality characteristics deviating from the desired values. Usually, there are three categories of quality characteristics in the analysis of the S/N ratio, i.e., the – lower – better, the – higher – better, and the – nominal – better. The S/N ratio for each level of process parameter is compared based on the S/N analysis. Regardless of the category of the quality characteristic, a greater S/N ratio corresponds to better quality characteristics. Therefore, the optimal level of the process parameters is the level with the greatest S/N ratio Furthermore, a statistically significant with the S/N and ANOVA analyses, the optimal combination of the process parameters can be predicted. Finally, a confirmation experiment is conducted to verify the optimal process parameters obtained from the parameter design.
B. Design Of Experiment
TABLE I: PROCESS PARAMETERS AND THEIR LEVELS
|
LEVELS |
PROCESS PARAMETERS |
||
|
SPEED RPM |
FEED m/min |
DOC mm |
|
|
1 |
1250 |
150 |
0.2 |
|
2 |
1500 |
175 |
0.3 |
C. An Orthogonal Array L9 Formation- (Dry & Wet)
TABLE II: L9 ARRAY FORMATION
|
TRIAL |
DESIGNATION |
SPEED RPM |
FEED mm/min |
DOC mm |
|
1 |
A1B1C1 |
1250 |
150 |
0.2 |
|
2 |
A1B2C2 |
1250 |
175 |
0.3 |
|
3 |
A1B3C3 |
1250 |
200 |
0.4 |
|
4 |
A2B1C2 |
1500 |
150 |
0.3 |
|
5 |
A2B2C3 |
1500 |
175 |
0.4 |
|
6 |
A2B3C1 |
1500 |
200 |
0.2 |
|
7 |
A3B1C3 |
1750 |
150 |
0.4 |
|
8 |
A3B2C1 |
1750 |
175 |
0.2 |
|
9 |
A3B3C2 |
1750 |
200 |
0.3 |
D. Experimental Data - (Dry & Wet)
TABLE III: INPUT PARAMETERS AND OUTPUT RESPONSES
|
SL.NO |
SPEED RPM |
FEED mm/min |
DOC mm |
MT min |
RA-WET µm |
RA-DRY µm |
FLATNESS-ERROR-WET-mm |
FLATNESS-ERROR-DRY-mm |
|
1 |
1250 |
150 |
0.2 |
0.97 |
0.790 |
0.415 |
0.012 |
0.077 |
|
2 |
1250 |
175 |
0.3 |
0.89 |
0.667 |
0.514 |
0.058 |
0.033 |
|
3 |
1250 |
200 |
0.4 |
0.83 |
0.358 |
0.417 |
0.099 |
0.141 |
|
4 |
1500 |
150 |
0.3 |
1.00 |
0.719 |
0.310 |
0.180 |
0.171 |
|
5 |
1500 |
175 |
0.4 |
0.92 |
0.380 |
0.351 |
0.115 |
0.147 |
|
6 |
1500 |
200 |
0.2 |
0.88 |
0.780 |
0.222 |
0.051 |
0.073 |
|
7 |
1750 |
150 |
0.4 |
1.02 |
0.759 |
0.235 |
0.056 |
0.043 |
|
8 |
1750 |
175 |
0.2 |
0.94 |
0.689 |
0.391 |
0.081 |
0.039 |
|
9 |
1750 |
200 |
0.3 |
0.88 |
0.531 |
0.351 |
0.148 |
0.031 |
E. Machining Time (Analysis of Result)- (Dry & Wet)
TABLE IV SN RATIO VALUE OF MACHINING TIMING
|
SL.NO |
SPEED |
FEED |
DOC |
MT min |
SN-RATIO |
|
1 |
1250 |
150 |
0.2 |
0.97 |
0.26457 |
|
2 |
1250 |
175 |
0.3 |
0.89 |
1.01220 |
|
3 |
1250 |
200 |
0.4 |
0.83 |
1.61844 |
|
4 |
1500 |
150 |
0.3 |
1.00 |
0.00000 |
|
5 |
1500 |
175 |
0.4 |
0.92 |
0.72424 |
|
6 |
1500 |
200 |
0.2 |
0.88 |
1.11035 |
|
7 |
1750 |
150 |
0.4 |
0.62 |
4.15217 |
|
8 |
1750 |
175 |
0.2 |
0.94 |
0.53744 |
|
9 |
1750 |
200 |
0.3 |
0.88 |
1.11035 |
TABLE V ANALYSIS OF VARIANCE FOR MT, USING ADJUSTED SS FOR TESTS
|
SOURCE |
DF |
SEQ SS |
ADJ SS |
F |
P |
% CONTRIBUTION |
|
SPEED |
2 |
0.022689 |
0.011344 |
0.71 |
0.586 |
23 |
|
FEED |
2 |
0.005689 |
0.002844 |
0.18 |
0.849 |
6 |
|
DOC |
2 |
0.037422 |
0.018711 |
1.17 |
0.462 |
38 |
|
Error |
2 |
0.032089 |
0.016044 |
|
|
33 |
|
Total |
8 |
0.097889 |
|
|
|
100 |
F. Surface Roughnesses (Analysis Of Result)
TABLE: VI SN RATIOS VALUES IN SURFACES ROUGHNESS
|
TRIAL |
SPEED |
FEED |
DOC |
Ra |
SNRA1 |
|
1 |
1250 |
150 |
0.2 |
0.415 |
7.6390 |
|
2 |
1250 |
175 |
0.3 |
0.514 |
5.7807 |
|
3 |
1250 |
200 |
0.4 |
0.417 |
7.5973 |
|
4 |
1500 |
150 |
0.3 |
0.310 |
10.1728 |
|
5 |
1500 |
175 |
0.4 |
0.351 |
9.0939 |
|
6 |
1500 |
200 |
0.2 |
0.222 |
13.0729 |
|
7 |
1750 |
150 |
0.4 |
0.235 |
12.5786 |
|
8 |
1750 |
175 |
0.2 |
0.391 |
8.1565 |
|
9 |
1750 |
200 |
0.3 |
0.351 |
9.0939 |
G. Surface Roughness Response For Each Level Of The Process Parameter
TABLE: VII ANALYSIS OF VARIANCE FOR RA, USING ADJUSTED SS FOR TESTS-DRY CONDITION
|
SOURCE |
DF |
SEQ SS |
ADJ SS |
F |
P |
% OF CONTRIBUTION |
|
SPEED |
2 |
0.039930 |
0.019965 |
8.37 |
0.107 |
59 |
|
FEED |
2 |
0.017697 |
0.008848 |
3.71 |
0.212 |
26 |
|
DOC |
2 |
0.005758 |
0.002879 |
1.21 |
0.453 |
8 |
|
Error |
2 |
0.004770 |
0.002385 |
|
|
7 |
|
Total |
8 |
0.068154 |
|
|
|
100 |
H. Surface Roughness And S/N Ratios Values For The Experiments-Wet
TABLE: VIII SN RATIOS VALUES IN SURFACES ROUGHNESS
|
TRIAL |
SPEED |
FEED |
DOC |
Ra |
SNRA1 |
|
1 |
1250 |
150 |
0.2 |
0.790 |
2.04746 |
|
2 |
1250 |
175 |
0.3 |
0.667 |
3.51748 |
|
3 |
1250 |
200 |
0.4 |
0.358 |
8.92234 |
|
4 |
1500 |
150 |
0.3 |
0.719 |
2.86542 |
|
5 |
1500 |
175 |
0.4 |
0.380 |
8.40433 |
|
6 |
1500 |
200 |
0.2 |
0.780 |
2.15811 |
|
7 |
1750 |
150 |
0.4 |
0.759 |
2.39516 |
|
8 |
1750 |
175 |
0.2 |
0.689 |
3.23562 |
|
9 |
1750 |
200 |
0.3 |
0.531 |
5.49811 |
TABLE: IX ANALYSIS OF VARIANCE FOR RA, USING ADJUSTED SS FOR TESTS-WET CONDITION
|
SOURCE |
DF |
SEQ SS |
ADJ SS |
F |
P |
% OF CONTRIBUTION |
|
SPEED |
2 |
0.004814 |
0.002407 |
0.09 |
0.913 |
3 |
|
FEED |
2 |
0.072558 |
0.036279 |
1.43 |
0.412 |
32 |
|
DOC |
2 |
0.098431 |
0.049215 |
1.94 |
0.340 |
43 |
|
Error |
2 |
0.050739 |
0.025369 |
|
|
22 |
|
Total |
8 |
0.226542 |
|
|
|
100 |
IV. FLATNESS MEASURING SYSTEM
A. Overview of CMM
The typical 3 "bridge" CMM is composed of three axes, an X, Y and Z. These axes are orthogonal to each other in a typical three-dimensional coordinate system. Each axis has a scale system that indicates the location of that axis. The machine will read the input from the touch probe, as directed by the operator or programmer. The machine then uses the X, Y, Z coordinates of each of these points to determine size and position with micrometer precision typically. A coordinate measuring machine (CMM) is also a device used in manufacturing and assembly processes to test a part or assembly against the design intent. By precisely recording the X, Y, and Z coordinates of the target, points are generated which can then be analyzed via regression algorithms for the construction of features.
A. Flatness Error (Analysis Of Result)
- Flatness and S/N Ratios Values For The Experiments-Dry
TABLE: X SN RATIOS VALUES FOR FLATNESS
|
TRIAL |
SPEED |
FEED |
DOC |
FLATNESS |
SNRA1 |
|
1 |
1250 |
150 |
0.2 |
0.077 |
22.2702 |
|
2 |
1250 |
175 |
0.3 |
0.033 |
29.6297 |
|
3 |
1250 |
200 |
0.4 |
0.141 |
17.0156 |
|
4 |
1500 |
150 |
0.3 |
0.171 |
15.3401 |
|
5 |
1500 |
175 |
0.4 |
0.147 |
16.6537 |
|
6 |
1500 |
200 |
0.2 |
0.073 |
22.7335 |
|
7 |
1750 |
150 |
0.4 |
0.043 |
27.3306 |
|
8 |
1750 |
175 |
0.2 |
0.039 |
28.1787 |
|
9 |
1750 |
200 |
0.3 |
0.031 |
30.1728 |
2. Flatness Response For Each Level Of The Process Parameter
TABLE: XI ANALYSIS OF VARIANCE
|
SOURCE |
DF |
SEQ SS |
ADJ SS |
F |
P |
% OF CONTRIBUTION |
|
SPEED |
2 |
0.012881 |
0.006440 |
1.89 |
0.346 |
54 |
|
FEED |
2 |
0.000886 |
0.000443 |
0.13 |
0.885 |
4 |
|
DOC |
2 |
0.003500 |
0.001750 |
0.51 |
0.660 |
14 |
|
Error |
2 |
0.006806 |
0.003403 |
|
|
28 |
|
Total |
8 |
0.024073 |
|
|
|
100 |
3. Flatness And S/N Ratios Values For The Experiments-Wet
TABLE: XII SN RATIOS VALUES FOR FLATNESS
|
TRIAL |
SPEED |
FEED |
DOC |
FLATNESS |
SNRA1 |
|
1 |
1250 |
150 |
0.2 |
0.012 |
38.4164 |
|
2 |
1250 |
175 |
0.3 |
0.058 |
24.7314 |
|
3 |
1250 |
200 |
0.4 |
0.099 |
20.0873 |
|
4 |
1500 |
150 |
0.3 |
0.180 |
14.8945 |
|
5 |
1500 |
175 |
0.4 |
0.115 |
18.7860 |
|
6 |
1500 |
200 |
0.2 |
0.051 |
25.8486 |
|
7 |
1750 |
150 |
0.4 |
0.056 |
25.0362 |
|
8 |
1750 |
175 |
0.2 |
0.081 |
21.8303 |
|
9 |
1750 |
200 |
0.3 |
0.148 |
16.5948 |
4. Flatness Response For Each Level Of The Process Parameter
TABLE: XIII ANALYSIS OF VARIANCE
|
SOURCE |
DF |
SEQ SS |
ADJ SS |
F |
P |
% OF CONTRIBUTION |
|
SPEED |
2 |
0.005390 |
0.002695 |
0.85 |
0.542 |
24 |
|
FEED |
2 |
0.000497 |
0.000248 |
0.08 |
0.928 |
3 |
|
DOC |
2 |
0.009766 |
0.004883 |
1.53 |
0.395 |
44 |
|
Error |
2 |
0.006372 |
0.003186 |
|
|
29 |
|
Total |
8 |
0.022025 |
|
|
|
100 |
Conclusion
A. Conclusion In this study, the Taguchi technique and ANOVA were used to obtain optimal milling parameters of AA8011 under wet and dry conditions. The experimental results were evaluated using ANOVA. The following conclusion can be drawn. In this study, the Taguchi technique and ANOVA were used to obtain optimal parameters in the Milling of aluminium under wet and dry conditions. The experimental results were evaluated using Taguchi technique minimum surface finish obtained at medium speed and maximum feed and depth of cut 0.222 µm in the dry condition during the face milling operation. The minimum flatness was obtained 0.012 mm at wet condition. Below Taguchi design result and annova ere illustrated. B. Result Optimal Control Factor 1) Surface Roughness (Dry) -A1 (Speed-1250) B2 (Feed-175mm/min) C3 (DOC-0.6 mm) 2) Surface Roughness (Wet) -A3 (Speed-1750) B2 (Feed-175mm/min) C1 (DOC-0.2 mm) 3) Machining Timing (Wet & Dry)- A2 (Speed-1500) B3 (Feed-200 mm/min) C1 (DOC-0.2 mm) 4) Flatness (Dry) - A1 (Speed-1250) B3 (Feed-200 mm/min) C2 (DOC-0.4 mm) 5) Flatness (Wet)- A2 (Speed-1500) B3 (Feed-200 mm/min) C1 (DOC-0.2 mm) C. Percentage Of Contribution Of Process Parameter 1) Surface Roughness (Dry) - Speed 59% 2) Surface Roughness (Wet) - DOC 43% 3) Machining Timing- DOC 38% 4) Flatness Error- (Dry) - Speed 54% 5) Flatness Error- (Wet) - DOC 44%
References
[1] Dhanalakshmi S Comparative study of parametric influence on wet and dry machining of LM 25 aluminium alloy 2016. [2] J. Kouam V Dry, Semi-Dry and Wet Machining of 6061-T6 Aluminium Alloy Dry, Semi-Dry and Wet Machining of 6061-T6 Aluminium Alloy 2017. [3] N.D. Bankar International Research Journal of Engineering and Technology Volume: 06 Issue: 10 | 2019 [4] Sajid Raza Zaidia Effect of Machining Parameters on Surface Roughness During Milling Operation Roughness During Milling Operation Advances in Manufacturing Technology. © 2021 The authors and IOS Press. [5] Suresh Kumar S Prabhu Optimization of CNC End Milling Process Parameters of Low-Carbon Mold Steel Using Response Surface Methodology and Grey Relational Analysis Hindawi Advances in Materials Science and Engineering Volume 2021, Article ID 4005728. [6] R. Suresh Kumar Green Machining Characteristics Study of Al-6063 in CNC Milling Using Taguchi Method and Grey Relational Analysis Hindawi Advances in Materials Science and Engineering Volume 2021, Article ID 4420250. [7] Harshal Ratnakar Ghan, Dr. Prof. Netra Pal Singh Optimization of Milling Parameters of Aluminium Alloy 7075 for Face Milling Using Finite Element Method Asian Journal of Convergence in Technology 2019, ISSN NO: 2350-1146 I.F-5.11 [8] Dirk Biermann Institute of Machining Technology, Technische Universität Dortmund, Baroper Str. 301, 44227 Dortmund, Germany Improvement of workpiece quality in face milling of aluminum alloys 2019. Journal of Materials Processing Technology.
Copyright
Copyright © 2022 Mr. Barigora Fabien , Mr. P. Vijayakumar, Mr. M Sudhahar. This is an open access article distributed under the Creative Commons Attribution License, which permits unrestricted use, distribution, and reproduction in any medium, provided the original work is properly cited.

Download Paper
Paper Id : IJRASET44667
Publish Date : 2022-06-21
ISSN : 2321-9653
Publisher Name : IJRASET
DOI Link : Click Here
 Submit Paper Online