

Ijraset Journal For Research in Applied Science and Engineering Technology
Correlation of Mechanization and Business Technical Aspect of Rice Production: Basis for Business Development Plan
Authors: Dr. Fhrizz S. De Jesus, Engr. Marlon Leyesa
DOI Link: https://doi.org/10.22214/ijraset.2023.55084
Certificate: View Certificate
Abstract
This study examines the relationship between the mechanization and the business technical aspects of rice production in Nueva Ecija. The descriptive research method was used in this study to determine the relationship between the mechanical level and the business technical aspect of rice production. This study discovered that farmers only used a tractor for land preparation, and the results revealed that not all farmers use modern machinery for crop care and maintenance, such as an electric sprayer and a grass cutter for clearing the land. In terms of harvesting, the farmers used a harvester to harvest their crop but did not transport the cavans by using truck and the significant relationship between mechanization level and business technical aspects in terms of land preparation, calculated r-value of (0.75) and interpreted as High positive correlation, but the resulting p-value (0.333814) is greater than the critical value of 0.05, revealing that there is no significant relationship between mechanization and business technical aspects. It is due to the farmers\' lack of mechanized equipment. As a result of the findings, the researchers advise farmers to use mechanized equipment in order to perform well and increase rice production.
Introduction
I. INTRODUCTION
Agricultural land is being converted to non-agricultural uses due to rising demand for industrialization, urbanization, housing, and infrastructure. A small number of authors have investigated the level of farm mechanization in relation to the intensity of power or energy availability and its effects on boosting agricultural and labor productivity (Singh et al., 2007). According to Mehta (2014), citing Giles (1975), he examined the availability of power in various nations and showed that productivity was positively correlated with potential unit farm power.
The Philippines remains one of the world's top rice producers, ranking eighth behind China, Indonesia, India, and other Southeast Asian countries. Rice research is ongoing at various institutes and universities across the country to improve rice production and assist Filipino farmers in improving crop durability and yield, according to DA Communications Group (2022).
Nueva Ecija is known as the Philippines' "Rice Granary" because it led the production of the country's staple food during the twentieth century. The province was not always devoted to rice production and was, in fact, considered a frontier area for much of its history.
According to Horrigan (2002), traditional farming has been proven to produce higher yields since ancient times. Organic farming is required at this time to provide sustainable production and a healthy lifestyle. The goal of sustainable agriculture is to eliminate environmental hazards. It prioritizes long-term interests such as maintaining topsoil, biodiversity, and rural communities over profit, which is only a short-term interest.
Less-developed countries have limited space to implement agricultural technology. They prefer manual labor because few of them can afford to rent or buy machinery, according to Loremer (1999). Farmers who practice traditional farming, on the other hand, have great instinct ability because it is so complex that they can predict favorable harvests, weather conditions, crop behavior, soil conditions, and other factors.
The new method of farming, called mechanization, was introduced to our farmers today as a result of technological advancements to make their work easier and faster. It helps them in their work on the field. Agricultural mechanization technology transfer has been a slow process. In 1990, the level of mechanization in the Philippines was around 0.52 hp/ha in terms of available mechanical power in the farm (RNAM, 1994).
This level of agricultural mechanization is relatively low, and this low level of mechanization was one of the primary reasons that rice production did not achieve maximum yield, according to the Committee Affairs Department (2009). However, according to Rodulfo & Amongo (1994), the level of agricultural mechanization in 1994 was 1.69 hp/ha. Recently, the latest survey by the Philippine Center for Postharvest Development and Mechanization (PhilMech) revealed that the mechanization level of farms in the Philippines ranges from 1 to 1.23 hp/ha, with rice having the highest level of available farm power at 1.6 to 2.31 hp/ha.
Bello (2012) defines three agricultural mechanization indicators: level of mechanization, mechanization index, and degree of mechanization. The mechanization of Philippine farms is increasing as more farmers express a willingness to mechanize their operations. Furthermore, according to the most recent survey conducted by the Philippine Center for Postharvest Development and Mechanization (PhilMech), the mechanization level of farms in the Philippines is 1.23 horsepower per hectare (hp/ha).
According to the researchers, many farmers do not rely entirely on machinery when working in the field due to their inability to purchase machinery equipment and a lack of knowledge on how to use it. Farmers used agricultural mechanization extensively to speed up land preparation, pest control, harvesting, and rice processing. However, manual labor is still used in rice production in some areas. In comparison to agricultural land area, the number of agricultural machines is still relatively small. This is primarily due to farmers' inability to purchase agricultural machinery and their lack of knowledge about how to operate agricultural machinery. Currently, the country's level of mechanization ranges from low to high, primarily in rice cultivation, ranging from 10% to 90% depending on the intensity of the farming system, with a common figure indicating an average level of 30%, according to Handaka (2005).
In this regard, it is difficult to improve production if the farmer does not upgrade to mechanization in their field. Farmers must comprehend and adapt to modernization. Because they cannot survive technological advancement if they do not allow farm mechanization.
Specifically, this study assessed the Mechanization Level of Rice Production. Specifically, it answered the following questions:
- How may the business technical operation of respondents be assessed in terms of :
a. Land Area ;
b. Years in Farming;
c. Type of agricultural equipment; and
d. Source of water ?
2. How may the mechanization technology utilized in operation of field be assessed in terms of :
a. Land Preparation ;
b. Crop care and Maintenance; and
c. Harvesting ?
3. Is there any significant relationship between mechanization and business technical operation of rice production?
4. What development plan may be proposed based on the results of the study?
A. Mechanization Level
The mechanization level/degree is one of the quantitative indices used to assess the mechanization degree of various operations within a given limit. In general, there are three distinct indices for studying and evaluating mechanization in various regions. These indices include mechanization degree, level, and capacity. The level of mechanization is the total percentage of mechanized field operations and the power of machines used per unit of field operation (hp /ha) according to Soni & Ou, (2012). According to Almasi et al. (2000), the conversion coefficient is 0.75. The term mechanization degree refers to the percentage of operations that use mechanization.
Some South Asian countries, such as China and India, have made significant progress toward farm mechanization. Southeast Asian countries such as Bangladesh, Cambodia, Thailand, and Vietnam are using limited advanced machinery in farm and post-harvest operations. In the rest of the world, agricultural mechanization is still in its early stages. Farmers in these countries continue to use inefficient manual tools, resulting in low output. For example, in Nepal, the land size is small, preventing farmers from using large machinery. Farmers have had no choice but to continue using traditional farming techniques due to a lack of appropriate machinery to conduct various farming operations, according to Soni & Ou (2012).
The RCEF Mechanization Program allocates PhP 5 billion per year for agricultural mechanization in order to increase farmers' productivity, profitability, and global competitiveness. The expected benefits of using agricultural machinery are (a) lowering the cost of rice production by PhP 2 - 3 per kg by using an accurate, effective, and complete set of machines, and (b) lowering postharvest losses by 3 - 5% by using appropriate and efficient postharvest machinery. One of the program's highlights is empowering FCAs through training and extension services, as well as enhancing their entrepreneurial capacity to operate and manage farm machinery, postharvest, and processing facilities in a viable and sustainable manner according to PHilMech (2021).
B. Stage of Mechanization Level
According to Rodulfo et al. (1998), mechanization is classified into three levels: low, fair, and high. Low mechanization level - A low mechanization level indicates that manual power utilization exceeds 33%. Fair mechanization level - Whereas a fair level indicates that animal power utilization ranges from 34% to 66%. High mechanization level - Mechanical power utilization ranges from 67% to 100%.
C. Rice Production
Based on the standing crop as of February 2022, the updated rice production for the period of January to March 2022 may increase by 0.2 percent to 4.64 million metric tons, up from 4.63 million metric tons in the same period of 2021. As of February 2022, the updated estimate of rice production for the period January to March 2022 is 0.4 percent higher than the previous estimate of 4.62 million metric tons, according to the Philippine Statistic Authority (PSA), rice Production Survey (PPS), Monthly Palay and Corn Situational Reporting System (MPCSRS).
According to McLennan (1955, p. 375), Nueva Ecija is known as the Philippines' "Rice Granary" because it led the production of the country's staple food during the twentieth century. The province was not always devoted to rice production, and it was considered a frontier area for much of its history. It wasn't until the mid-nineteenth century, when its vast alluvial plains drew immigrants from the Ilocos and Tagalog regions, that the woodlands that became rice fields were cleared. This was only the beginning, as the province saw the emergence of landed estates devoted to planting the nation's staple crop in the decades that followed. The current study is a survey of Nueva Ecija's rise as the leading rice producing province. The goal is to provide a general description of the province in the early twentieth century, tell the story of its rise to become the primary producer of rice in the Philippines, describe the rise of landholdings there, identify the major landowners, and discuss other aspects of the rice industry that affected the province.
II. MATERIALS AND METHOD
A. Research Method
This study used a quantitative research, quantitative research is the collection and analysis of numerical data to test hypotheses and answer research questions. This type of research typically employs a large sample size and employs statistical analysis to draw conclusions about a population based on the data collected. To collect quantitative data, it is common to use surveys, experiments, or other structured data collection methods according to Hassan (2022).
In this study, the researchers used the descriptive-correlational research method to determine the relationship between mechanical and business technical aspect of rice production. The impact was determined by frequencies, percentages, weighted mean, or other statistical analysis in this design. The descriptive research method is concerned with describing the characteristics of a demographic segment. It describes the population or phenomenon under research.
B. Research Locale
This study was carried out in the province of Nueva Ecija. Since it is the "Rice Granary of the Philippines". The researchers determined that the province has a large number of rice farmers, making it an ideal location for the study.
Due to the settlement and farming of thousands of hectares of land in Nueva Ecija, rice production eventually increased dramatically. By the end of the first decade, rice farming had reportedly taken over as the province's primary industry, and the harvest had steadily increased from 1,600,000 cavans in 1909 to 1,900,000 cavans in 1910, and 2,153,718 cavans in 1911. The province was the Islands' third-largest producer of rice by 1911. The crop was thought to be the biggest in Nueva Ecija's history up to that point the following year as the harvest increased even more. According to Santiago (2015) cited from Hill (1925), as Pangasinan's population grew quickly and there was little new land available for rice farming, the interprovincial export of the island continued to fall in the years that followed.
On the other hand, Nueva Ecija continued to have large tracts of land to cultivate and was able to sell more to Manila and other provinces because it consumed less than it produced. The Philippines' top rice-producing province was Nueva Ecija by 1920. According to Santiago (2015) cited from Camus (1921), Nueva Ecija still had fewer cultivated areas than Pangasinan that year but had higher production, an average production per hectare, and total value.
C. Respondents of the Study
This study's target respondents were rice farmers. The table below shows the distribution of respondents in the sample population.
Table 1 shows the distribution of the respondents in Nueva Ecija.
Table 1. Distribution of the Respondents
|
Respondents |
Population |
|
Rice Farmers |
|
|
59,125 |
382 |
Table 1 presents the total number of the respondents needed to participate in this study to analyze the mechanization and business technical operation in rice production of the respondents.
The survey respondents are 382 rice farmers from Nueva Ecija province. The number of formal respondents was listed on the Department of Agriculture's website.
D. Sample and Sampling
This study employed simple random sampling, as the researchers chose respondents randomly. A simple random sample, according to Thomas (2022), is a randomly selected subset of a population. This sampling method gives each member of the population an exact equal chance of being chosen, reducing the risk of selection bias.
The sample size was calculated using the RAOSOFT sample size calculator. RAOSOFT is statistical software that is used to calculate sample size. RAOSOFT considers four factors when determining sample size. The margin of error, confidence level, population, and response distribution are among these factors.
E. Research Instrument
A survey questionnaire was used to collect information of the respondents in this study. The researchers created questionnaires to determine the level of mechanization and business technical aspects in rice production. It aids researchers in gathering data for the study. A survey questionnaire. This is a structured questionnaire whose length and format can vary. All of the data is saved in a database, and the survey tool offers some level of data analysis in addition to review by a trained expert.
Part I of the questionnaire includes the business technical aspect. Subjects were instructed to rate the statements and answer the question. It was a self-made type of questions.
Part II of the assessment includes the used of mechanization. It was patterned and modified in the written works of CLSU International Journal of Science and Technology, entitled ""Assessment of Mechanization Level of Onion Production in Nueva Ecija," by Romeo Buan Gavino (2020), and was adapted from the part one survey template of the questionnaire about the mechanization level in rice production.
The research instrument was validated; corrections and suggestions were incorporated into the final draft; interviews were done with professionals were conducted to assess the instrument’s reliability and validity.
F. Data Gathering Procedures
After being approved of research topic entitled “Correlation of Mechanization and Business Technical Aspect of Rice Production: Basis for Business Development Plan”, the researchers begin in collecting related data and information from the Internet. The questionnaire was guided by the related studies and undergoes confirmation by the competent individual for validation the suggested opinions were included. The researchers inform the respondents about the significance of their participation in the study. The researchers clarify some terminology with the respondents so that they can answer the questionnaire fully aware of their responsibilities as the study's subject. The researchers acquire approvals from their subject instructor and adviser before distributing the questionnaires questionnaire and finally, the researchers are free to conduct a face-to-face survey.
The instrument's reliability coefficient, which is calculated and measured to ensure internal consistency. By providing the constructed research instrument for expert comments and rating, the validity of the research instrument is established. The reliability coefficient of the instrument was tested and measured with a score of .876, which means that the instrument has a good internal consistency. The validity of the research instrument was established by presenting the developed research instrument for expert comments, who rated the instrument with a weighted mean of 4.88 and a verbal interpretation of "very good." Before distributing the questionnaires, the researchers obtain permission from the research adviser, area chair and director, since the survey questionnaires are posted online on some social media platforms such as Facebook and printed questionnaire. The results of the questionnaire's dry run was tallied, and the questionnaire was revised. Following the distribution, the data acquired from the completed questionnaires were tallied for further analysis and finally, the researchers were free to conduct a survey.
G. Data Analysis Techniques
The information gathered in the area was encoded, tallied, and evaluated. The data was analyzed using statistical tools such as Percentage, Frequency Distribution, Weighted Mean and Pearson r. The data were interpreted using the scale below.
Table 2. Scales for Interpretation of the mechanization level of rice production
|
Scale |
Mean range |
Verbal interpretation |
Description |
|
4 |
3.26 – 4.00 |
Strongly Agree |
Highly in Favor |
|
3 |
2.51 – 3.25 |
Agree |
In Favor |
|
2 |
1.76 – 2.50 |
Disagree |
Slightly Not in Favor |
|
1 |
1.00 – 1.75 |
Strongly Disagree |
Highly Not in Favor |
Table 2 shows the scales that the researchers used to interpret the data. The researchers assessed the frequency of use of mechanization in their field preparation using a 4-point Likert scale. The researcher’s goal was to determine the level of mechanization in rice production.
Table 3. Scale used for Interpretation of Pearson r.
|
r- value (size of correlation) |
Interpretation |
|
0.90 to 1.00 or (-0.90 to -1.00) |
Very high positive (or negative) correlation |
|
0.70 to 0.89 or (-0.70 to -0.89) |
High positive (or negative) correlation |
|
0.50 to 0.69 or (-0.50 to -0.69) |
Moderate positive (or negative) correlation |
|
0.30 to 0.49 or (-0.30 to -0.49) |
Low positive (or negative) correlation |
|
0.10 to 0.29 or (-0.10 to -0.29) |
Very low positive (or negative) correlation |
|
0.01 to 0.09 or (-0.01 to -0.09) |
Weak positive (or negative) correlation |
|
0.00 |
No correlation |
Table 3 shows the scales used by the researcher in interpreting the Pearson r. The researcher’s goal was to determine the significant relationship of mechanization level on the business technical operation.
Aside from the said scale, the researcher used the following statistical tools to classify, tabulate, and analyse the data in accordance with the objectives of the research study:
- In determining the number of the respondents and the business technical aspect, the researcher used the frequency, and percentage.
- In the assessment of the mechanization level, the researcher employed weighted mean and ranking to determine the number of respondents who answered a specific description pertaining to the respondents.
- To identify the significant relationship between the mechanization level and business technical aspect, the researchers employed Pearson r.
III. RESULTS AND DISCUSSION
A. Assessing the Business Technical Aspect of the Respondents
- Assessment of Business Technical Aspect in terms of Land Area
Table 4 shows the assessment of business technical aspect of the respondents in terms of the Land Area.
Table 4. Land Area
|
Land area |
F |
% |
|
Below 1ha |
199 |
52 |
|
2-3ha |
149 |
39 |
|
4-5ha |
20 |
5 |
|
6ha and above |
14 |
4 |
|
Total |
382 |
100% |
The table above illustrates the business technical aspect in terms of Land Area. The majority of respondents have below 1 hectare got 199 response or 52%. Otherwise, the respondents that have 6 hectares and above with the lowest frequency of 14 or 4%. It demonstrates that there is a small area of agricultural land, particularly for farmers who get along with one another. The field that they have for the production of rice is very small, and this area is inherited, according to the respondents.
According to a report by the HLPE (2013), 73% of farms are smaller than 1 ha and 85% are smaller than 2 ha for a sample of 81 countries using data from the agricultural censuses conducted in 2000. It also looked at the distribution of farmland across 14 African nations, revealing that 80% of holdings are smaller than 2 ha and manage about 25% of the continent's total arable land. In addition, the study found that only 2.4% of the agricultural land in the European Union (EU) is used by farms, 50% of which are smaller than 2 ha in size.
2. Assessment of Business Technical Aspect in terms of Types of Agriculture Equipment
Table 5 shows the assessment of business technical aspect of the respondents in terms of the Type of Agriculture Equipment.
Table 5. Type of Agriculture Equipment
|
Type of Agriculture Equipment |
*F |
% |
|
Animal |
64 |
17 |
|
Tractor |
216 |
56 |
|
Four wheels tractor |
75 |
20 |
|
Harvester |
12 |
3 |
|
Plow |
10 |
3 |
|
Thresher machine |
5 |
1 |
|
Total |
382 |
100% |
In terms of the types of agricultural equipment used by the respondents, the aforementioned table reveals the business-technical aspect. Most of the respondents have a tractors got 216 responses or 56 %. However, the respondents who own a thresher machine got a lowest frequency of 5 or 1%. The result, demonstrates that the majority of respondents are much more likely to need a tractor than other equipment to assist them in farming. According to respondents, tractors are the most important type of equipment a farmer should own due to lower farming costs compared to using laborer’s and animals to prepare the land.
According to MAFF (2013), tractor and mechanical tiller plowing covered 64% of total cultivated area in the wet season and 91% in the dry season.
According to Firdaus & Hendri, (2015), in order to cultivate land, farmers are now primarily needed to use tractors. This is because labor-intensive farming methods are becoming more and more expensive, and farmers are finding it harder and harder to find workers as they transition to non-agricultural careers, which has led to higher labor costs in addition to soil preparation.
3. Assessment of Business Technical Aspect in terms of Years in Farming
Table 6 shows the assessment of business technical aspect of the respondents in terms of Years in Farming.
Table 6. Years in Farming
|
Years in Farming |
*F |
% |
|
3yrs and below |
54 |
14 |
|
4-7yrs |
114 |
30 |
|
8-11yrs |
143 |
37 |
|
12yrs and above |
71 |
19 |
|
Total |
382 |
100% |
As seen in the table above, it demonstrates the business technical aspect in terms of years in farming. The majority of the respondents are worked for 8 to 11 years in farming got 143 responses or 37%. On the other hand, the respondents that worked for 3 years and below of farming got a lowest frequency of 54 or 14%. The result stated, that the farmers have been engaged in agriculture for a considerable amount of time, which will work to their advantage as it will result in better crop production. According to the respondents, having a long history of farming gives them the advantage of performing their work and tasks more quickly. In addition, throughout time passes, more knowledge and more productive they became
According to Onyeneke et al. (2012), experience in the agriculture improves output performance. This result supports the findings of Nweke et al. (2004), who claimed that more experienced farmers would be more productive, have a better understanding of climatic conditions, better knowledge of the efficient allocation of resources, and a better understanding of market conditions, and are thus expected to run a more productive and profitable business. It also backs up the conclusions of Onubuogu et al. (2013), that prior agriculture management experience empowers farmers to set reasonable time and cost targets, allocate, and combine resources and effectively use resources, as well as recognize production limitations.
4. Assessment of Business Technical Aspect in terms of Water Source
Table 7 shows the assessment of business technical aspect in terms of Water Source.
Table 7. Source of Water
|
Source of Water |
F |
% |
|
Irrigation |
189 |
53 |
|
River |
64 |
18 |
|
Deep well |
59 |
16 |
|
Use of water pump |
46 |
13 |
|
Total |
382 |
100% |
The table above demonstrates the business technical aspect in terms of source of water. The majority of respondents that the source of water was through Irrigation got189 response or 53%. Otherwise, the respondents that use a water pump got a lowest frequency of 46 or 13%. It shows that farmers are more likely to rely on irrigation as a source of water for their crops since they cannot afford to establish a water pump. According to the respondents, using irrigation as a source of water for production is more beneficial for them and reduces their costs since irrigation is free.
According to United States (2015), reported that farming is the biggest consumer of both surface and ground water and irrigation accounted for 42% of the country's total freshwater used. The agricultural industry is now more productive and profitable due to irrigation. According to the 2017 Census of Agriculture, less than 20% of cropland was irrigated, while farms with some form of irrigation accounted for more than 54% of the value of all U.S. crop sales. In many rural areas of the U.S., irrigated crop production supports local economies and supports the livestock, food processing, transportation, and energy industries.
B. Assessing the Mechanization of Rice Production
- Assessing the Mechanization of Rice Production in terms of Land Preparation
Table 8 shows the mechanization of rice production in terms of the Land Preparation.
Table 8. Land Preparation
|
Land Preparation |
WM |
VI |
VD |
|
1. Using a grass cutter helps me for clearing and weeding grass |
3.03 |
Agree |
In Favor |
|
2. I plow the field with tractor. |
3.55 |
Strongly Agree |
Highly in Favor |
|
3. I use disc harrow for the first harrowing. |
3.31 |
Strongly Agree |
Highly in Favor |
|
4. For the second harrowing I used hand tractor. |
3.45 |
Strongly Agree |
Highly in Favor |
|
5. The use of harrow assists me in leveling the field. |
3.40 |
Strongly Agree |
Highly in Favor |
|
Total |
3.35 |
Strongly Agree |
Highly in Favor |
As seen in the table above, most of the respondents indicate that they plow the field with tractor, ranking first with a weighted mean of 3.55 and verbal interpreted as Strongly Agree. On the other hand, using a grass cutter for clearing and weeding grass received the lowest weighted mean of 3.03 and was interpreted as Agree. This indicates that respondents are more willing to use a tractor than a plow when preparing the land for their crop. According to respondents, the majority of them are using tractors to prepare the field, and since the soil is more fertile as a result of land cultivation, this will help them increase crop production.
According to ICE, (2010), agricultural machine and equipment production in Indonesia consists of units primarily engaged in assembling machinery for preparing and processing agricultural land, such as tractors and plough machines, as well as machines for the first processing of agricultural crops.
Increased yields and the ability to cultivate more land due to tractors enable farmers to increase agricultural production, which is consistent with research from Adu-Baffour et al. (2019) in Zambia. According to Baudron et al. (2019), finding that labor is "not as dominated by labor as commonly thought" at eight East African study sites. Despite the numerous effects reported in numerous nations, some are not. For instance, 73% of respondents in Benin mentioned the finding that using tractors resulted in a decrease in the use of bushfires for land clearing, which is said to be better for soil fertility.
2. Assessing the Mechanization of Rice Production in terms of Crop Care and Maintenance
Table 9 shows assessment of the mechanization of rice production in terms of the Crop Care and Maintenance.
Table 9. Crop Care and Maintenance
|
Crop Care and Maintenance |
WM |
VI |
VD |
|
1. Using a grass cutter helps me for cleaning and weeding grass |
3.13 |
Agree |
In Favor |
|
2. I use an electric sprayer to apply pesticide and insecticides. |
2.65 |
Agree |
In Favor |
|
3. I am applying fertilizer with the help of my neighbour |
3.33 |
Strongly Agree |
Highly in Favor |
|
4. I made a water pump to serve a source of water |
3.72 |
Strongly Agree |
Highly in Favor |
|
Total
|
3.21 |
Agree |
In Favor |
As shown in the table above, made a water pump to serve as source of water ranked first, with a weighted mean of 3.72 and verbal interpreted as Strongly Agree. But, use an electric sprayer to apply pesticide and insecticides, received the lowest weighted mean of 2.65 and was interpreted as Agree. It represents that the use of a water pump assists the farmer in getting water into the field. According to respondents, they have access to water through the use of a water pump, which allows them to obtain water from the river.
3. Assessing the Mechanization of Rice Production of Harvesting
Table 10 shows the assessment of mechanization of rice production in terms of the Harvesting.
Table 10. Harvesting
|
Harvesting |
WM |
VI |
VD |
|
1. I used a harvester or ripper when harvesting |
3.34 |
Strongly Agree |
Highly in Favor |
|
2. I used a truck to collect the canvas from field of harvesting. |
3.06 |
Agree |
In Favor |
|
3. I transport the canvas by truck. |
3.26 |
Strongly Agree |
Highly in Favor |
|
Total |
3.22 |
Agree |
In Favor |
As shown in the table 10, the respondents stated that they used a harvester or ripper when harvesting, ranked first, with a weighted mean of 3.34 and verbal interpreted as Strongly Agree. However, the respondents stated that they used a truck to collect the canvas from field of harvesting, received the lowest weighted mean of 3.06 and was interpreted as Agree. It shows that the farmers are prepared to use harvesters, which are the most convenient and cost-effective way to harvest rice. As stated by respondents, the best way to harvest the crop is with a harvester, which is also less expensive than harvesting using a traditional method.
According to Ali et al. (2018), many developing nations use a reaper to harvest rice in order to reduce production costs, while some developing nations in South and Southeast Asia also use automatic combine harvesters for harvesting cereal grains. According to Alizadeh and Allameh (2013), manually harvesting 1 ha of rice fields is a taxing, expensive, and time-consuming process that takes between 100 and 150 person-hours of labor. According to Hasan et al. (2019), the lack of modern technologies in many developing nations has led to a widespread use of manual harvesting systems.
Furthermore, data collected from various sources revealed that there are no visible mechanization levels in planting, weeding, fertilizer application, spraying, and field drying. Due to the availability of dryers in some areas, the level of mechanization for harvesting and drying is around 0.15 hp/ha for both harvesting and drying. Suministrado, (2008) stated that using flatbed dryers with capacities ranging from 1 to 6 ton/batch was used to dry 14% of total rice produced in the country, with the remaining 86% sundried.
C. Significant Relationship between the Business Technical Aspect and the Mechanization of Rice Production.
- Business Technical Aspect and the Mechanization of Rice Production in terms of Land preparation
Table 11 presents the significant relationship between the business technical aspect and the mechanization in terms of Land preparation
Table 11. Business Technical Aspect and the Mechanization used by the Respondents in terms of Land preparation
|
Land Preparation |
r-value |
p-value |
VI |
|
Land Area |
0.25 |
0.445835 |
Very low positive correlation |
|
Years in Farming |
-0.54 |
0.349338 |
Moderate negative correlation |
|
Type of agricultural equipment |
0.45 |
0.438937 |
Low positive correlation |
|
Source of water |
-0.80 |
0.101146 |
Very negative correlation |
*Critical value / significance level: (a=0.05)
The table above shows that two (2) of the mechanization and business technical aspects of respondents in terms of land preparation have calculated r-value and interpreted as low positive correlation, but the resulting p-value are greater than critical value of 0.05, so there is no significant relationship between mechanization and business technical aspects. The findings revealed that there is no relationship between mechanization and business technical aspects in land preparation due to the low rate of using modern equipment. In this line, farmers cannot produce a large amount of rice.
According to Suministrado (2013), the Philippines is classified as having a low level of mechanization. Several factors contribute to this, including farmers' low purchasing power, an abundance of rural labor, very small landholdings per farmer, high machine costs, and government policies that are unfavorable to mechanization.
According to RNAM (1994), the level of mechanization in the Philippines was around 0.52 hp/ha in terms of available mechanical power in the farm.
According to Committee Affairs Department, (2009), this level of agricultural mechanization is relatively low, and this low level of mechanization was one of the primary reasons that rice production did not achieve maximum yield.
According to Soni and Ou (2012), the lack of appropriate machinery to conduct various farming operations has left farmers with no choice but to continue using traditional farming techniques.
2. Business Technical Aspect and the Mechanization of Rice Production in term of Crop Care and Maintenance
Table 12 presents the significant relationship between the business technical aspect and the mechanization in terms of Crop Care and Maintenance
Table 12. Business Technical Aspect and the Mechanization used by the Respondents in terms of Crop Care and Maintenance
|
Crop Care and Maintenance |
r-value |
p-value |
VI |
|
Land Area |
-0.72 |
0.284068 |
High negative correlation |
|
Years in Farming |
0.28 |
0.723317
|
Very low positive correlation |
|
Type of agricultural equipment |
0.37 |
0.472989
|
Low positive correlation |
|
Source of water |
- 0 .22 |
0.781017 |
Very low negative correlation |
*Critical value / significance level: (a=0.05)
The table above shows that one (1) the mechanization and business technical aspects of respondents in terms of Crop care maintenance have calculated r-value (0.37) and interpreted as low positive correlation, but the resulting p-value (0.723317) are greater than critical value of 0.05, so there is no significant relationship between mechanization and business technical aspects. The result revealed that there is no relationship between mechanization and business technical aspects when it comes to crop care maintenance.
3. Business Technical Aspect and the Mechanization of Rice Production in term of harvesting
Table 13 presents the significant relationship between the business technical aspect and the mechanization in terms of harvesting.
Table 13. Business Technical Aspect and the Mechanization used by the Respondents in terms of harvesting.
|
Harvesting |
r-value |
p-value |
VI |
|
Land Area |
0.58 |
0.415124 |
Moderate positive correlation |
|
Years in Farming |
0.46 |
0.542934 |
Low positive correlation |
|
Type of agricultural equipment |
0.71 |
0.113844 |
High positive correlation |
|
Source of water |
0.48 |
0.521031 |
Low positive correlation |
*Critical value / significance level: (a=0.05)
The table above shows that one (1) the mechanization and business technical aspects of respondents in terms of Harvesting have calculated r-value (0.71) and interpreted as high positive correlation, but the resulting p-value (0.113844) are greater than critical value of 0.05, so there is no significant relationship between mechanization and business technical aspects. The result revealed that there is no relationship between mechanization and business technical aspects when it comes to harvesting, since not all the farmers didn’t rely on using harvester and truck during harvesting.
But according to Pingali (2007) cited from Walker and Kshirsagar (1981), mechanical threshers spread rapidly in parts of Southeast Asia and India during the late 1970s and early 1980s. The private profitability (efficiency) of using a mechanical thresher over hand beating and animal or tractor treading in any given area is determined by the yield benefits of mechanized threshings, the marketable surplus generated on the farm, and labor wages and availability during the harvesting-threshing period.
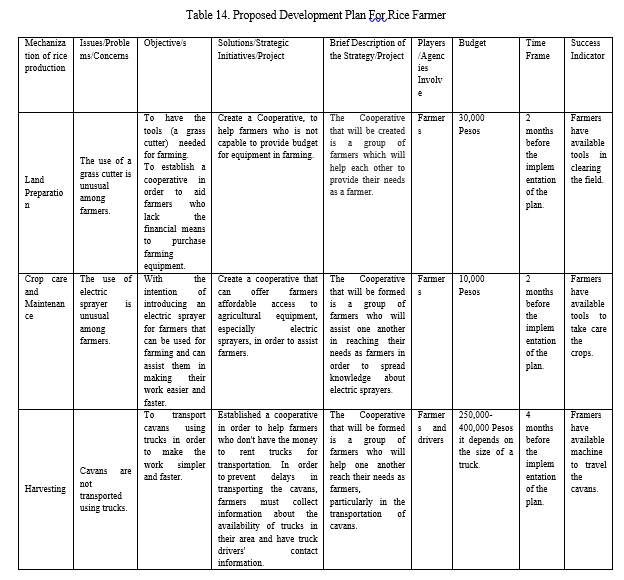
D. Proposed Development Plan for Rice Farmer
The researchers used the data gathered in formulating a development plan as reference for rice production of farmers.
Table 14 is the proposed development plan for the rice farmers. It contains different columns. The first column is the “area” which shows the mechanization of rice production; second column contains the issues, problems, and concerns of the respondents related to the mechanization of rice production ; third column contains objectives of the strategy or the project related to the problems that need to be addressed; fourth column refers to the solutions, strategic initiatives , and project that will answer the items on the second column, the items presented on this column were the results of the interview or the data gathered from the respondents; fifth column displays the brief description of the strategy or project presented on column 4; column 6 displays the players or agencies involve in the strategy or the project who are the responsible persons in the implementation of the activities; seventh column refers to the budget needed for the implementation of the activity; and the last column displays the time frame which refers to the length of the project from the date of its implementation up to the date it will be completed.
Based on the findings, the researchers were able to present the following recommendations:
- It is recommended to provide alternatives source of water such as solar, electric, air powered water pump, and/or use of water tank in case of insufficient or lack of water supply.
- The researchers discovered that not all farmers use modern machineries for crop care and maintenance such us electric sprayer and grass cutter, so they perform not well compared to farmers who use mechanized equipment. In terms of harvesting, the researchers also recommend to use a truck to travel the cavans to make it more convenient than using cart with the help of animals. As a result, the researchers would recommend farmers to use mechanized equipment to perform their tasks more efficiently and to help them increase rice productivity
- Farmers is recommended to use advanced farm equipment and machineries in order to make their work more convenient. It also helps them produce greater amount of rice.
- It is recommended that the researchers' development plan be used to assist rice farmers in continuing to produce rice. The proposed development plan may augment their income, expand, grow, and make their work easier.
References
[1] Adu-Baffour et al. (2019). homas Daum, Ygué Patrice Adegbola, Perceived effects of farm tractors in four African countries, highlighted by participatory impact diagrams. Agronomy for Sustainable Development volume 40, Article number: 47 (2020)
Copyright
Copyright © 2023 Dr. Fhrizz S. De Jesus, Engr. Marlon Leyesa. This is an open access article distributed under the Creative Commons Attribution License, which permits unrestricted use, distribution, and reproduction in any medium, provided the original work is properly cited.

Download Paper
Paper Id : IJRASET55084
Publish Date : 2023-07-29
ISSN : 2321-9653
Publisher Name : IJRASET
DOI Link : Click Here
 Submit Paper Online