

Ijraset Journal For Research in Applied Science and Engineering Technology
Depression Detection Using EEG-Signals
Authors: B. Tejaswi Reddy, B. Khyathi Nikhitha, L. SaiAnish Reddy, Dr. G. R. Anil
DOI Link: https://doi.org/10.22214/ijraset.2023.49505
Certificate: View Certificate
Abstract
The most severe kind of mood disorder, depression, has a significant impact on mental health and causes difficulties in daily living. Electroencephalogram (EEG) signals can detect this mood condition. EEG signal analysis is a tedious, time- consuming, and highly specialized method for manually diagnos- ing depression. Therefore, a fully automated depression detection system developed using EEG signals will be useful to clinicians. In this research work, a CNN based hybrid model was designed and this model resulted with 90percent accuracy, whereas with SVM it resulted in 60.
Introduction
I. INTRODUCTION
A major depression has a profound impact on a person’s family, personal connections, and other elements of general health. Many people experience depression also known as mental condition that affects approximately more than 350 million individuals worldwide. Current methods for diagnos- ing depression have clear drawbacks, including patient denial, low sensitivity, subjective biases, and accuracy issues. Depres- sion diagnosis is labor intensive due to all these drawbacks. Recently, machine learning approaches have been employed to diagnose depression using biosignals. The categorization accuracy and the real application circumstances still differ, though.
A. EEG and EMs Based Depression Recognition :
The EEG, or electrophysiological technology, measures how well the brain is functioning. It is produced by the neurological system of the brain. It is frequently used to help diagnose mental diseases including depression. Numerous studies conducted to date have shown that the EEG is a viable tool for detecting depression. Erguzel achieved an accuracy of 89.12 percent while classifying the EEG data obtained from 147 patients with serious depression using a back-propagation neural network (BPNN). Hosseinifard attained 88.6 percent accuracy overall through the use of a genetic algorithm (GA) and a support vector machine (SVM) classifier for classification. Muralidhar employed the SVM classifier to achieve a precision of 88.92 percent. Beta, delta, theta, and asymmetry were used as features in Mahato, and MultiCluster Feature Selection was used for feature selection. With SVM, they achieved the greatest classification accuracy of 88.33 percent. Mahato used linear, non-linear, and a combination of linear and non-linear variables to categorize depression and healthy people, respectively. Combining linear and non-linear features resulted in the highest categorization, 93.3 percentage. Betul Constructed a deep hybrid model utilizing convolutional neural networks(CNN) and long-short term memories (LSTM) architectures. They provided precise classification of the left and right hemisphere EEG data of 99.12 and 97.66 percentages, respectively. Li [13] used EEG readings and a convolutional neural network (ConvNet) to identify depression. Their technique recognized mild depression with an accuracy of 85.6 percent- age. WHAT WE HAVE DONE: The proposed approach determines depression using EEG signals. The results are more accurate and data loss is reduced compared to existing systems, here we use Convolution neural network (CNN) to learn information about the functional connectivity matrices that are seen in these people.
II. LITERATURE SURVEY
- S. K. Kumar, N. Dinesh and N. L et al[1] proposed Using machine learning classifiers, detect depression in tweets on Twitter. Research was done using five algorithms namely Support Vector Machine, Decision Tree, Random Forest, CNN, and Naive Bayes. They concluded that out of all the algorithms taken into consideration, decision tree classifier gave higher accuracy.
- Y. Huang, J. Xiao and W. Liu et al[2] proposed an automatic depression detection deep learning model that was trained on audio and text sequences. They combined attention mechanism with CNN which resulted in a new Attention-C-CNN model. Along with this BERT model is also used for textual feature extraction. During this research, a model was proposed by combining audio and textual features and this model resulted in higher accuracy than traditional approaches.
- Kota, B. Yalamanchili, Abbaraju, S. V. Alluri and V. S. S. Nadella et al[3] used machine learning approaches, to develop a real-time acoustic-based depression detection system. They identified the need for automation of depression detection and deployed an application named cureD on cloud. The proposed application resulted in 90
- L. P. Hung and E. M. Tadius et al[4] proposed a journaling system that includes an embedded machine learning text depression detection alert. Their motive was to detect depression based on text in a personal diary or journal. To achieve this they used logistic regression which is a supervised machine learning model. The model was able to give accurate results when tested.
- A. Mulay, A. Dhekne, R. Wani, S. Kadam, P. Deshpande and P. Deshpande et al[5] proposed an automatic de- pression level detection through visual input. The model is used to detect depression from images and video. Based on the features classification is done into various categories like minimal, mild, moderate and severe. The answer is generated as a result of the correlation between the mood vector and the inventory vector, which is shown using visual graphics.
- A. S. Liaw and H. N. Chua et al[6] proposed a machine learning-based depression diagnosis model for social media with user network and engagement aspects. Their objective was to create machine learning models that could use social media data to identify depression. For the Twitter dataset, five different This was accomplished using machine learning techniques. Most crucial factors, according to this study, are the number of depression keywords and topic modeling.
- P. Kumar, R. Chauhan, T. Stephan, A. Shankar and S. Thakur et al[7] Smart Watch for Depression Detection is a machine learning implementation for mental health care. They used Logistic Regression, Support Vector Machine (SVM), Decision Tree, K-Nearest Neighbor, and Naive-Bayes algorithms to create an grouping model. Comparison is also done between these algorithms for better understanding. The test outcome from this application can serve as a real-world illustration of IoT in healthcare.
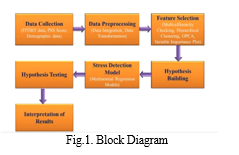
III. METHODOLOGY
Analyzing physiological signs is a solid way to predict stress, according to earlier study. Sensors linked to the human body are used to gather these signals. Researchers tried to determine stress from analyzing physiological signals through the use of conventional machine learning techniques. Mixed outcomes—between 50 and 90 accuracy—have been obtained. A disadvantage using conventional machine learning techniques is their necessity for custom features. Inaccuracy arises when characteristics are not correctly detected. We created a multilayer perceptron neural network and a convolutional neural network in one dimension (1D) as two deep neural networks to overcome this deficiency. Deep neural networks retrieve characteristics derived from raw data using their tiers instead of requiring manually created features. To complete two tasks, Deep neural networks looked at physiological information from sensors worn on the wrist and chest. We specifically designed every neural network to be examined information from either the chest or wrist-worn multilayer perceptron neural network(1D convolutional neural network) sensors. The initial task involved stress detection via bi- nary classification, where Networks may distinguish between stressful and unstressed conditions. The following test required the networks to distinguish between the initial, anxious, and delighted states using a three-class classification system for emotions. On publicly accessible data gathered during earlier investigations, the networks were trained and put to the test.
IV. MODULES EXPLANATION
- Upload EEG-Signal Dataset: With the help of this module, we will upload a dataset to the programme and then separate the dataset’s normal and depressed entries.
- Features Extraction: Using this module we will replace al missing values and then extract features from the dataset and then divide the dataset into train and test sections, with the application using 80percent of the train dataset and 20percent of the test dataset.
- Run Existing SVM Algorithm: We will use this module to train SVM algorithm on 80percent training dataset and then evaluate its performance on 20 percent dataset in terms of accuracy and precision
- Run Proposed CNN Algorithm: using this module we will train propose CNN algorithm on 80 percent training dataset and then evaluate its performance on 20percent dataset in terms of accuracy and precision.
- Predict Depression from the Test Signals: We will submit test dataset using this module, and CNN will then forecast if the test data is normal or depressed.
- Comparison Graph: We will create a comparison graph between SVM and CNN using this module.
V. PROCESS DIAGRAM
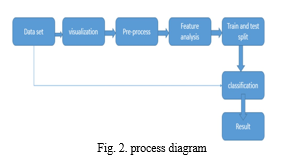
- Data Set: It is a collection of EEG signals obtained from different people.
- Visualization: Based on how they operate internally, a CNN model’s visualization techniques can be broadly divided into three groups. ¿Simple techniques that demonstrate the general structure of a trained model are known as preliminary methods. ¿Methods based on activation - With these techniques, we interpret the activity of a single neuron or a collection of neurons to gain an understanding of what they are doing. ¿Gradient-based techniques: When training a model, these techniques frequently alter the gradients that result from a forward and backward pass.
- Pre-Process: Preprocessing refers to all the modifications performed to the raw data before the algorithm for machine learning or deep learning receives it.
- Feature Analysis: Using feature detectors or filters, edges, vertical and horizontal lines, bends, and other features found in a picture can all be recognised.
- Train and Test, Split: A model validation process known as ”train test split” demonstrates how well your model works with fresh data.
- Classification: Max-pooling, fully linked, and convolu- tional layers all make up the CNN architecture for classification. For feature extraction, convolution and max-pooling layers are employed. Max-pooling layers are intended for feature selection, whereas convolution layers are intended for feature detection.
- Result: finally we get output which is result to the new testing data
VI. ABOUT DATASET
This dataset contains EEG brainwave data that has been extracted statistically using our method
Source: EEG brainwave dataset: mental state Size: 989 columns
To recognize mental states for use in human-machine inter- action. We intend to define discriminative features of EEG- based patterns and develop appropriate classifications for categorizing brainwave patterns based on frequency and activity levels. Based on some mental conditions reported by cognitive- behavioral studies, we determined three conditions in which the head-worn Muse was equipped with four EEG sensors (TP9, AF7, AF8, TP10).
To train and test various techniques, this dataset comprises five individual and one-minute sessions for each state of mind. Alpha, beta, theta, delta, and gamma signals from the EEG headband were used as the suggested collection of characteristics, and selection algorithm and classifier model were tested to examine how well they performed in terms of recognition accuracy and the minimum amount of features needed. The findings demonstrate that conventional classi- fiers like Bayesian Networks, Support Vector Machines, and Random Forests may achieve an overall accuracy of over 87percent using only 44 features from a set of over 2100 characteristic
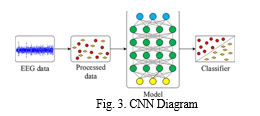
VII. CONVOLUTIONAL NEURAL NETWORK (CNN) — DEEP LEARNING
VIII. THE ALGORITHM BY FOLLOWING
- Feature Extraction: A CNN is made up of several layers, with the first layer designated for feature extraction. The features for this layer will be taken from the input picture dataset or any other multidimensional dataset.
- Feature Selection: By applying a layer known as pooling or max polling to this layer, features will be chosen.
- Activation Module: Using this module, RELU will be applied to input features to eliminate irrelevant characteristics and retain only significant features
- Flatten: This layer will be used to turn multidimensional input features into an input array that is only one dimension tall.
- Dense: This layer can be used to link one layer to another layer so that the input features from the previous layer can be further filtered so that the most critical features from the dataset are obtained in the subsequent layer, which will then produce the best prediction result
The suggested system uses changes in EEG signals to diagnose depression. As a result, the results are more accurate and data loss is reduced. Both linear and nonlinear approaches can successfully identify these changes. Convolution neural network is what we’re employing (CNN) The project’s major goal is to use EEG signals to determine whether a person is normal or abnormal, which will make evaluation easier and produce more reliable results. In order to identify people with mild depression, CNN is used to learn information about the functional connectivity matrices that are seen in these people. In contrast to the graph theory now in use, this strategy is novel for recognizing depression.
IX. RESULT ANALYSIS
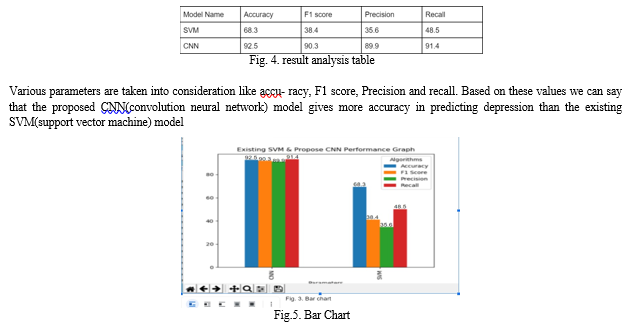
The bar chart shows the performance comparison of CNN and SVM. It can be seen from the findings that the perfor- mance values are higher for CNN than that of SVM. However, the CNN based model takes longer time for computation and has various issues like overfitting, exploding gradient and class imbalance.
Conclusion
This paper has concentrated on depression detection and prediction by using deep learning algorithms which is a convo- lutional neural network using EEG signal. We can observe that this model performs the conventional classification in terms of results, CNN gives more accuracy that is 92.5 which is better than SVM because it gives only 68.3 as accuracy. Future research will focus on exploring more sophisticated EEG signal analysis applications and studying many methods for signal processing and classification. There are several ap- plications that use the analysis of EEG-based computer-aided techniques, however these are either least or not addressed in the current study for example, researching EEG signals for those with neurological diseases and sleep issues. The scope of current research on the categorization and processing of signals employed in these applications will be attempted to be covered. By compiling a significant dataset of patient data and evaluating it using a range of signal processing and classification approaches, it has been intended to further research on EEG-based depression diagnosis.
References
[1] S. K. Kumar, N. Dinesh and N. L, Depression Detection in Tweets from Twitter Using Machine Learning Classifiers, 2022 Second International Conference on Interdisciplinary Cyber Physical Systems (ICPS). [2] J. Xiao, Y. Huang, G. Zhang and W. Liu, ”A Deep Learning Method on Audio and Text Sequences for Automatic Depression Detection,” 2021 3rd The ICAML 2021 International Conference on Applied Machine Learning. [3] Real-time Acoustic based Depression Detection Using Machine Learn- ing Methods, 2020 International Conference on Emerging Trends in Information Technology and Engineering (ic-ETITE), B. Yalamanchili, N. S. Kota, M. S. Abbaraju, V. S. S. Nadella, and S. V. Alluri. b4L. P. Hung and E. M. Tadius, ”Journaling System with Embedded Machine Learning Text Depression Detection Alert,” 2022 IEEE International Conference on Artificial Intelligence in Engineering and Technology (IICAIET), 2022. [4] A. Mulay, A. Dhekne, R. Wani, S. Kadam, P. Deshpande and P. Deshpande, ”Automatic Depression Level Detection Through Visual Input,” 2020 Fourth World Conference on Smart Trends in Systems, Security and Sustainability (WorldS4), 2020. [5] A. S. Liaw and H. N. Chua, ”Depression Detection on Social Media With User Network and Engagement Features Using Machine Learning Methods,” 2022 IEEE International Conference on Artificial Intelligence in Engineering and Technology (IICAIET), 2022. [6] P. Kumar, R. Chauhan, T. Stephan, A. Shankar and S. Thakur, ”A Machine Learning Implementation for Mental Health Care. Application: Smart Watch for Depression Detection,” 2021 11th International Con- ference on Cloud Computing, Data Science Engineering (Confluence), 2021 [7] ”A study on mental state classification utilising EEG-based brain- machine interface,” 9th International Conference on Intelligent Systems, IEEE, 2018, J. J. Bird, L. J. Manso, E. P. Ribiero, A. Ekart, and D. R. Faria.
Copyright
Copyright © 2023 B. Tejaswi Reddy, B. Khyathi Nikhitha, L. SaiAnish Reddy, Dr. G. R. Anil. This is an open access article distributed under the Creative Commons Attribution License, which permits unrestricted use, distribution, and reproduction in any medium, provided the original work is properly cited.

Download Paper
Paper Id : IJRASET49505
Publish Date : 2023-03-11
ISSN : 2321-9653
Publisher Name : IJRASET
DOI Link : Click Here
 Submit Paper Online