

Ijraset Journal For Research in Applied Science and Engineering Technology
Detection of Acetone Using Surface Plasmon Resonance
Authors: Muhammad Arif Bin Jalil , Muhammad Aliff Ali Bin Che Abas
DOI Link: https://doi.org/10.22214/ijraset.2023.48285
Certificate: View Certificate
Abstract
In most industries, detection of substances remains important as applications differ from the industry such as detections of materials for research, detection of toxic substances in liquids and more. There have been numerous ways of detection but few can only acquire data quickly and in real time such as SPR sensors. Surface Plasmon Resonance is an optical detection method that uses surface plasmons and spectroscopy that can only detect a particular substance. Using this technique can be applied for quick detection of substances which can help researchers and engineers to have a more solid precautionary equipment. For this project, the experimental setup has the characteristics of an SPR sensor; however the reflected light can be quickly transferred via fiber optic to a spectrometer and computer for instant results. To further elaborate and complement experimental data, simulations that show the dip of reflectivity of a certain angle at which is called resonance angle which can be done by using Lumerical.
Introduction
I. INTRODUCTION
Acetone is considered as a Volatile Organic Compounds (VOC) which is a colourless and odourless liquid with a distinct smell and taste. It evaporates easily, is flammable, and dissolves in water. It is also called dimethyl ketone, 2-propanone, and beta-keto propane. Acetone is used to make plastic, fibers, drugs, and other chemicals. It is also used to dissolve other substances. It occurs naturally in plants, trees, volcanic gases, forest fires, and as a product of the breakdown of body fat. It is present in vehicle exhaust, tobacco smoke, and landfill sites. Industrial processes contribute more acetone to the environment than natural processes. [1]
Fiber optics are two cylindrical glasses that are as thin as a strand of hair where the outer reflecting layer is called cladding while the inner transmitting cylinder is called the fiber core. The diameters of the two materials are typically around 125 micrometers and 10 micrometers respectively. Fiber optics transmit light from one point to another via a process named total internal reflection where the light will bounce in the fiber core, propagating in one direction for long distances with little attenuation. The applications for fiber optics have spread from surgery purposes to telecommunications.
Surface Plasmon Resonance (SPR) is an optical detection technique for studying biomolecular interactions in real time. The collective oscillation of conduction band electrons that are in resonance with the oscillating electric field of incident light, which will produce energetic plasmonic electrons through non-radiative excitation. These particular electrons are called plasmons which are the coupling of the electric field from p-polarized light and the charge density wave (electrons).
II. METHODOLOGY
The Figure 2.1 shows the expected experimental setup of the sensor which consists of light source, threaded kinematic mount, fiber optics, fiber optic without the cladding where the gold will be deposited, container and spectrometer.
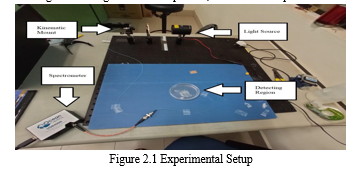
The expected setup could not be accomplished as there were no rotating stages for the manipulation of incident angles of light source. The light source used was not a laser but a Thorlabs Quartz Tungsten-Halogen lamp that has an emission from 400 to 2200 nm with 50 mW output power. The light from the lamp will be collected by the Thorlabs Threaded Kinematic Mount 100T that will transfer it to the fiber optic. The connecting fiber optics have a rubber protecting layer to prevent the fibers from snapping when moving the fibers around. The optic fiber in the middle is where only the core fiber is exposed where the gold is coated all over it. This area is where the acetone and ethanol will drop onto the detecting region for the surface plasmons to detect the liquids. The golden core fiber is in Figure 2.2:
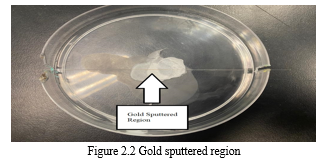
The fiber optics connecting to both sides of the middle detecting region are joined with an atomic splicer. Unfortunately, this will make the fiber optics setup much fragile and need to be handled in a delicate manner. The materials used for this experiment are 99 percent acetone and ethanol. The spectrometer used was an Ocean Optics USB4000 where it has connective cables from the fiber optics to the computer. The data is then generated by a software called SpectreSuite from updating the driver from the USB4000.
A. Sample Preparation
To achieve the second objective of this study, variable concentrations of acetone need to be prepared. Many journals prepare their samples by their own quantitative units of concentration such as molarity (mol/L), molality (mol/kg), parts per thousand (ppth), million (ppm) or billion (ppb). In this case, concentration of parts per thousand will be used for simplicity. The parameters used for the preparation of the acetone is in militer as the acetone is only poured in a beaker to 10 ml. The calculation of the 10 ml concentration of acetone will be shown below:
ppth = mass of solute mass of sample x 1,000
ppth (1) = 7.85 7.85 x 1,000 = 1,000 ppth
Next, another sample is prepared by adding 10 ml of distilled water where the mass of solution will be 17.85g thus the concentration of sample will be:
ppth (2) = 7.85 17.85 x 1,000 = 439.77 ppth
Four samples are then prepared by each adding 10ml of water and their concentrations are calculated and tabulated.
III. RESULTS AND DISCUSSION
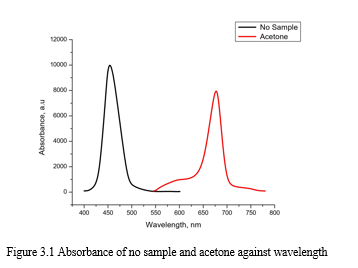
Table 3.1 Samples with their respective peak wavelengths, nm and peak absorbance, a.u
|
Samples |
Peak Wavelength, nm |
Peak Absorbance, a.u |
|
No Sample |
450.26 |
10089.00 |
|
Acetone |
673.89 |
8089.00 |
When there is no sample, the spectrometer shows that there is the absorption spectrum of gold where according to You et al (2004), the wavelength at the maximum absorption peak (λmax) for gold thickness of 41 nm is 530 nm [2]. For this study, the gold that is coated onto the fiber core has a thickness of 50 nm but has a maximum absorption peak of 450.26 nm. As acetone was added onto the detecting region, another absorption spectrum has been observed where its maximum absorption peak is 673.89 nm. The shift wavelength from the no sample and acetone is 223.63 nm.
The calibration of the spectrometer had been done similar to the above experiment which are altering the boxcar width to reduce the noise, giving a smoother absorption line and Electric Dark Correction and Stray Light Correction have been enabled to filter out stray light from external sources that will cause more noise.
Table 3.2 Concentrations of acetone, ppth with their respective peak absorbance, a.u
|
Concentration of Acetone (ppth) |
Peak Absorbance (a.u) |
|
135.69 |
6154.73 |
|
164.05 |
7069.92 |
|
207.39 |
7214.17 |
|
281.87 |
8025.60 |
|
439.77 |
8089.00 |
|
1000.00 |
10089.00 |
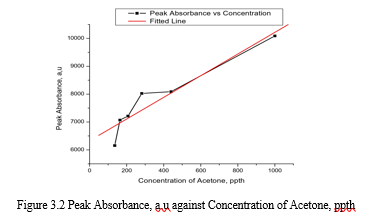
This shows the relationship between peak absorbance and concentration of acetone where it is a linear relation from the fitted line. There have been no articles specifically regarding this relationship but there have been articles about concentrations of other samples with other parameters such as degree per parts per million (θ/ppm) in Nylander et al (1982) where they stated “These curves show a linear relation between Δθ and gas concentration, which actually holds for concentrations up to 2%. A more careful measurement on one of the films was performed for very low concentrations. This result confirms the earlier mentioned linearity between Δθ and gas concentration”. [3]
Conclusion
The experimental setup is a simple model that mimics the Kretschman configuration but is also another improvement to it where the reflected light can be channeled through a spectrometer to get results with no attenuation. The acetone has shown to have an effect on the gold-sputtered fiber optic core where we get an absorbance spectrum. This shows that the surface plasmons are interacting with the acetone molecules where some of the energy is absorbed by the liquid, causing the rise in absorbance around 673.89 nm. The shift of wavelengths of the peak absorbance from the original spectrum (no sample) is 223.63 nm. Different concentrations of acetone have shown to have a linear relation with peak absorbance. Other articles have also shown the same relation but with different parameters.
References
[1] Pubchem (2019). Acetone. [online] Nih.gov. Available at: https://pubchem.ncbi.nlm.nih.gov/compound/acetone. [2] You, Shao et al. (2015). “A study on the sizes and concentrations of gold nanoparticles by spectra of absorption, resonance Rayleigh scattering and resonance nonlinear scattering”. Spectrochimica Acta Part A, vol 61, pp.2861-2866. [3] Vörös, Z. and Johnsen, R. (2008). A simple demonstration of frustrated total internal reflection. American Journal of Physics, 76(8), pp.746–749.
Copyright
Copyright © 2023 Muhammad Arif Bin Jalil , Muhammad Aliff Ali Bin Che Abas . This is an open access article distributed under the Creative Commons Attribution License, which permits unrestricted use, distribution, and reproduction in any medium, provided the original work is properly cited.

Download Paper
Paper Id : IJRASET48285
Publish Date : 2022-12-21
ISSN : 2321-9653
Publisher Name : IJRASET
DOI Link : Click Here
 Submit Paper Online