

Ijraset Journal For Research in Applied Science and Engineering Technology
Determination of Suitable Hyperparameters of Artificial Neural Network for the Best Prediction of Geotechnical Properties of Soil
Authors: Jitendra Khatti, Dr. Kamaldeep Singh Grover
DOI Link: https://doi.org/10.22214/ijraset.2022.43662
Certificate: View Certificate
Abstract
The artificial neural network is robust in predicting soil properties. The present study aims to determine the suitable hyperparameters such as number of hidden layers, neurons, and backpropagation algorithms for the best prediction of geotechnical properties of soil. The supervised learning category-based multilayer perceptron artificial neural network approach is used, and models are developed in MATLAB R2020a. The ANN models are configured with neurons (5, 10 & 15), hidden layers (one to five), and a backpropagation algorithm (LM, BFG, SCG, GDA, GD & GDA). Fifteen ANN models are developed for each algorithm. The study shows that the LM, BFG, and SCG algorithm-based ANN models require strongly (0.61-0.8) to very strongly (0.81-1) correlated datasets. On the other hand, the GDM, GD, and GDA algorithm-based ANN models require only strongly correlated datasets to achieve a performance of more than 0.9. In most cases, it is also found that the GDM, GD, and GDA algorithm-based ANN models achieve high performance with three hidden layers interconnected with ten neurons. Still, LM algorithm-based ANN model achieves high performance with a single hidden layer interconnected with 5/15 neurons. The present work draws a relationship between the correlation coefficient and the number of hidden layers & neurons. It also helps to study the effect of hidden layers and neurons on the performance of ANN models. Formulas are derived from the performance of ANN models to calculate the required number of hidden layers and neurons for a particular backpropagation algorithm to achieve a testing performance of more than 0.9.
Introduction
I. INTRODUCTION
Atterberg's limits and compaction parameters of soil play a vital role in any Civil Engineering Project. The liquid limit, plasticity index, and plastic limit are the Atterberg's limits of soil [4]. The liquid limit of soil is experimentally determined as per IS 2720 (P-5): 1985 [15] using Cone penetration and Casagrande tests apparatus. On the other hand, the compaction parameters are optimum moisture content and maximum dry density and are determined as per IS 2720 (P-7): 1980 [16] and IS 2720 (P-8): 1983 [17]. The compaction parameters are determined using a standard proctor and modified proctor test apparatus. The standard and modified proctor tests are light and heavy compaction tests. Analytical and laboratory methods can determine Atterberg's soil limits and compaction parameters of soil [28]. Regression analysis is the most popular statistical method used for prediction. The regression analysis predicts the compaction parameters for specific soils [10, 21, 23, 12, 8]. The published regression models predicted compaction parameters with a coefficient of determination ranging from 0.64 to 0.98. The prediction level of regression analysis is high for small datasets. The genetic programming-based multi expression programming approach predicts the OMC and MDD of soil with a coefficient of 0.923 and 0.858, respectively [27]. Optimum moisture content increases with the liquid limit of soil and is strongly related to each other. The plastic limit is directly related to OMC and MDD but not LL. Still, the best prediction of OMC and MDD can be achieved by both LL and PL [14, 26]. The regression analysis with SVM computes the OMC and MDD with a correlation coefficient of 0.92 and 0.89, respectively [11]. The maximum dry density decreases, and optimum moisture content increases with the plasticity index. Using the plasticity index, the prediction of OMC for a modified proctor is more than the standard proctor [20]. The GMDH-type neural network is a reliable AI approach for predicting OMC and MDD of soil [2]. The grain-size parameters of coarse soil play an important role in predicting the OMC and MDD of soil. The coefficient of uniformity and D30 can predict the MDD of soil with a prediction accuracy of ±2% [24]. Similarly, the coefficient of uniformity and D50 can predict the OMC of soil with a prediction accuracy of ±2% [10]. The empirical relationship helps to predict the compaction parameters of the modified proctor test using the compaction parameters of the standard proctor test.
The artificial neural network has the potential to predict the OMC and MDD of soil [25]. The index properties, namely LL, PL, PI, FC, S, G, and SG, predict the OMC and MDD with high accuracy [19]. Multivariate adaptive regression splines predict compaction parameters with better performance than empirical equations, ANN and LSSVM. The sensitivity analysis shows that sand content and coefficient of uniformity highly affect compaction parameters' prediction [23]. The compaction parameters are highly influenced by Atterberg limits, clay content, silt content and electrical conductivity [22]. Soil parameters, namely LL, PL PI, SG, c, G, S, and FC, predict OMC and MDD with the correlation coefficient of 0.932 and 0.905, respectively [3].
The number of hidden neurons is based on the number of output neurons, input neurons, and training samples. Researchers suggested the following equations:
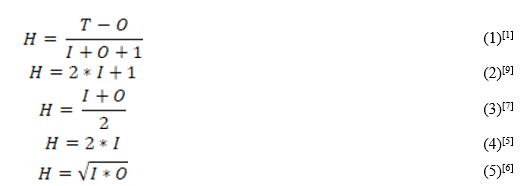
Where H, O, & I are the number of hidden neurons, output neurons & input neurons, and T is the training sample. The sand content affects the liquid limit of soil. Similarly, the plasticity index is affected by OMC, MDD, sand, and gravel content. Gaussian and Quadratic kernel-based support vector machine models predict soil's liquid limit and plasticity index with the performance of 0.9767 and 0.9828, respectively. [18]
II. DATA COLLECTION AND ANALYSIS
Data analysis is a process to study the datasets with the help of statistical tools or methods. The data analysis consists of details of data sources, descriptive statistics, frequency distribution, and correlation coefficient for pair of datasets, as discussed below.
A. Data Source
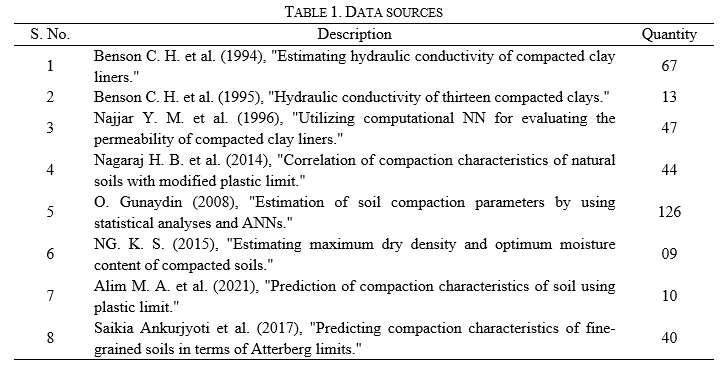
The soil datasets consist of sand content, fine content, liquid limit, plasticity index, optimum moisture content, and maximum dry density. A total of 356 datasets are collected from the published research work, as given in Table 1.
The outliers & missing datasets are removed from collected datasets by pre-processing. After pre-processing, two hundred forty-three soil datasets were collected and divided into 190 training and 53 testing datasets. Furthermore, 190 training datasets are subdivided at 70% and 30% for the training and validation of models.
B. Descriptive Statistics
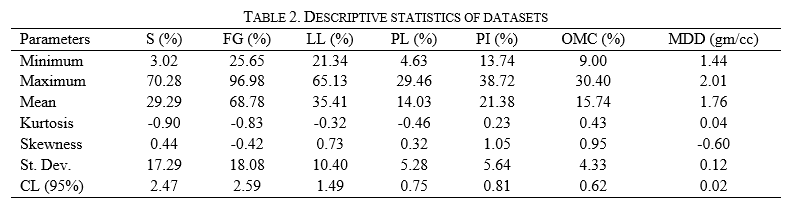
A dataset consists of many columns and rows; therefore, the descriptive statistics are mapped to study the dataset. The minimum, maximum, mean, mode, median, standard deviation, confidence level at 95%, etc., are parameters of descriptive statistics. In the present research work, the minimum, maximum, mean (average), standard deviation (St. Dev), and confidence interval (CL) at 95% is determined for each feature of the dataset. The descriptive statistics of 190 datasets are shown in Table 2.
C. Pearson’s Product-Moment Correlation Coefficient
The correlation coefficient is the way to determine the strength of the linear relationship between independent and dependent variables. The Linear or curvilinear correlation, scatter diagram method, Pearson's product-moment correlation coefficient, and spearman's rank correlation coefficient are the methods for determining correlation coefficient or relationship. The relationship of the pair of datasets according to the range of correlation coefficients is given in Table 3 [13].
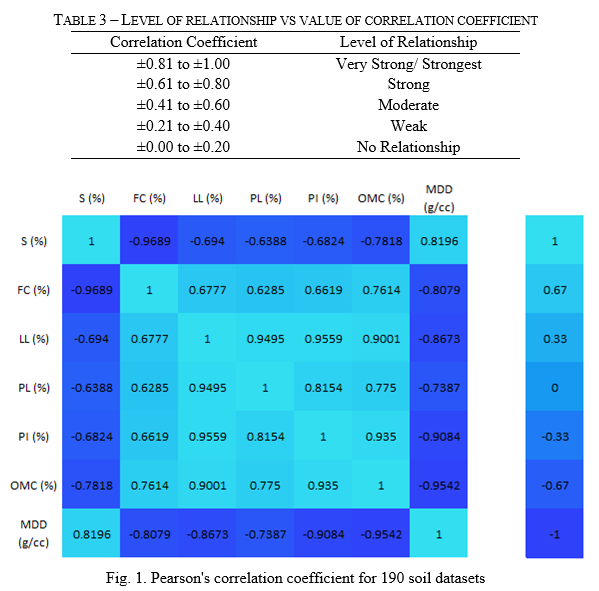
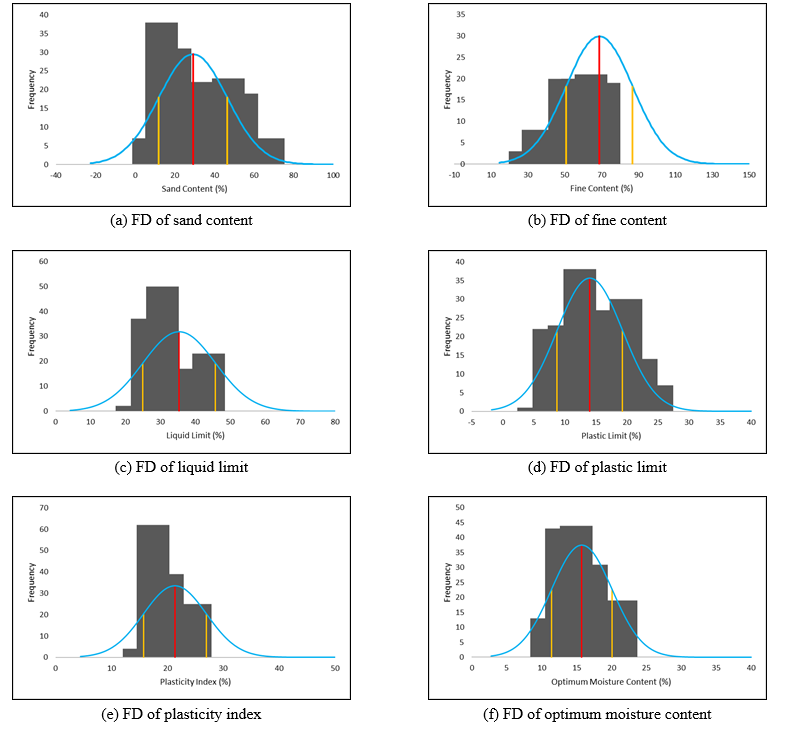
Fig. 1 depicts the Pearson's correlation coefficient for 190 training datasets. The consistency limits of soil are affected by the shape and size of particles. Therefore, the sand and fine content are input parameters to predict the liquid limit, plastic limit, and plasticity index. Thus, the compaction parameters of soil are affected by sand, fine content, and consistency limits. Therefore, the sand, fine content, LL, PL, and PI are used as input parameters to predict the OMC and MDD of soil. From Figure 2, the following points are observed; (i) the liquid limit, plastic limit, and plasticity index have a strong relationship with sand and fine content, (ii) the liquid limit and plasticity index have a very strong relationship with optimum moisture content, (iii) the sand content, liquid limit, and plasticity index has a very strong relationship with maximum dry density, (iv) the sand & fine content and plastic limit has a strong relationship with optimum moisture content, (v) the sand content and plastic limit has a strong relationship with maximum dry density, (vi) the sand & fine content, LL & PL, LL & PI, and PL & PI have multicollinearity.
D. Frequency Distribution
Frequency distribution (FD) is a graphical presentation of the number of observations for a specific interval. The histogram is a bar graph-like representation of the frequency of datasets. The frequency distribution of features of consistency limit with OMC & MDD is shown in Fig. 2.
III. METHODOLOGY
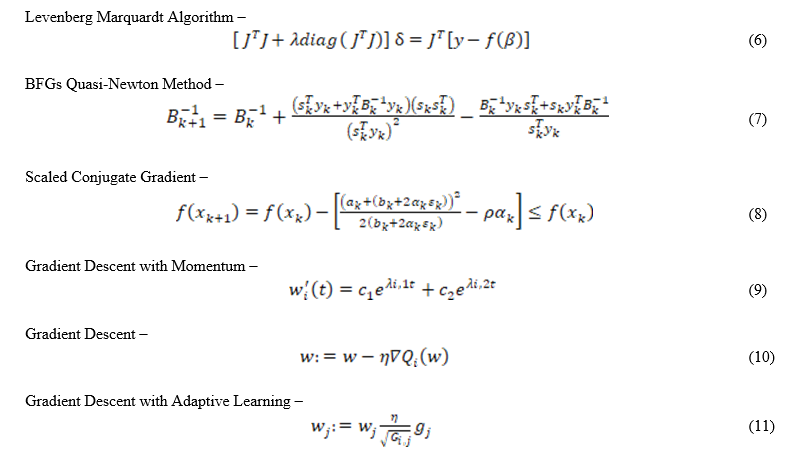
The present research work adopted the artificial neural network approach to predict soil's consistency limits and compaction parameters. An artificial neural network is an approach to deep learning, and deep learning is a subset of machine learning. The artificial neural network is a network of input, hidden & output layers and interconnected by neurons. The hidden layer and output layer has linear or nonlinear activation function to improve the performance of the ANN models. Each artificial neural network has a feedforward and backpropagation process. The information travels from the input to the output layer through hidden layer(s) in the feedforward process. Thus, the information travels from output to input layers in the backpropagation process. The backpropagation process is performed using different algorithms such as Levenberg Marquardt, BFGs Quasi-Newton, Scaled Conjugate Gradient, Gradient Descent with Momentum, Gradient Descent, and Gradient Descent with Adaptive Learning. The mathematical expression of the backpropagation algorithm is given below.
In the present research work, the multilayer perceptron artificial neural network has been developed to predict soil's LL, PI, OMC, and MDD. The developed artificial neural network is configured with different parameters, as given in Table 4.
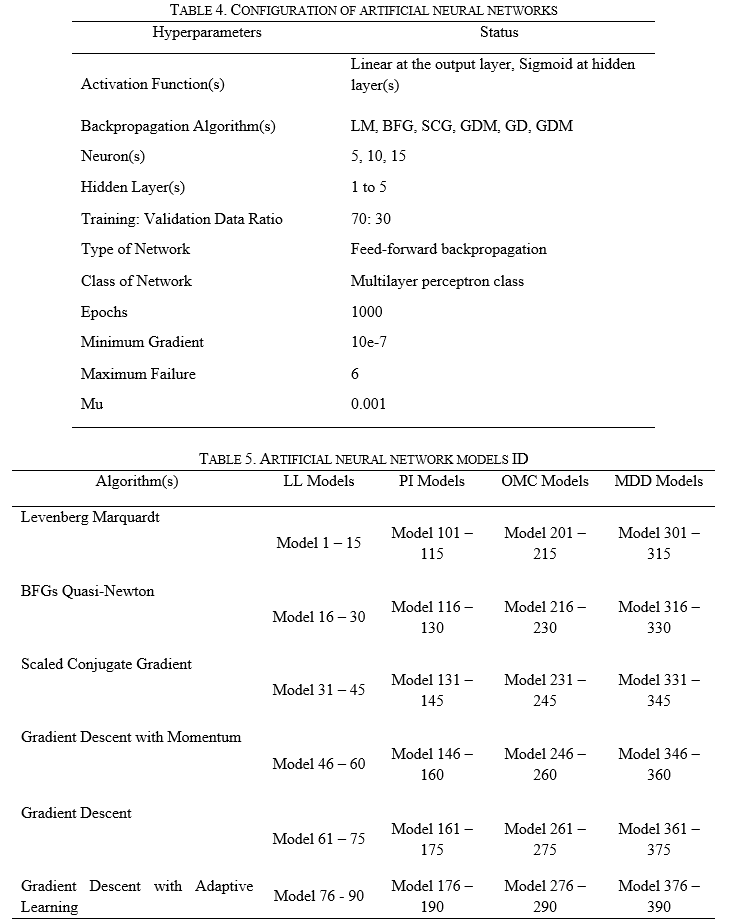
In the present research, fifteen ANN models are developed for each backpropagation algorithm to predict soil's LL, PI, OMC, and MDD. Ninety ANN models are used to predict each LL, PI, OMC, and MDD of soil. The details of the developed models are given in Table 5. Five, ten and fifteen neurons are employed for each one, two, three, four, and five hidden layers ANN model in every backpropagation algorithm ANN model. Therefore, fifteen ANN models are developed for each algorithm.
IV. RESULTS AND DISCUSSIONS
In this section, the performance of developed artificial neural network models has been compared and discussed.
A. Prediction of Liquid Limit
For the prediction of liquid limit, the LM, BFG, SCG, GDA, GD, and GDM algorithm-based artificial neural network models have evolved with different numbers of hidden layers and neurons. The performance of the proposed models has been discussed below.
- Using Levenberg – Marquardt (LM) Algorithm Based Neural Network Models
Fifteen LM algorithm-based ANN models have been developed for predicting the liquid limit of soil, and the performance of models is given in Table 6.
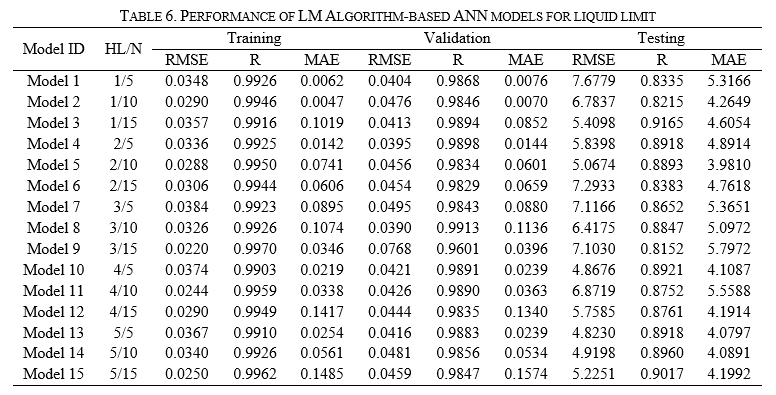
Table 6 shows that Model 3 predicts the liquid limit of soil with a performance of 0.9165. It has also been observed that the model's performance has been increased with neurons in the case of single hidden layer ANN models. The performance of two and four hidden layer-based ANN models has been decreased with neurons. On the other hand, the performance of three and five hidden layer-based ANN models has been increased with neurons. Models 8 and 9 performed well during training and validation, respectively, but Model 3 outperformed the other models while testing the model. Therefore, Model 3 has been identified as a better performance model for predicting soil LL.
2. Using BFGs Quasi – Newton (BFG) Algorithm Based Neural Network Models
The artificial neural networks have been developed to predict soil LL using BFG's Quasi-Newton algorithm. The performance of BFG algorithm-based models is given in Table 7.
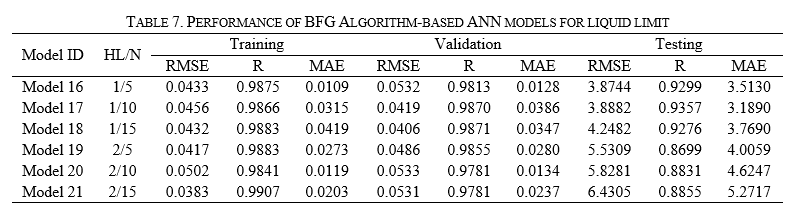
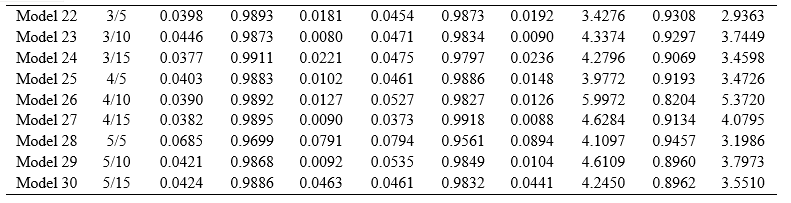
Table 7 shows the training, validation, and testing performance of BFG algorithm-based ANN models while predicting soil LL. The maximum performance of a single hidden layer-based ANN model has been achieved by providing ten neurons. Similarly, 0.8855 performance has been achieved by two hidden layer-based ANN models interconnected with 15 neurons. It has also been observed that the performance of BFG algorithm-based ANN models has been decreased by providing two hidden layers. Furthermore, the performance has been increased to 0.9308 by providing three hidden layers interconnected with five neurons. The performance of the BFG algorithm-based ANN model has been decreased for four hidden layers interconnected with ten neurons. The maximum performance has been obtained by the ANN model configured with five hidden layers and neurons, i.e., 0.9457. The performance results show that the two and four hidden layers-based BFG algorithm ANN models are less efficient in predicting soil LL.
3. Using Scaled Conjugate Gradient (SCG) Algorithm Based Neural Network Models
The artificial neural networks have been developed to predict the LL of soil using the Scaled Conjugate Gradient algorithm. The performance of SCG algorithm-based models is given in Table 8.
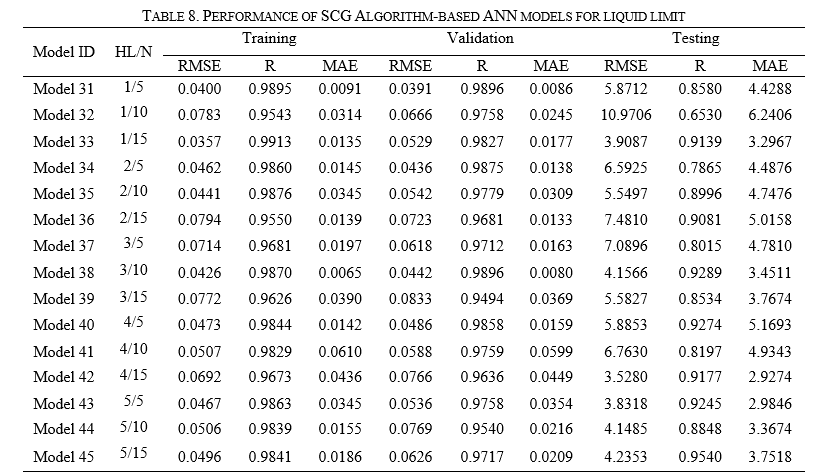
From Table 8, it has been observed that the single, two, three, four, and five hidden layers SCG algorithm-based ANN models have predicted liquid limits with the performance of 0.9139, 0.9081, 0.9289, 0.9274, and 0.9540, respectively. Furthermore, the five hidden layers interconnected with 15 neuron-based ANN models outperformed the other SCG algorithm-based ANN models in predicting the liquid limit of soil with a performance of 0.9540.
4. Using Gradient Descent with Momentum (GDM) Algorithm Based Neural Network Models
The artificial neural networks have been developed to predict soil LL using Gradient Descent with Momentum algorithm. The performance of GDM algorithm-based models is given in Table 9.
Table 9. Performance of GDM Algorithm-based ANN models for liquid limit
|
Model ID |
HL/N |
Training |
Validation |
Testing |
||||||
|
RMSE |
R |
MAE |
RMSE |
R |
MAE |
RMSE |
R |
MAE |
||
|
Model 46 |
1/5 |
0.0800 |
0.9586 |
0.0209 |
0.0767 |
0.9576 |
0.0185 |
5.9647 |
0.8322 |
4.9968 |
|
Model 47 |
1/10 |
0.1451 |
0.8575 |
0.0483 |
0.1815 |
0.8796 |
0.0753 |
12.9322 |
0.9122 |
8.4343 |
|
Model 48 |
1/15 |
0.1153 |
0.9103 |
0.0463 |
0.1344 |
0.9041 |
0.0558 |
5.6091 |
0.7938 |
4.2729 |
|
Model 49 |
2/5 |
0.1295 |
0.8816 |
0.0574 |
0.1373 |
0.8749 |
0.0527 |
5.3103 |
0.8867 |
4.3979 |
|
Model 50 |
2/10 |
0.2844 |
0.3751 |
0.6033 |
0.2681 |
0.2900 |
0.6413 |
7.8988 |
0.5598 |
5.4421 |
|
Model 51 |
2/15 |
0.0841 |
0.9541 |
0.0195 |
0.0931 |
0.9357 |
0.0197 |
6.8683 |
0.8607 |
5.1926 |
|
Model 52 |
3/5 |
0.1236 |
0.8817 |
0.0340 |
0.1537 |
0.8535 |
0.0485 |
6.6096 |
0.7355 |
5.1476 |
|
Model 53 |
3/10 |
0.1015 |
0.9297 |
0.0203 |
0.1110 |
0.9146 |
0.0298 |
4.7812 |
0.9618 |
3.0514 |
|
Model 54 |
3/15 |
0.3214 |
0.5528 |
0.1713 |
0.3283 |
0.5355 |
0.1483 |
10.7639 |
0.5848 |
7.4079 |
|
Model 55 |
4/5 |
0.1005 |
0.9297 |
0.0566 |
0.0999 |
0.9380 |
0.0602 |
6.0067 |
0.7397 |
4.5894 |
|
Model 56 |
4/10 |
0.1124 |
0.9080 |
0.0281 |
0.1291 |
0.9040 |
0.0359 |
3.7282 |
0.9144 |
2.6420 |
|
Model 57 |
4/15 |
0.0691 |
0.9671 |
0.0094 |
0.0764 |
0.9621 |
0.0093 |
2.9164 |
0.9325 |
2.0099 |
|
Model 58 |
5/5 |
0.1368 |
0.8732 |
0.0437 |
0.1199 |
0.8937 |
0.0335 |
3.1886 |
0.9426 |
2.1772 |
|
Model 59 |
5/10 |
0.0906 |
0.9441 |
0.0115 |
0.0922 |
0.9418 |
0.0107 |
6.9505 |
0.7866 |
4.9439 |
|
Model 60 |
5/15 |
0.1315 |
0.8746 |
0.0310 |
0.1349 |
0.8779 |
0.0333 |
3.9079 |
0.9513 |
2.7793 |
From Table 9, it has been observed that the one, two, three, four, and five hidden layers-based ANN models have predicted LL of soil with the performance of 0.9122, 0.8867, 0.9618, 0.9325, and 0.9513, respectively. Furthermore, the three hidden layers interconnected with ten neuron-based ANN models outperformed the other GDM algorithm-based ANN models in predicting the liquid limit of soil with a performance of 0.9618.
5. Using Gradient Descent (GD) Algorithm Based Neural Network Models
The artificial neural networks have been developed to predict the LL of soil using the Gradient Descent algorithm. The performance of GD algorithm-based models is given in Table 10.
Table 10. Performance of GD Algorithm-based ANN models for liquid limit
|
Model ID |
HL/N |
Training |
Validation |
Testing |
||||||
|
RMSE |
R |
MAE |
RMSE |
R |
MAE |
RMSE |
R |
MAE |
||
|
Model 61 |
1/5 |
0.2067 |
0.7202 |
0.0604 |
0.2225 |
0.7351 |
0.0670 |
5.4149 |
0.7281 |
4.1979 |
|
Model 62 |
1/10 |
0.1273 |
0.8951 |
0.0323 |
0.1702 |
0.8292 |
0.0503 |
4.9193 |
0.9094 |
3.5267 |
|
Model 63 |
1/15 |
0.1092 |
0.9097 |
0.0540 |
0.1087 |
0.9401 |
0.0492 |
4.4827 |
0.8242 |
3.6448 |
|
Model 64 |
2/5 |
0.1017 |
0.9317 |
0.0213 |
0.1102 |
0.9045 |
0.0235 |
8.1135 |
0.7702 |
5.3699 |
|
Model 65 |
2/10 |
0.1327 |
0.8805 |
0.0303 |
0.1228 |
0.8996 |
0.0306 |
4.6994 |
0.8721 |
3.0587 |
|
Model 66 |
2/15 |
0.1244 |
0.8863 |
0.0468 |
0.1498 |
0.8539 |
0.0617 |
4.7975 |
0.8578 |
3.6794 |
|
Model 67 |
3/5 |
0.2447 |
0.4376 |
0.0679 |
0.2472 |
0.4964 |
0.0712 |
5.8200 |
0.7148 |
3.6111 |
|
Model 68 |
3/10 |
0.0782 |
0.9586 |
0.0086 |
0.0797 |
0.9575 |
0.0081 |
5.1040 |
0.9114 |
3.9607 |
|
Model 69 |
3/15 |
0.0873 |
0.9431 |
0.0401 |
0.0999 |
0.9522 |
0.0431 |
3.4436 |
0.9310 |
2.3775 |
|
Model 70 |
4/5 |
0.1324 |
0.8709 |
0.0443 |
0.1290 |
0.8985 |
0.0408 |
4.9713 |
0.8178 |
2.8388 |
|
Model 71 |
4/10 |
0.1221 |
0.8938 |
0.0324 |
0.0995 |
0.9393 |
0.0253 |
6.9482 |
0.6125 |
4.1104 |
|
Model 72 |
4/15 |
0.0787 |
0.9576 |
0.0180 |
0.0956 |
0.9429 |
0.0209 |
8.1832 |
0.8020 |
5.8414 |
|
Model 73 |
5/5 |
0.1340 |
0.8823 |
0.0521 |
0.1632 |
0.7879 |
0.0507 |
5.7355 |
0.7452 |
4.4033 |
|
Model 74 |
5/10 |
0.1009 |
0.9234 |
0.0256 |
0.1323 |
0.9214 |
0.0340 |
5.3225 |
0.8715 |
3.1104 |
|
Model 75 |
5/15 |
0.0765 |
0.9610 |
0.0120 |
0.0709 |
0.9647 |
0.0109 |
6.2058 |
0.8797 |
4.4540 |
From Table 10, it has been observed that the one, two, three, four, and five hidden layers-based ANN models have predicted LL of soil with the performance of 0.9094, 0.8721, 0.9310, 0.8020, and 0.8797, respectively. Furthermore, the three hidden layers interconnected with 15 neuron-based ANN models outperformed the other GD algorithm-based ANN models in predicting the liquid limit of soil with a performance of 0.9310.
6. Using Gradient Descent Algorithm with Adaptive Learning (GDA) Based Neural Network Models
The artificial neural networks have been developed to predict soil LL using Gradient Descent with Adaptive Learning algorithm. The performance of GDA algorithm-based models is given in Table 11.
Table 11. Performance of GDA Algorithm-based ANN models for liquid limit
|
Model ID |
HL/N |
Training |
Validation |
Testing |
||||||
|
RMSE |
R |
MAE |
RMSE |
R |
MAE |
RMSE |
R |
MAE |
||
|
Model 76 |
1/5 |
0.0557 |
0.9810 |
0.0371 |
0.0633 |
0.9738 |
0.0329 |
3.5727 |
0.9223 |
2.6436 |
|
Model 77 |
1/10 |
0.0577 |
0.9796 |
0.0833 |
0.0697 |
0.9623 |
0.0799 |
4.5591 |
0.8907 |
3.7521 |
|
Model 78 |
1/15 |
0.0899 |
0.9476 |
0.2601 |
0.0968 |
0.9475 |
0.2806 |
5.2858 |
0.7781 |
2.9657 |
|
Model 79 |
2/5 |
0.0786 |
0.9599 |
0.0295 |
0.0894 |
0.9438 |
0.0248 |
4.1132 |
0.8749 |
3.0876 |
|
Model 80 |
2/10 |
0.0736 |
0.9643 |
0.0435 |
0.0795 |
0.9620 |
0.0533 |
4.5348 |
0.9004 |
3.1185 |
|
Model 81 |
2/15 |
0.0605 |
0.9766 |
0.0206 |
0.0839 |
0.9510 |
0.0235 |
3.8797 |
0.9330 |
2.4621 |
|
Model 82 |
3/5 |
0.0651 |
0.9739 |
0.0287 |
0.0670 |
0.9684 |
0.0271 |
9.0092 |
0.7800 |
5.9406 |
|
Model 83 |
3/10 |
0.1104 |
0.9192 |
0.0369 |
0.1046 |
0.9134 |
0.0343 |
2.2460 |
0.9634 |
1.5806 |
|
Model 84 |
3/15 |
0.0843 |
0.9528 |
0.0355 |
0.0880 |
0.9498 |
0.0398 |
5.6771 |
0.7517 |
3.5682 |
|
Model 85 |
4/5 |
0.1366 |
0.8693 |
0.0434 |
0.1165 |
0.9088 |
0.0420 |
4.6920 |
0.8651 |
3.0160 |
|
Model 86 |
4/10 |
0.0847 |
0.9496 |
0.0204 |
0.0954 |
0.9403 |
0.0202 |
7.4531 |
0.7947 |
4.4989 |
|
Model 87 |
4/15 |
0.0852 |
0.9523 |
0.0457 |
0.0792 |
0.9579 |
0.0429 |
6.9996 |
0.8408 |
4.6421 |
|
Model 88 |
5/5 |
0.1474 |
0.8491 |
0.0686 |
0.1334 |
0.8698 |
0.0582 |
3.9976 |
0.8997 |
2.6500 |
|
Model 89 |
5/10 |
0.1032 |
0.9311 |
0.0655 |
0.1194 |
0.8935 |
0.0621 |
4.1983 |
0.8881 |
2.9911 |
|
Model 90 |
5/15 |
0.0963 |
0.9331 |
0.1603 |
0.1111 |
0.9206 |
0.1588 |
6.6625 |
0.8391 |
4.3994 |
From Table 11, it has been observed that the one, two, three, four, and five hidden layers-based ANN models have predicted LL of soil with the performance of 0.9223, 0.9330, 0.9634, 0.8651, and 0.8997, respectively. In addition, the three hidden layers interconnected with ten neuron-based ANN models outperformed the other GDA algorithm-based ANN models in predicting the liquid limit of soil with a performance of 0.9634.
The performance variation of ANN models configured with different backpropagation algorithms for predicting the liquid limit of soil has been mapped, as shown in Fig. 3.
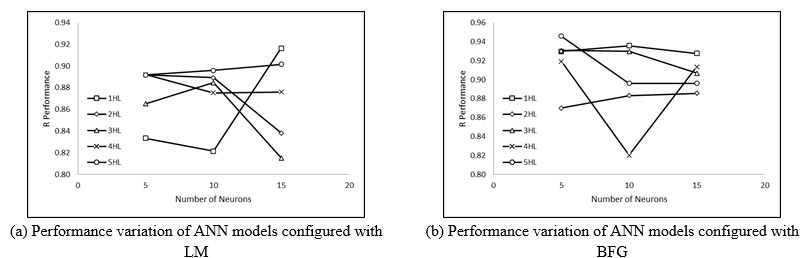
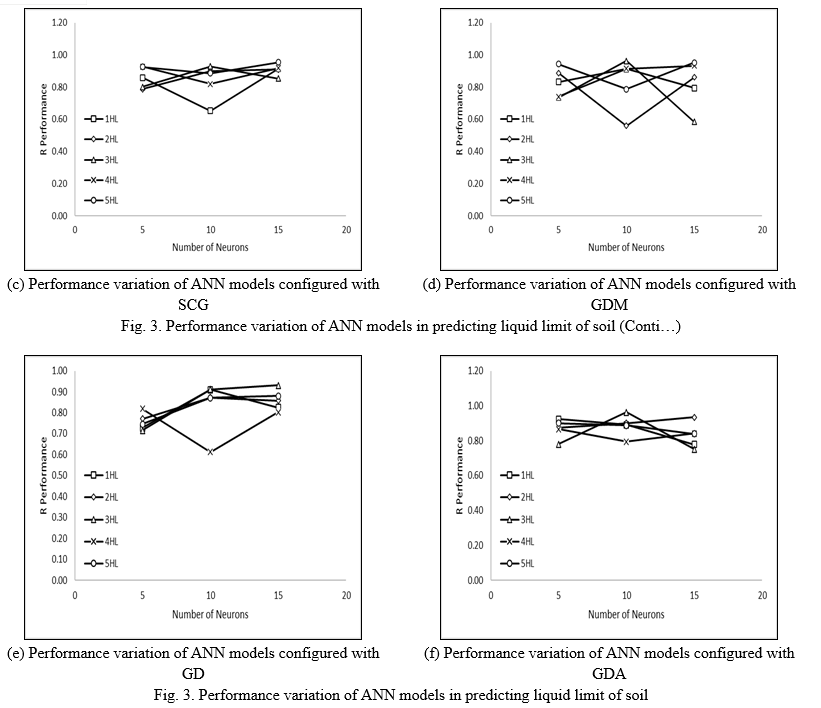
Figure 3 depicts the performance variation of the ANN models configured with different backpropagation algorithms in predicting the liquid limit of soil. From figure 3, it has been observed that the ten neurons are a transition point because the performance of models has been increased/ decreased for five and fifteen neurons in predicting the liquid limit of soil. LM, BFG, and SCG algorithm-based ANN models predict the LL liquid limit of soil with a performance of more than 0.9 with single hidden layers interconnected with 5/15 neurons which are highly acceptable. Two and four hidden layers interconnected with 5/15 neurons also achieve high performance and accuracy in predicting soil LL.
B. Prediction of Plasticity Index
For the prediction of plasticity index, the LM, BFG, SCG, GDA, GD, and GDM algorithm-based artificial neural network models have been evolved with a different number of hidden layers and neurons. The performance of the proposed models has been discussed below.
- Using Levenberg – Marquardt (LM) Algorithm Based Neural Network Models
Artificial neural networks have been developed to predict the PI of soil using the Levenberg-Marquardt algorithm. The performance of LM algorithm-based models is given in Table 12.
Table 12. Performance of LM Algorithm-based ANN models for plasticity index
|
Model ID |
HL/N |
Training |
Validation |
Testing |
||||||
|
RMSE |
R |
MAE |
RMSE |
R |
MAE |
RMSE |
R |
MAE |
||
|
Model 101 |
1/5 |
0.0799 |
0.9770 |
0.1035 |
0.0912 |
0.9705 |
0.0966 |
5.5340 |
0.6820 |
4.5076 |
|
Model 102 |
1/10 |
0.0839 |
0.9750 |
0.1241 |
0.0944 |
0.9659 |
0.1304 |
5.4425 |
0.7205 |
4.5462 |
|
Model 103 |
1/15 |
0.0583 |
0.9880 |
0.0873 |
0.1286 |
0.9427 |
0.0828 |
6.3183 |
0.6548 |
5.1714 |
|
Model 104 |
2/5 |
0.0825 |
0.9760 |
0.3336 |
0.0793 |
0.9747 |
0.2922 |
4.7786 |
0.7280 |
3.8122 |
|
Model 105 |
2/10 |
0.0784 |
0.9780 |
0.1635 |
0.0763 |
0.9812 |
0.1725 |
5.5471 |
0.6723 |
4.6031 |
|
Model 106 |
2/15 |
0.1039 |
0.9639 |
0.1117 |
0.1202 |
0.9465 |
0.1319 |
3.8893 |
0.8040 |
2.9756 |
|
Model 107 |
3/5 |
0.0637 |
0.9859 |
0.0636 |
0.1017 |
0.9617 |
0.6085 |
4.4313 |
0.7235 |
3.4384 |
|
Model 108 |
3/10 |
0.0722 |
0.9818 |
0.0523 |
0.0867 |
0.9691 |
0.0505 |
5.6716 |
0.6762 |
4.3043 |
|
Model 109 |
3/15 |
0.0609 |
0.9864 |
0.0922 |
0.0948 |
0.9668 |
0.0906 |
5.4437 |
0.6755 |
4.1551 |
|
Model 110 |
4/5 |
0.0647 |
0.9852 |
0.0940 |
0.0976 |
0.9627 |
0.1114 |
4.5131 |
0.7141 |
3.6722 |
|
Model 111 |
4/10 |
0.0739 |
0.9822 |
0.0601 |
0.1085 |
0.9556 |
0.0608 |
5.8621 |
0.5043 |
4.4188 |
|
Model 112 |
4/15 |
0.0819 |
0.9756 |
0.0660 |
0.1272 |
0.9615 |
0.0774 |
5.2393 |
0.6113 |
4.1574 |
|
Model 113 |
5/5 |
0.0776 |
0.9778 |
0.0919 |
0.1061 |
0.9652 |
0.0983 |
4.1764 |
0.7452 |
3.2607 |
|
Model 114 |
5/10 |
0.1160 |
0.9607 |
0.0653 |
0.0990 |
0.9637 |
0.0617 |
4.8778 |
0.6843 |
3.8869 |
|
Model 115 |
5/15 |
0.0655 |
0.9840 |
0.0645 |
0.1140 |
0.9569 |
0.0600 |
5.8719 |
0.6147 |
4.5207 |
From Table 12, it has been observed that the LM algorithm-based ANN model predicted the plasticity index of soil with a performance of 0.8040. However, it has also been observed that LM algorithm-based ANN models have not predicted PI with a performance of more than 0.90 because of the relationship between sand and fine content. The sand and fine content have a correlation coefficient of -0.6388 and 0.6285, respectively.
2. Using BFGs Quasi – Newton (BFG) Algorithm Based Neural Network Model
The artificial neural networks have been developed to predict the PI of soil using BFGs Quasi-Newton algorithm. The performance of BFG algorithm-based models is given in Table 13.
Table 13. Performance of BFG Algorithm-based ANN models for plasticity index
|
Model ID |
HL/N |
Training |
Validation |
Testing |
||||||
|
RMSE |
R |
MAE |
RMSE |
R |
MAE |
RMSE |
R |
MAE |
||
|
Model 116 |
1/5 |
0.0935 |
0.9701 |
0.0187 |
0.0892 |
0.9650 |
0.0201 |
4.9753 |
0.7455 |
3.8509 |
|
Model 117 |
1/10 |
0.0909 |
0.9734 |
0.1052 |
0.1199 |
0.9363 |
0.1119 |
5.2781 |
0.7248 |
4.2919 |
|
Model 118 |
1/15 |
0.0903 |
0.9739 |
0.3404 |
0.1085 |
0.9501 |
0.3699 |
4.0540 |
0.8136 |
3.6020 |
|
Model 119 |
2/5 |
0.0779 |
0.9765 |
0.0169 |
0.1049 |
0.9658 |
0.0240 |
5.2405 |
0.7193 |
4.2056 |
|
Model 120 |
2/10 |
0.2148 |
0.8252 |
0.8001 |
0.1829 |
0.8590 |
0.7908 |
4.7546 |
0.5132 |
3.3324 |
|
Model 121 |
2/15 |
0.1035 |
0.9609 |
0.0942 |
0.1256 |
0.9448 |
0.0931 |
5.5184 |
0.4683 |
3.9483 |
|
Model 122 |
3/5 |
0.0878 |
0.9713 |
0.0704 |
0.0698 |
0.9840 |
0.0696 |
5.1475 |
0.7375 |
4.2221 |
|
Model 123 |
3/10 |
0.1035 |
0.9591 |
0.1689 |
0.0907 |
0.9743 |
0.1703 |
4.0392 |
0.7668 |
3.3132 |
|
Model 124 |
3/15 |
0.0713 |
0.9817 |
0.0402 |
0.0934 |
0.9675 |
0.0476 |
5.5487 |
0.6159 |
4.2370 |
|
Model 125 |
4/5 |
0.0952 |
0.9641 |
0.0357 |
0.0976 |
0.9729 |
0.0495 |
4.8545 |
0.7606 |
3.9656 |
|
Model 126 |
4/10 |
0.0825 |
0.9733 |
0.0905 |
0.1079 |
0.9664 |
0.1012 |
4.4803 |
0.7581 |
3.8422 |
|
Model 127 |
4/15 |
0.0787 |
0.9796 |
0.1087 |
0.0907 |
0.9582 |
0.1086 |
5.4533 |
0.5946 |
4.0945 |
|
Model 128 |
5/5 |
0.0943 |
0.9671 |
0.0638 |
0.1213 |
0.9469 |
0.0677 |
5.0909 |
0.7280 |
4.3143 |
|
Model 129 |
5/10 |
0.0641 |
0.9856 |
0.0236 |
0.1226 |
0.9398 |
0.0408 |
5.3113 |
0.6075 |
4.0433 |
|
Model 130 |
5/15 |
0.0970 |
0.9650 |
0.2262 |
0.1104 |
0.9571 |
0.2225 |
5.1203 |
0.6536 |
4.2295 |
From Table 13, it has been observed that the BFG algorithm-based ANN model predicted the plasticity index of soil with a performance of 0.8136. Therefore, it may be stated that the BFG algorithm-based ANN model (1/15) predicts the plasticity index of soil better than the LM algorithm-based ANN model (2/15).
3. Using Scaled Conjugate Gradient (SCG) Algorithm Based Neural Network Models
Artificial neural networks have been developed to predict the PI of soil using the SCG algorithm. The performance of SCG algorithm-based models is given in Table 14.
Table 14. Performance of SCG Algorithm-based ANN models for plasticity index
|
Model ID |
HL/N |
Training |
Validation |
Testing |
||||||
|
RMSE |
R |
MAE |
RMSE |
R |
MAE |
RMSE |
R |
MAE |
||
|
Model 131 |
1/5 |
0.1134 |
0.9530 |
0.0401 |
0.1116 |
0.9543 |
0.0376 |
5.3133 |
0.7383 |
4.1421 |
|
Model 132 |
1/10 |
0.0996 |
0.9632 |
0.0745 |
0.1122 |
0.9586 |
0.0740 |
5.2070 |
0.7598 |
4.2620 |
|
Model 133 |
1/15 |
0.1527 |
0.9153 |
0.0734 |
0.1631 |
0.9160 |
0.0667 |
4.4898 |
0.7870 |
3.6426 |
|
Model 134 |
2/5 |
0.1042 |
0.9594 |
0.0377 |
0.0889 |
0.9741 |
0.0395 |
6.1795 |
0.6507 |
5.0980 |
|
Model 135 |
2/10 |
0.0963 |
0.9648 |
0.0303 |
0.0893 |
0.9739 |
0.0299 |
5.4668 |
0.6314 |
4.2369 |
|
Model 136 |
2/15 |
0.1088 |
0.9550 |
0.1768 |
0.1287 |
0.9445 |
0.1912 |
6.3156 |
0.5099 |
4.6700 |
|
Model 137 |
3/5 |
0.1177 |
0.9518 |
0.0435 |
0.0954 |
0.9627 |
0.0433 |
4.3151 |
0.7152 |
3.4263 |
|
Model 138 |
3/10 |
0.1349 |
0.9304 |
0.1242 |
0.1601 |
0.9034 |
0.1175 |
5.0833 |
0.6563 |
4.0188 |
|
Model 139 |
3/15 |
0.0966 |
0.9667 |
0.0575 |
0.1151 |
0.9487 |
0.0615 |
5.2317 |
0.5974 |
4.3147 |
|
Model 140 |
4/5 |
0.1052 |
0.9586 |
0.0477 |
0.1124 |
0.9574 |
0.0523 |
4.9502 |
0.6578 |
3.7365 |
|
Model 141 |
4/10 |
0.1108 |
0.9546 |
0.0776 |
0.1378 |
0.9305 |
0.0730 |
4.4070 |
0.5932 |
3.0585 |
|
Model 142 |
4/15 |
0.1199 |
0.9432 |
0.2529 |
0.1401 |
0.9379 |
0.2662 |
4.3419 |
0.7153 |
3.4916 |
|
Model 143 |
5/5 |
0.1234 |
0.9436 |
0.0522 |
0.1188 |
0.9514 |
0.0526 |
6.1962 |
0.5843 |
4.9523 |
|
Model 144 |
5/10 |
0.0888 |
0.9735 |
0.0409 |
0.0606 |
0.9836 |
0.0384 |
5.2205 |
0.6406 |
4.3422 |
|
Model 145 |
5/15 |
0.0830 |
0.9756 |
0.0334 |
0.1017 |
0.9604 |
0.0377 |
4.7150 |
0.7059 |
3.7745 |
From Table 13, it has been observed that the SCG algorithm-based ANN model predicted the plasticity index of soil with a performance of 0.7870. It has also been observed that SCG algorithm-based ANN models require strongly correlated sand and fine content with PI.
4. Using Gradient Descent with Momentum (GDM) Algorithm Based Neural Network Models
Artificial neural networks have been developed to predict the PI of soil using the GDM algorithm. The performance of GDM algorithm-based models is given in Table 15.
Table 15. Performance of GDM Algorithm-based ANN models for plasticity index
|
Model ID |
HL/N |
Training |
Validation |
Testing |
||||||
|
RMSE |
R |
MAE |
RMSE |
R |
MAE |
RMSE |
R |
MAE |
||
|
Model 146 |
1/5 |
0.1275 |
0.9341 |
0.0315 |
0.1597 |
0.9210 |
0.0410 |
5.8063 |
0.5329 |
4.3796 |
|
Model 147 |
1/10 |
0.2056 |
0.8588 |
0.1252 |
0.1745 |
0.8292 |
0.0922 |
5.5386 |
0.4632 |
4.0688 |
|
Model 148 |
1/15 |
0.1609 |
0.9108 |
0.0493 |
0.1841 |
0.8824 |
0.0579 |
6.2310 |
0.7868 |
4.9162 |
|
Model 149 |
2/5 |
0.1792 |
0.8735 |
0.0528 |
0.2163 |
0.8207 |
0.0748 |
5.5847 |
0.4952 |
3.9170 |
|
Model 150 |
2/10 |
0.4208 |
0.6620 |
0.8106 |
0.4382 |
0.5575 |
0.8466 |
6.4502 |
0.3498 |
5.7947 |
|
Model 151 |
2/15 |
0.4506 |
0.6964 |
1.0730 |
0.3700 |
0.7432 |
1.0210 |
7.4952 |
0.6257 |
6.2392 |
|
Model 152 |
3/5 |
0.1965 |
0.8559 |
0.0636 |
0.1962 |
0.8335 |
0.0639 |
3.2702 |
0.8634 |
2.8181 |
|
Model 153 |
3/10 |
0.1490 |
0.9122 |
0.0389 |
0.1624 |
0.9082 |
0.0367 |
4.0890 |
0.7743 |
3.2545 |
|
Model 154 |
3/15 |
0.4209 |
0.6295 |
0.6229 |
0.3634 |
0.6984 |
0.5678 |
5.9679 |
0.6241 |
4.7362 |
|
Model 155 |
4/5 |
0.2241 |
0.7920 |
0.0769 |
0.2295 |
0.8039 |
0.0971 |
4.3599 |
0.4138 |
3.1822 |
|
Model 156 |
4/10 |
0.1617 |
0.8922 |
0.0424 |
0.1898 |
0.8911 |
0.0484 |
3.7304 |
0.7417 |
2.8517 |
|
Model 157 |
4/15 |
0.1852 |
0.8700 |
0.0487 |
0.1640 |
0.8941 |
0.0432 |
4.4936 |
0.6526 |
3.2588 |
|
Model 158 |
5/5 |
0.2124 |
0.8351 |
0.0547 |
0.2174 |
0.7880 |
0.0559 |
3.8733 |
0.7155 |
2.9629 |
|
Model 159 |
5/10 |
0.1314 |
0.9381 |
0.0230 |
0.1403 |
0.9156 |
0.0285 |
5.9709 |
0.5926 |
4.7706 |
|
Model 160 |
5/15 |
0.3055 |
0.7717 |
0.1800 |
0.2556 |
0.8153 |
0.2205 |
6.9119 |
0.5209 |
6.0766 |
From Table 15, it has been observed that the GDM algorithm-based ANN model predicted the plasticity index of soil with a performance of 0.8634. Therefore, it can be stated that the GDM algorithm-based ANN model (3/5) predicts the plasticity index of soil better than the LM, BFG, and SCG algorithm-based ANN model.
5. Using Gradient Descent (GD) Algorithm Based Neural Network Models
Artificial neural networks have been developed to predict the PI of soil using the GD algorithm. The performance of GD algorithm-based models is given in Table 16.
Table 16. Performance of GD Algorithm-based ANN models for plasticity index
|
Model ID |
HL/N |
Training |
Validation |
Testing |
||||||
|
RMSE |
R |
MAE |
RMSE |
R |
MAE |
RMSE |
R |
MAE |
||
|
Model 161 |
1/5 |
0.1685 |
0.8932 |
0.0491 |
0.1963 |
0.8474 |
0.0615 |
3.5745 |
0.7395 |
2.7924 |
|
Model 162 |
1/10 |
0.2333 |
0.7942 |
0.1062 |
0.2269 |
0.7747 |
0.1036 |
4.5789 |
0.6249 |
3.5532 |
|
Model 163 |
1/15 |
0.1426 |
0.9262 |
0.0391 |
0.1605 |
0.9173 |
0.0504 |
6.3462 |
0.5045 |
4.9682 |
|
Model 164 |
2/5 |
0.2320 |
0.7730 |
0.0954 |
0.2225 |
0.8363 |
0.1084 |
3.9751 |
0.7387 |
2.9780 |
|
Model 165 |
2/10 |
0.1529 |
0.9077 |
0.0474 |
0.1591 |
0.9146 |
0.0545 |
4.7277 |
0.6081 |
3.2716 |
|
Model 166 |
2/15 |
0.1882 |
0.8487 |
0.0741 |
0.1867 |
0.8967 |
0.0702 |
4.0714 |
0.6305 |
3.2137 |
|
Model 167 |
3/5 |
0.1632 |
0.8955 |
0.0622 |
0.1665 |
0.9034 |
0.0700 |
2.8608 |
0.8266 |
2.1785 |
|
Model 168 |
3/10 |
0.1772 |
0.8690 |
0.0635 |
0.2010 |
0.8762 |
0.0722 |
4.8797 |
0.4923 |
3.6017 |
|
Model 169 |
3/15 |
0.1559 |
0.9066 |
0.0594 |
0.1827 |
0.8737 |
0.0911 |
6.4048 |
0.3190 |
4.4622 |
|
Model 170 |
4/5 |
0.1675 |
0.8930 |
0.0666 |
0.1434 |
0.9241 |
0.0619 |
5.3178 |
0.5393 |
4.3517 |
|
Model 171 |
4/10 |
0.2106 |
0.8217 |
0.0626 |
0.2136 |
0.8223 |
0.0628 |
4.7407 |
0.6330 |
3.6126 |
|
Model 172 |
4/15 |
0.1516 |
0.9126 |
0.0377 |
0.2133 |
0.8217 |
0.0662 |
3.6665 |
0.6589 |
2.2443 |
|
Model 173 |
5/5 |
0.1977 |
0.8387 |
0.0708 |
0.2096 |
0.8487 |
0.0775 |
5.6564 |
0.4076 |
3.8573 |
|
Model 174 |
5/10 |
0.1786 |
0.8695 |
0.0644 |
0.2069 |
0.8474 |
0.0830 |
4.1612 |
0.5799 |
3.1377 |
|
Model 175 |
5/15 |
0.1607 |
0.9078 |
0.0500 |
0.1554 |
0.8942 |
0.0457 |
4.3096 |
0.6299 |
2.9803 |
From Table 16, it has been observed that the GD algorithm-based ANN model has predicted the plasticity index of soil with the performance of 0.8266. Therefore, it can be stated that the GD algorithm-based ANN model (3/5) predicts the plasticity index of soil better than the LM, BFG, and SCG algorithm-based ANN model.
6. Using Gradient Descent Algorithm with Adaptive Learning (GDA) Based Neural Network Model
Artificial neural networks have been developed to predict the PI of soil using the GDA algorithm. The performance of GDA algorithm-based models is given in Table 17.
Table 17. Performance of GDA Algorithm-based ANN models for plasticity index
|
Model ID |
HL/N |
Training |
Validation |
Testing |
||||||
|
RMSE |
R |
MAE |
RMSE |
R |
MAE |
RMSE |
R |
MAE |
||
|
Model 176 |
1/5 |
0.2440 |
0.7465 |
0.1692 |
0.2618 |
0.7436 |
0.1945 |
5.2705 |
0.4981 |
3.7032 |
|
Model 177 |
1/10 |
0.1551 |
0.9139 |
0.3170 |
0.1644 |
0.8905 |
0.2432 |
5.2917 |
0.6726 |
4.4011 |
|
Model 178 |
1/15 |
0.2018 |
0.8768 |
0.2652 |
0.1827 |
0.8731 |
0.2668 |
5.1596 |
0.5690 |
4.0081 |
|
Model 179 |
2/5 |
0.1436 |
0.9250 |
0.1544 |
0.1390 |
0.9275 |
0.1423 |
4.1891 |
0.6730 |
3.3252 |
|
Model 180 |
2/10 |
0.1677 |
0.9034 |
0.1316 |
0.1418 |
0.9297 |
0.1126 |
3.2423 |
0.7988 |
2.4588 |
|
Model 181 |
2/15 |
0.1424 |
0.9287 |
0.1842 |
0.1386 |
0.9138 |
0.1584 |
3.7145 |
0.7413 |
2.9625 |
|
Model 182 |
3/5 |
0.1583 |
0.9108 |
0.0454 |
0.1350 |
0.9213 |
0.0370 |
3.3477 |
0.7436 |
2.5612 |
|
Model 183 |
3/10 |
0.1744 |
0.8935 |
0.0768 |
0.1975 |
0.8265 |
0.0849 |
4.1701 |
0.7038 |
3.1721 |
|
Model 184 |
3/15 |
0.1276 |
0.9424 |
0.1979 |
0.1336 |
0.9307 |
0.1958 |
3.9659 |
0.8136 |
3.3663 |
|
Model 185 |
4/5 |
0.2025 |
0.8492 |
0.1367 |
0.1734 |
0.8717 |
0.1174 |
5.7265 |
0.3395 |
4.2076 |
|
Model 186 |
4/10 |
0.1334 |
0.9331 |
0.0631 |
0.1648 |
0.9027 |
0.0729 |
3.5543 |
0.7998 |
2.9269 |
|
Model 187 |
4/15 |
0.1688 |
0.9002 |
0.0790 |
0.1402 |
0.9137 |
0.0671 |
5.0080 |
0.6400 |
4.2041 |
|
Model 188 |
5/5 |
0.1438 |
0.9269 |
0.1962 |
0.1335 |
0.9238 |
0.1725 |
3.9148 |
0.7363 |
3.3099 |
|
Model 189 |
5/10 |
0.2122 |
0.8335 |
0.2008 |
0.2096 |
0.7989 |
0.1711 |
5.6389 |
0.3715 |
3.8897 |
|
Model 190 |
5/15 |
0.1519 |
0.9128 |
0.0545 |
0.1604 |
0.9174 |
0.0668 |
5.8969 |
0.3584 |
4.2640 |
From Table 17, it has been observed that the GDA algorithm-based ANN model has predicted the plasticity index of soil with a performance of 0.8136. Therefore, it can be stated that the GD algorithm-based ANN model (3/15) predicts the plasticity index of soil better than the LM and SCG algorithm-based ANN models.
The performance variation of ANN models configured with different backpropagation algorithms for predicting soil plasticity index has been mapped, as shown in Fig. 4.
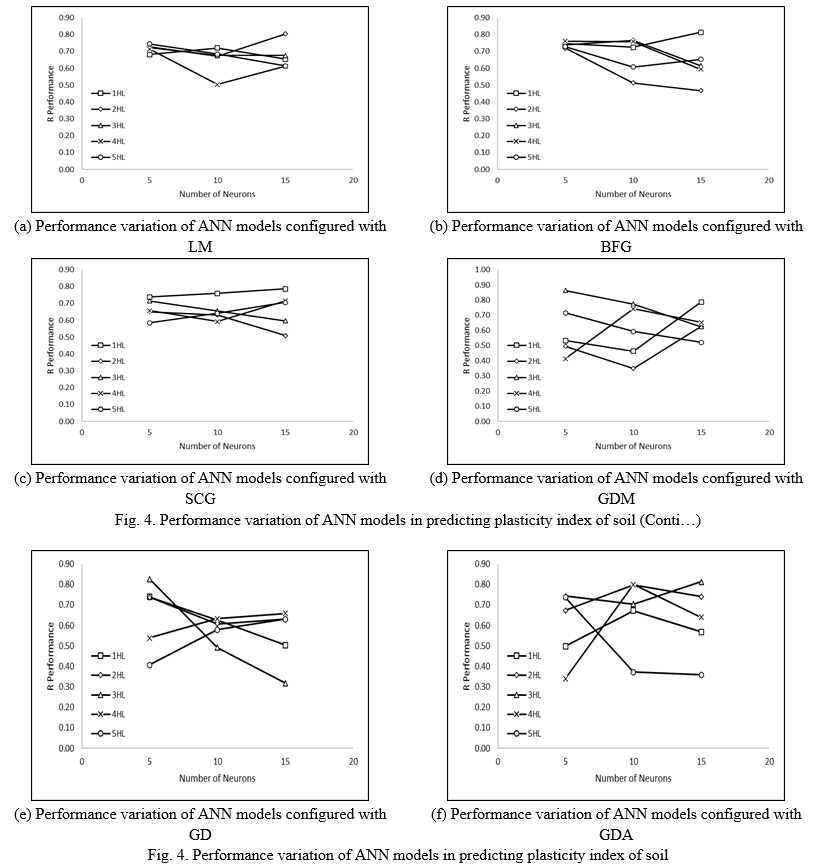
Fig. 4 depicts the performance variation of ANN models configured with different backpropagation algorithms in predicting the plasticity index of soil. The same pattern is mapped in the performance variation of ANN models in predicting soil plasticity index. In a few cases, the performance of ANN models has continuously decreased in predicting the plasticity index. On the other hand, the maximum performance has been achieved by GDM algorithm-based ANN models in predicting the plasticity index of soil. Therefore, it may be stated that the GDM achieves better performance with a strongly correlated pair of datasets.
C. Prediction of Optimum Moisture Content
The LM, BFG, SCG, GDA, GD, and GDM algorithm-based artificial neural network models have evolved with many hidden layers and neurons to predict optimum moisture content. The performance of the proposed models has been discussed below.
- Using Levenberg – Marquardt (LM) Algorithm Based Neural Network Models
The artificial neural networks have been developed to predict the OMC of soil using the LM algorithm. The performance of LM algorithm-based models is given in Table 18.
Table 18. Performance of LM Algorithm-based ANN models for optimum moisture content
|
Model ID |
HL/N |
Training |
Validation |
Testing |
||||||
|
RMSE |
R |
MAE |
RMSE |
R |
MAE |
RMSE |
R |
MAE |
||
|
Model 201 |
1/5 |
0.0605 |
0.9706 |
0.0230 |
0.0610 |
0.9623 |
0.0263 |
1.5358 |
0.9822 |
1.1660 |
|
Model 202 |
1/10 |
0.0669 |
0.9722 |
0.0642 |
0.0736 |
0.9624 |
0.0903 |
2.4959 |
0.9721 |
1.7462 |
|
Model 203 |
1/15 |
0.0562 |
0.9731 |
0.0131 |
0.0642 |
0.9666 |
0.0158 |
1.9915 |
0.9629 |
1.3352 |
|
Model 204 |
2/5 |
0.0558 |
0.9746 |
0.0066 |
0.0604 |
0.9662 |
0.0064 |
2.2406 |
0.9531 |
1.3220 |
|
Model 205 |
2/10 |
0.0464 |
0.9823 |
0.0186 |
0.0860 |
0.9515 |
0.0228 |
2.3150 |
0.9656 |
1.3379 |
|
Model 206 |
2/15 |
0.0456 |
0.9824 |
0.0124 |
0.0724 |
0.9601 |
0.0186 |
2.2340 |
0.9401 |
1.5465 |
|
Model 207 |
3/5 |
0.0619 |
0.9695 |
0.0154 |
0.0666 |
0.9602 |
0.0171 |
2.4152 |
0.9527 |
1.6730 |
|
Model 208 |
3/10 |
0.0713 |
0.9623 |
0.0125 |
0.0660 |
0.9662 |
0.0127 |
2.3889 |
0.9552 |
2.0151 |
|
Model 209 |
3/15 |
0.0523 |
0.9775 |
0.0256 |
0.0867 |
0.9345 |
0.0272 |
1.6212 |
0.9553 |
1.4029 |
|
Model 210 |
4/5 |
0.0722 |
0.9531 |
0.0665 |
0.0784 |
0.9559 |
0.0744 |
1.6893 |
0.9509 |
1.2188 |
|
Model 211 |
4/10 |
0.0468 |
0.9790 |
0.0692 |
0.0812 |
0.9560 |
0.0718 |
1.8736 |
0.9632 |
1.3584 |
|
Model 212 |
4/15 |
0.0394 |
0.9869 |
0.0401 |
0.0655 |
0.9635 |
0.0542 |
2.5502 |
0.8963 |
1.8446 |
|
Model 213 |
5/5 |
0.0529 |
0.9772 |
0.0112 |
0.0763 |
0.9561 |
0.0155 |
2.7043 |
0.9745 |
1.5588 |
|
Model 214 |
5/10 |
0.0373 |
0.9889 |
0.0574 |
0.0820 |
0.9408 |
0.0600 |
1.8102 |
0.9715 |
1.4766 |
|
Model 215 |
5/15 |
0.0458 |
0.9841 |
0.4867 |
0.0780 |
0.9453 |
0.4955 |
1.8096 |
0.9387 |
1.2529 |
From Table 18, it has been observed that the performance of LM algorithm-based ANN models has been increased with the increasing number of hidden layers and neurons. The performance of two hidden layers-based models has been increased for two hidden layers interconnected with ten neurons, i.e., 0.9656. Similarly, the performance of the three hidden layers-based models has been increased for three hidden layers interconnected with 15 neurons, i.e., 0.9553. All LM algorithm-based ANN models predicted optimum moisture content with a performance of greater than 0.95 because of the correlation coefficient between input parameters (S, FC, & PL strongly correlated, and LL & PI very strongly correlated) and optimum moisture content.
2. Using BFGs Quasi – Newton (BFG) Algorithm Based Neural Network Models
Artificial neural networks have been developed to predict the OMC of soil using the BFG algorithm. The performance of BFG algorithm-based models is given in Table 19.
Table 19. Performance of BFG Algorithm-based ANN models for optimum moisture content
|
Model ID |
HL/N |
Training |
Validation |
Testing |
||||||
|
RMSE |
R |
MAE |
RMSE |
R |
MAE |
RMSE |
R |
MAE |
||
|
Model 216 |
1/5 |
0.0715 |
0.9536 |
0.0410 |
0.0726 |
0.9612 |
0.0410 |
2.9144 |
0.8917 |
2.1400 |
|
Model 217 |
1/10 |
0.0668 |
0.9611 |
0.0170 |
0.0752 |
0.9567 |
0.0179 |
1.7998 |
0.9545 |
1.4806 |
|
Model 218 |
1/15 |
0.0708 |
0.9550 |
0.0221 |
0.0823 |
0.9508 |
0.0222 |
2.1371 |
0.9071 |
1.6924 |
|
Model 219 |
2/5 |
0.0738 |
0.9508 |
0.0238 |
0.0727 |
0.9585 |
0.0261 |
1.7524 |
0.9351 |
1.4130 |
|
Model 220 |
2/10 |
0.0568 |
0.9740 |
0.0097 |
0.0652 |
0.9574 |
0.0098 |
1.4624 |
0.9786 |
1.0831 |
|
Model 221 |
2/15 |
0.0529 |
0.9787 |
0.0625 |
0.0910 |
0.9025 |
0.0675 |
2.2724 |
0.9172 |
1.8292 |
|
Model 222 |
3/5 |
0.0678 |
0.9617 |
0.0268 |
0.0689 |
0.9580 |
0.0258 |
1.4354 |
0.9580 |
1.2417 |
|
Model 223 |
3/10 |
0.0867 |
0.9389 |
0.1075 |
0.0838 |
0.9420 |
0.1082 |
2.0696 |
0.9201 |
1.6577 |
|
Model 224 |
3/15 |
0.0792 |
0.9527 |
0.0855 |
0.0823 |
0.9177 |
0.0813 |
2.8382 |
0.8921 |
2.1297 |
|
Model 225 |
4/5 |
0.0734 |
0.9547 |
0.0165 |
0.0757 |
0.9498 |
0.0167 |
1.4980 |
0.9621 |
1.2470 |
|
Model 226 |
4/10 |
0.0622 |
0.9665 |
0.0191 |
0.0671 |
0.9651 |
0.0209 |
1.4774 |
0.9646 |
1.1394 |
|
Model 227 |
4/15 |
0.0647 |
0.9648 |
0.0339 |
0.0748 |
0.9529 |
0.0417 |
1.5236 |
0.9647 |
1.2510 |
|
Model 228 |
5/5 |
0.0735 |
0.9574 |
0.1000 |
0.0785 |
0.9365 |
0.0955 |
1.8488 |
0.9317 |
1.5298 |
|
Model 229 |
5/10 |
0.0877 |
0.9381 |
0.1304 |
0.1044 |
0.8863 |
0.1319 |
2.3121 |
0.8919 |
1.6981 |
|
Model 230 |
5/15 |
0.0729 |
0.9511 |
0.0741 |
0.0788 |
0.9547 |
0.0720 |
2.1630 |
0.8979 |
1.6666 |
Table 19 shows that the BFG algorithm-based ANN models predict the optimum moisture content with a performance of more than 0.85. It has also been observed that the BFG algorithm-based ANN models require two or four hidden layers with ten neurons to achieve a performance of more than 0.96. Model 220 outperformed the other BFG algorithm-based ANN models in predicting optimum moisture content.
3. Using Scaled Conjugate Gradient (SCG) Algorithm Based Neural Network Models
The artificial neural networks have been developed to predict the OMC of soil using the SCG algorithm. The performance of SCG algorithm-based models is given in Table 20.
Table 20. Performance of SCG Algorithm-based ANN models for optimum moisture content
|
Model ID |
HL/N |
Training |
Validation |
Testing |
||||||
|
RMSE |
R |
MAE |
RMSE |
R |
MAE |
RMSE |
R |
MAE |
||
|
Model 231 |
1/5 |
0.0678 |
0.9615 |
0.0485 |
0.0674 |
0.9584 |
0.0474 |
1.4750 |
0.9741 |
1.2795 |
|
Model 232 |
1/10 |
0.0678 |
0.9604 |
0.0201 |
0.0937 |
0.9269 |
0.0233 |
3.0644 |
0.9002 |
2.0679 |
|
Model 233 |
1/15 |
0.0662 |
0.9590 |
0.0483 |
0.0637 |
0.9720 |
0.0461 |
1.5230 |
0.9789 |
1.2279 |
|
Model 234 |
2/5 |
0.0674 |
0.9548 |
0.0220 |
0.0647 |
0.9726 |
0.0275 |
1.2389 |
0.9750 |
0.9399 |
|
Model 235 |
2/10 |
0.0597 |
0.9664 |
0.0241 |
0.0712 |
0.9642 |
0.0322 |
2.1166 |
0.9561 |
1.5072 |
|
Model 236 |
2/15 |
0.0617 |
0.9695 |
0.0344 |
0.0755 |
0.9446 |
0.0336 |
2.2469 |
0.9172 |
1.6116 |
|
Model 237 |
3/5 |
0.0593 |
0.9714 |
0.0153 |
0.0626 |
0.9630 |
0.0157 |
1.3359 |
0.9693 |
1.1181 |
|
Model 238 |
3/10 |
0.0546 |
0.9714 |
0.0183 |
0.0755 |
0.9668 |
0.0237 |
3.1326 |
0.8816 |
1.5863 |
|
Model 239 |
3/15 |
0.0875 |
0.9358 |
0.2965 |
0.1079 |
0.8932 |
0.3150 |
2.4866 |
0.8813 |
1.9214 |
|
Model 240 |
4/5 |
0.0862 |
0.9384 |
0.0259 |
0.0721 |
0.9530 |
0.0243 |
1.8769 |
0.9250 |
1.4832 |
|
Model 241 |
4/10 |
0.0749 |
0.9523 |
0.0155 |
0.0955 |
0.9310 |
0.0257 |
2.0971 |
0.9782 |
1.7799 |
|
Model 242 |
4/15 |
0.0628 |
0.9654 |
0.0212 |
0.0715 |
0.9590 |
0.0232 |
1.9577 |
0.9284 |
1.5763 |
|
Model 243 |
5/5 |
0.0779 |
0.9506 |
0.0617 |
0.0775 |
0.9402 |
0.0661 |
3.5013 |
0.8829 |
2.3629 |
|
Model 244 |
5/10 |
0.0679 |
0.9586 |
0.0289 |
0.0785 |
0.9532 |
0.0344 |
1.7440 |
0.9598 |
1.5105 |
|
Model 245 |
5/15 |
0.0686 |
0.9584 |
0.0710 |
0.0842 |
0.9447 |
0.0740 |
1.4522 |
0.9557 |
1.0662 |
Table 20 shows that Model 233 outperformed the other SCG algorithm-based ANN models in predicting the OMC of soil. However, table 20 also indicates that the performance of the SCG algorithm-based ANN model has been decreased with increasing the number of hidden layers.
4. Using Gradient Descent with Momentum (GDM) Algorithm Based Neural Network Models
Artificial neural networks have been developed to predict the OMC of soil using the GDM algorithm. The performance of GDM algorithm-based models is given in Table 21.
Table 21. Performance of GDM Algorithm-based ANN models for optimum moisture content
|
Model ID |
HL/N |
Training |
Validation |
Testing |
||||||
|
RMSE |
R |
MAE |
RMSE |
R |
MAE |
RMSE |
R |
MAE |
||
|
Model 246 |
1/5 |
0.1284 |
0.9370 |
0.0229 |
0.1379 |
0.9702 |
0.0274 |
2.5919 |
0.8718 |
1.8263 |
|
Model 247 |
1/10 |
0.1075 |
0.8982 |
0.0234 |
0.1178 |
0.8935 |
0.0236 |
3.9374 |
0.7318 |
3.2326 |
|
Model 248 |
1/15 |
0.1378 |
0.8213 |
0.0530 |
0.1846 |
0.7386 |
0.0664 |
3.9058 |
0.6097 |
3.2454 |
|
Model 249 |
2/5 |
0.0958 |
0.9241 |
.0.2264 |
0.0765 |
0.9489 |
0.0165 |
2.1606 |
0.9010 |
1.7428 |
|
Model 250 |
2/10 |
0.1163 |
0.8839 |
0.0399 |
0.1780 |
0.7857 |
0.0600 |
3.3881 |
0.7874 |
2.4571 |
|
Model 251 |
2/15 |
0.0986 |
0.9163 |
0.0235 |
0.1017 |
0.9046 |
0.0235 |
2.0266 |
0.9284 |
1.6979 |
|
Model 252 |
3/5 |
0.1202 |
0.8660 |
0.0239 |
0.1136 |
0.8966 |
0.0223 |
2.1769 |
0.9416 |
1.7989 |
|
Model 253 |
3/10 |
0.0965 |
0.9107 |
0.0226 |
0.1085 |
0.9170 |
0.0323 |
2.3178 |
0.8995 |
1.9568 |
|
Model 254 |
3/15 |
0.2845 |
0.8126 |
0.3002 |
0.2883 |
0.8191 |
0.2870 |
3.7777 |
0.7643 |
2.5276 |
|
Model 255 |
4/5 |
0.1293 |
0.8465 |
0.0238 |
0.1463 |
0.8069 |
0.0274 |
2.3765 |
0.9150 |
1.9466 |
|
Model 256 |
4/10 |
0.0872 |
0.9353 |
0.0152 |
0.0930 |
0.9225 |
0.0150 |
2.5965 |
0.8977 |
1.9193 |
|
Model 257 |
4/15 |
0.2345 |
0.8597 |
0.2320 |
0.2467 |
0.7845 |
0.2468 |
3.2685 |
0.8848 |
2.5851 |
|
Model 258 |
5/5 |
0.1515 |
0.7726 |
0.0404 |
0.1533 |
0.8334 |
0.0448 |
3.7520 |
0.8194 |
3.3550 |
|
Model 259 |
5/10 |
0.0928 |
0.9212 |
0.0151 |
0.1199 |
0.8959 |
0.0230 |
2.5180 |
0.8914 |
2.1143 |
|
Model 260 |
5/15 |
0.1604 |
0.7499 |
0.3260 |
0.1525 |
0.7977 |
0.3020 |
2.9102 |
0.8415 |
2.4376 |
From Table 21, it has been observed that the performance of the GDM algorithm-based ANN model has been increased up to three hidden layers. On the other hand, the performance of GDM models has been decreasing with increasing the number of hidden layers in the prediction of OMC.
5. Using Gradient Descent (GD) Algorithm Based Neural Network Models
The artificial neural networks have been developed to predict the OMC of soil using the GD algorithm. The performance of GD algorithm-based models is given in Table 22.
Table 22. Performance of GD Algorithm-based ANN models for optimum moisture content
|
Model ID |
HL/N |
Training |
Validation |
Testing |
||||||
|
RMSE |
R |
MAE |
RMSE |
R |
MAE |
RMSE |
R |
MAE |
||
|
Model 261 |
1/5 |
0.1087 |
0.8969 |
0.0318 |
0.1415 |
0.8219 |
0.0417 |
3.0967 |
0.8560 |
2.5154 |
|
Model 262 |
1/10 |
0.1234 |
0.8701 |
0.0273 |
0.1241 |
0.8705 |
0.0223 |
3.3938 |
0.8091 |
2.4948 |
|
Model 263 |
1/15 |
0.1279 |
0.8785 |
0.0630 |
0.1274 |
0.8921 |
0.0725 |
3.6624 |
0.8819 |
2.7955 |
|
Model 264 |
2/5 |
0.0999 |
0.9078 |
0.0381 |
0.1199 |
0.8850 |
0.0406 |
3.4192 |
0.8731 |
2.4869 |
|
Model 265 |
2/10 |
0.1365 |
0.8394 |
0.0328 |
0.1299 |
0.8244 |
0.0287 |
2.2094 |
0.9353 |
1.7116 |
|
Model 266 |
2/15 |
0.1088 |
0.9051 |
0.0491 |
0.1030 |
0.9049 |
0.0365 |
3.2638 |
0.7712 |
2.3701 |
|
Model 267 |
3/5 |
0.1250 |
0.8614 |
0.0318 |
0.1321 |
0.7945 |
0.0288 |
2.8298 |
0.8505 |
2.2730 |
|
Model 268 |
3/10 |
0.0896 |
0.9345 |
0.0164 |
0.1235 |
0.8697 |
0.0232 |
2.7791 |
0.8942 |
1.6670 |
|
Model 269 |
3/15 |
0.0876 |
0.9402 |
0.0157 |
0.0956 |
0.8952 |
0.0198 |
2.0383 |
0.9345 |
1.5937 |
|
Model 270 |
4/5 |
0.1792 |
0.6910 |
0.0684 |
0.1633 |
0.7299 |
0.0633 |
3.5938 |
0.7817 |
3.1359 |
|
Model 271 |
4/10 |
0.0913 |
0.9259 |
0.0214 |
0.0907 |
0.9324 |
0.0213 |
3.3093 |
0.8569 |
2.8472 |
|
Model 272 |
4/15 |
0.0874 |
0.9339 |
0.0133 |
0.0968 |
0.9229 |
0.0157 |
1.8525 |
0.9316 |
1.4624 |
|
Model 273 |
5/5 |
0.1201 |
0.8708 |
0.0458 |
0.1412 |
0.8239 |
0.0534 |
2.0147 |
0.9300 |
1.6181 |
|
Model 274 |
5/10 |
0.1235 |
0.8681 |
0.0294 |
0.1417 |
0.7971 |
0.0300 |
3.0886 |
0.8084 |
2.6045 |
|
Model 275 |
5/15 |
0.0779 |
0.9467 |
0.0114 |
0.0890 |
0.9365 |
0.0140 |
2.6987 |
0.9137 |
2.0070 |
From Table 22, it has been observed that the performance of GD algorithm-based ANN models has been started increasing up to two hidden layers. Therefore, the ANN model of two hidden layers interconnected with ten neurons has been identified as a better performance model. However, from Table 22, it has also been observed that the performance of GD ANN models decreased with hidden layers after two layers in predicting the OMC of soil.
6. Using Gradient Descent Algorithm with Adaptive Learning (GDA) Based Neural Network Models
The artificial neural networks have been developed to predict the OMC of soil using the GDA algorithm. The performance of GDA algorithm-based models is given in Table 23.
Table 23. Performance of GDA Algorithm-based ANN models for optimum moisture content
|
Model ID |
HL/N |
Training |
Validation |
Testing |
||||||
|
RMSE |
R |
MAE |
RMSE |
R |
MAE |
RMSE |
R |
MAE |
||
|
Model 276 |
1/5 |
0.0801 |
0.9477 |
0.0582 |
0.0951 |
0.9336 |
0.0760 |
1.7522 |
0.9437 |
1.3095 |
|
Model 277 |
1/10 |
0.0884 |
0.9361 |
0.0689 |
0.0864 |
0.9250 |
0.0727 |
3.8420 |
0.8210 |
3.1291 |
|
Model 278 |
1/15 |
0.0943 |
0.9235 |
0.0472 |
0.1352 |
0.8492 |
0.0442 |
2.8842 |
0.8203 |
2.1718 |
|
Model 279 |
2/5 |
0.1035 |
0.9122 |
0.0569 |
0.1037 |
0.8989 |
0.0651 |
3.1994 |
0.7596 |
2.5478 |
|
Model 280 |
2/10 |
0.0848 |
0.9339 |
0.0239 |
0.0896 |
0.9467 |
0.0317 |
1.5136 |
0.9515 |
1.1409 |
|
Model 281 |
2/15 |
0.1184 |
0.8983 |
0.0363 |
0.1111 |
0.8853 |
0.0363 |
5.2495 |
0.5519 |
3.5770 |
|
Model 282 |
3/5 |
0.0910 |
0.9299 |
0.0331 |
0.0975 |
0.9212 |
0.0351 |
2.2330 |
0.9249 |
1.8035 |
|
Model 283 |
3/10 |
0.0964 |
0.9293 |
0.1079 |
0.1015 |
0.9095 |
0.0798 |
2.2151 |
0.9021 |
1.7263 |
|
Model 284 |
3/15 |
0.0713 |
0.9580 |
0.0315 |
0.0951 |
0.9266 |
0.0364 |
2.9364 |
0.8708 |
2.1602 |
|
Model 285 |
4/5 |
0.0925 |
0.9324 |
0.0645 |
0.0907 |
0.9262 |
0.0766 |
2.1903 |
0.9075 |
1.7804 |
|
Model 286 |
4/10 |
0.0849 |
0.9398 |
0.0452 |
0.0868 |
0.9299 |
0.0411 |
2.7128 |
0.8504 |
2.1271 |
|
Model 287 |
4/15 |
0.1035 |
0.9168 |
0.1039 |
0.1015 |
0.8900 |
0.0890 |
1.6273 |
0.8952 |
1.1139 |
|
Model 288 |
5/5 |
0.1015 |
0.9134 |
0.2014 |
0.1077 |
0.9026 |
0.1889 |
2.8014 |
0.8308 |
2.2104 |
|
Model 289 |
5/10 |
0.1182 |
0.8799 |
0.0457 |
0.1138 |
0.8881 |
0.0481 |
2.9885 |
0.8236 |
2.4389 |
|
Model 290 |
5/15 |
0.0971 |
0.9342 |
0.0293 |
0.1109 |
0.8885 |
0.0375 |
2.3855 |
0.8779 |
1.8470 |
From Table 23, it has been observed that the performance of GDA algorithm-based ANN models has been started increasing up to two hidden layers. Therefore, the ANN model of two hidden layers interconnected with ten neurons has been identified as a better performance model. From Table 23, it has also been observed that the performance of GDA ANN models decreased with hidden layers after two layers in predicting the OMC of soil. The performance variation of ANN models configured with different backpropagation algorithms for predicting soil optimum moisture content has been mapped, as shown in Fig. 5.
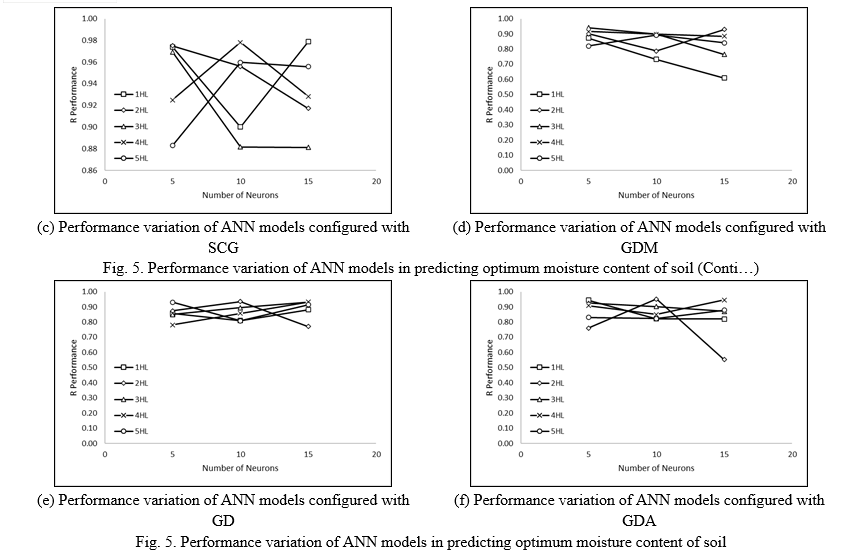
Fig. 5 depicts the performance variation of ANN models configured with different backpropagation algorithms in predicting the OMC of soil. The same pattern is mapped in the performance variation of ANN models in predicting the OMC of soil. In a few cases, the performance of ANN models has continuously decreased in predicting OMC. On the other hand, the maximum performance has been achieved by LM algorithm-based ANN models in predicting the OMC of soil. Therefore, it may be stated that the LM achieves better performance due to the strongly correlated datasets.
D. Prediction of Maximum Dry Density
For the prediction of maximum dry density, the LM, BFG, SCG, GDA, GD, and GDM algorithm-based artificial neural network models have evolved with different hidden layers and neurons. The performance of the proposed models has been discussed below.
- Using Levenberg – Marquardt (LM) Algorithm Based Neural Network Models
The artificial neural networks have been developed to predict the MDD of soil using the LM algorithm. The performance of LM algorithm-based models is given in Table 24.
Table 24. Performance of LM Algorithm-based ANN models for maximum dry density
|
Model ID |
HL/N |
Training |
Validation |
Testing |
||||||
|
RMSE |
R |
MAE |
RMSE |
R |
MAE |
RMSE |
R |
MAE |
||
|
Model 301 |
1/5 |
0.0099 |
0.9760 |
0.0005 |
0.0111 |
0.9645 |
0.0004 |
0.1161 |
0.8754 |
0.0925 |
|
Model 302 |
1/10 |
0.0100 |
0.9762 |
0.0008 |
0.0108 |
0.9659 |
0.0006 |
0.1027 |
0.9474 |
0.0743 |
|
Model 303 |
1/15 |
0.0087 |
0.9795 |
0.0008 |
0.0112 |
0.9729 |
0.0010 |
0.1068 |
0.9609 |
0.0866 |
|
Model 304 |
2/5 |
0.0104 |
0.9747 |
0.0007 |
0.0097 |
0.9711 |
0.0007 |
0.0917 |
0.9318 |
0.0654 |
|
Model 305 |
2/10 |
0.0091 |
0.9809 |
0.0017 |
0.0126 |
0.9485 |
0.0017 |
0.0828 |
0.9474 |
0.0580 |
|
Model 306 |
2/15 |
0.0090 |
0.9834 |
0.0028 |
0.0112 |
0.9551 |
0.0030 |
0.0805 |
0.9627 |
0.0608 |
|
Model 307 |
3/5 |
0.0091 |
0.9814 |
0.0008 |
0.0108 |
0.9628 |
0.0008 |
0.0765 |
0.9606 |
0.0647 |
|
Model 308 |
3/10 |
0.0088 |
0.9813 |
0.0020 |
0.0113 |
0.9665 |
0.0020 |
0.0831 |
0.9166 |
0.0625 |
|
Model 309 |
3/15 |
0.0092 |
0.9792 |
0.0022 |
0.0113 |
0.9698 |
0.0019 |
0.0935 |
0.9618 |
0.0799 |
|
Model 310 |
4/5 |
0.0093 |
0.9801 |
0.0075 |
0.0112 |
0.9596 |
0.0075 |
0.0844 |
0.9470 |
0.0611 |
|
Model 311 |
4/10 |
0.0097 |
0.9793 |
0.0012 |
0.0107 |
0.9697 |
0.0012 |
0.0715 |
0.9503 |
0.0539 |
|
Model 312 |
4/15 |
0.0104 |
0.9741 |
0.0015 |
0.0133 |
0.9599 |
0.0016 |
0.0700 |
0.9784 |
0.0532 |
|
Model 313 |
5/5 |
0.0092 |
0.9786 |
0.0022 |
0.0114 |
0.9691 |
0.0024 |
0.0733 |
0.9230 |
0.0566 |
|
Model 314 |
5/10 |
0.0096 |
0.9774 |
0.0009 |
0.0130 |
0.9626 |
0.0012 |
0.0892 |
0.9487 |
0.0738 |
|
Model 315 |
5/15 |
0.0093 |
0.9787 |
0.0008 |
0.0105 |
0.9703 |
0.0008 |
0.0878 |
0.9588 |
0.0592 |
From Table 24, it has been observed that the performance of one, two, four, and five hidden layer-based ANN models have been increased with the number of neurons. But the performance of three hidden layer-based ANN models has decreased by providing ten neurons. Nevertheless, model 312 outperformed the other LM models in predicting the maximum dry density of soil with a performance of 0.9784.
2. Using BFGs Quasi – Newton (BFG) Algorithm Based Neural Network Models
Artificial neural networks have been developed to predict the MDD of soil using the BFG algorithm. The performance of BFG algorithm-based models is given in Table 25.
Table 25. Performance of BFG Algorithm-based ANN models for maximum dry density
|
Model ID |
HL/N |
Training |
Validation |
Testing |
||||||
|
RMSE |
R |
MAE |
RMSE |
R |
MAE |
RMSE |
R |
MAE |
||
|
Model 316 |
1/5 |
0.0134 |
0.9500 |
0.0011 |
0.0165 |
0.9479 |
0.0013 |
0.0648 |
0.9145 |
0.0490 |
|
Model 317 |
1/10 |
0.0120 |
0.9658 |
0.0018 |
0.0123 |
0.9540 |
0.0018 |
0.0898 |
0.9494 |
0.0612 |
|
Model 318 |
1/15 |
0.0110 |
0.9696 |
0.0024 |
0.0110 |
0.9701 |
0.0022 |
0.0812 |
0.9654 |
0.0651 |
|
Model 319 |
2/5 |
0.0170 |
0.9116 |
0.0024 |
0.0180 |
0.9418 |
0.0028 |
0.0580 |
0.9556 |
0.0520 |
|
Model 320 |
2/10 |
0.0188 |
0.9195 |
0.0018 |
0.0174 |
0.8779 |
0.0017 |
0.0568 |
0.9252 |
0.0292 |
|
Model 321 |
2/15 |
0.0127 |
0.9589 |
0.0037 |
0.0115 |
0.9687 |
0.0037 |
0.0857 |
0.9597 |
0.0650 |
|
Model 322 |
3/5 |
0.0195 |
0.9066 |
0.0014 |
0.0164 |
0.9225 |
0.0012 |
0.0939 |
0.8981 |
0.0787 |
|
Model 323 |
3/10 |
0.0160 |
0.9318 |
0.0009 |
0.0128 |
0.9621 |
0.0010 |
0.0851 |
0.9042 |
0.0732 |
|
Model 324 |
3/15 |
0.0219 |
0.8694 |
0.0070 |
0.0257 |
0.8465 |
0.0070 |
0.1066 |
0.7436 |
0.0602 |
|
Model 325 |
4/5 |
0.0139 |
0.9480 |
0.0015 |
0.0147 |
0.9572 |
0.0016 |
0.0633 |
0.9506 |
0.0474 |
|
Model 326 |
4/10 |
0.0166 |
0.9287 |
0.0011 |
0.0153 |
0.9398 |
0.0011 |
0.0811 |
0.9349 |
0.0725 |
|
Model 327 |
4/15 |
0.0135 |
0.9474 |
0.0007 |
0.0213 |
0.9090 |
0.0011 |
0.0734 |
0.9540 |
0.0570 |
|
Model 328 |
5/5 |
0.0135 |
0.9535 |
0.0006 |
0.0144 |
0.9477 |
0.0007 |
0.0731 |
0.9006 |
0.0550 |
|
Model 329 |
5/10 |
0.0106 |
0.9711 |
0.0006 |
0.0133 |
0.9537 |
0.0006 |
0.0882 |
0.9378 |
0.0605 |
|
Model 330 |
5/15 |
0.0130 |
0.9565 |
0.0008 |
0.0112 |
0.9728 |
0.0008 |
0.0667 |
0.9030 |
0.0528 |
From Table 25, it has been observed that the performance of the single-hidden layers-based ANN model has increased with neurons. But it has also been observed that the performance of three and five hidden layers-based ANN models has been increased by providing ten neurons. Model 318 has been identified as a better performance model in predicting MDD of soil with a performance of 0.9654.
3. Using Scaled Conjugate Gradient (SCG) Algorithm Based Neural Network Models
Artificial neural networks have been developed to predict the MDD of soil using the SCG algorithm. The performance of SCG algorithm-based models is given in Table 26.
Table 26. Performance of SCG Algorithm-based ANN models for maximum dry density
|
Model ID |
HL/N |
Training |
Validation |
Testing |
||||||
|
RMSE |
R |
MAE |
RMSE |
R |
MAE |
RMSE |
R |
MAE |
||
|
Model 331 |
1/5 |
0.0131 |
0.9557 |
0.0003 |
0.0138 |
0.9520 |
0.0004 |
0.0705 |
0.9623 |
0.0597 |
|
Model 332 |
1/10 |
0.0107 |
0.9718 |
0.0004 |
0.0113 |
0.9645 |
0.0003 |
0.0904 |
0.9379 |
0.0643 |
|
Model 333 |
1/15 |
0.0177 |
0.9141 |
0.0022 |
0.0164 |
0.9405 |
0.0018 |
0.0903 |
0.9560 |
0.0832 |
|
Model 334 |
2/5 |
0.0117 |
0.9624 |
0.0003 |
0.0134 |
0.9603 |
0.0004 |
0.0891 |
0.9428 |
0.0592 |
|
Model 335 |
2/10 |
0.0096 |
0.9742 |
0.0011 |
0.0141 |
0.9578 |
0.0013 |
0.1153 |
0.9223 |
0.0929 |
|
Model 336 |
2/15 |
0.0107 |
0.9719 |
0.0006 |
0.0130 |
0.9543 |
0.0007 |
0.0665 |
0.9302 |
0.0511 |
|
Model 337 |
3/5 |
0.0137 |
0.9550 |
0.0004 |
0.0134 |
0.9455 |
0.0004 |
0.0731 |
0.8818 |
0.0592 |
|
Model 338 |
3/10 |
0.0121 |
0.9603 |
0.0005 |
0.0157 |
0.9434 |
0.0006 |
0.0854 |
0.8866 |
0.0515 |
|
Model 339 |
3/15 |
0.0156 |
0.9417 |
0.0033 |
0.0149 |
0.9385 |
0.0031 |
0.1143 |
0.8740 |
0.0872 |
|
Model 340 |
4/5 |
0.0123 |
0.9571 |
0.0007 |
0.0138 |
0.9612 |
0.0008 |
0.0747 |
0.9214 |
0.0471 |
|
Model 341 |
4/10 |
0.0142 |
0.9416 |
0.0013 |
0.0157 |
0.9485 |
0.0019 |
0.1045 |
0.8639 |
0.0695 |
|
Model 342 |
4/15 |
0.0109 |
0.9693 |
0.0013 |
0.0112 |
0.9693 |
0.0013 |
0.0854 |
0.9496 |
0.0569 |
|
Model 343 |
5/5 |
0.0126 |
0.9604 |
0.0009 |
0.0128 |
0.9543 |
0.0009 |
0.0759 |
0.9593 |
0.0635 |
|
Model 344 |
5/10 |
0.0106 |
0.9736 |
0.0020 |
0.0128 |
0.9518 |
0.0020 |
0.0771 |
0.9435 |
0.0532 |
|
Model 345 |
5/15 |
0.0122 |
0.9603 |
0.0008 |
0.0158 |
0.9498 |
0.0010 |
0.1095 |
0.9274 |
0.0839 |
From Table 26, it has been observed that the SCG algorithm-based ANN models have achieved maximum performance using one to five hidden layers interconnected with 5/15 neurons. Model 331 has outperformed the other SCG ANN models in predicting MDD of soil with a performance of 0.9623.
4. Using Gradient Descent with Momentum (GDM) Algorithm Based Neural Network Models
Artificial neural networks have been developed to predict the MDD of soil using the GDM algorithm. The performance of GDM algorithm-based models is given in Table 27.
Table 27. Performance of GDM Algorithm-based ANN models for maximum dry density
|
Model ID |
HL/N |
Training |
Validation |
Testing |
||||||
|
RMSE |
R |
MAE |
RMSE |
R |
MAE |
RMSE |
R |
MAE |
||
|
Model 346 |
1/5 |
0.0318 |
0.7485 |
0.0012 |
0.0372 |
0.6603 |
0.0016 |
0.0839 |
0.8709 |
0.0611 |
|
Model 347 |
1/10 |
0.0392 |
0.7343 |
0.0051 |
0.0436 |
0.8088 |
0.0053 |
0.0736 |
0.8629 |
0.0556 |
|
Model 348 |
1/15 |
0.0493 |
0.5174 |
0.0049 |
0.0542 |
0.3973 |
0.0053 |
0.1661 |
0.5749 |
0.1430 |
|
Model 349 |
2/5 |
0.0586 |
0.7148 |
0.0105 |
0.0656 |
0.7697 |
0.0128 |
0.2382 |
0.5828 |
0.2145 |
|
Model 350 |
2/10 |
0.0399 |
0.7892 |
0.0022 |
0.0349 |
0.8114 |
0.0016 |
0.1378 |
0.5118 |
0.1142 |
|
Model 351 |
2/15 |
0.0673 |
0.4501 |
0.0091 |
0.0527 |
0.7228 |
0.0081 |
0.2582 |
0.6403 |
0.2322 |
|
Model 352 |
3/5 |
0.0295 |
0.8610 |
0.0013 |
0.0319 |
0.8419 |
0.0016 |
0.0975 |
0.8256 |
0.0829 |
|
Model 353 |
3/10 |
0.0384 |
0.6660 |
0.0045 |
0.0341 |
0.6778 |
0.0041 |
0.0875 |
0.7619 |
0.0679 |
|
Model 354 |
3/15 |
0.0399 |
0.6777 |
0.0059 |
0.0413 |
0.6427 |
0.0063 |
0.1277 |
0.3487 |
0.1060 |
|
Model 355 |
4/5 |
0.0346 |
0.6837 |
0.0016 |
0.0273 |
0.7019 |
0.0011 |
0.1361 |
0.6427 |
0.1187 |
|
Model 356 |
4/10 |
0.0324 |
0.7980 |
0.0019 |
0.0322 |
0.8077 |
0.0023 |
0.0806 |
0.8176 |
0.0542 |
|
Model 357 |
4/15 |
0.0334 |
0.7413 |
0.0025 |
0.0334 |
0.8268 |
0.0028 |
0.1980 |
0.7026 |
0.1505 |
|
Model 358 |
5/5 |
0.0555 |
0.5570 |
0.0126 |
0.0500 |
0.5499 |
0.0110 |
0.1343 |
0.5305 |
0.0886 |
|
Model 359 |
5/10 |
0.0358 |
0.6657 |
0.0069 |
0.0440 |
0.6018 |
0.0081 |
0.1652 |
0.4309 |
0.1288 |
|
Model 360 |
5/15 |
0.0352 |
0.6392 |
0.0042 |
0.0362 |
0.6139 |
0.0041 |
0.1734 |
0.3052 |
0.1076 |
From Table 27, it has been observed that the performance of GDM algorithm-based ANN models has been decreased with the number of hidden layers. It has also been observed that the GDM ANN models have less capacity in predicting the MDD of soil. The training performance of developed models is less than 0.9. Therefore, the GDM ANN models have not achieved performance equal to or more than 0.9. Model 346 has been identified as a better performance model in predicting MDD of soil with a performance of 0.8709.
5. Using Gradient Descent (GD) Algorithm Based Neural Network Models
Artificial neural networks have been developed to predict the MDD of soil using the GD algorithm. The performance of GD algorithm-based models is given in Table 28.
Table 28. Performance of GD Algorithm-based ANN models for maximum dry density
|
Model ID |
HL/N |
Training |
Validation |
Testing |
||||||
|
RMSE |
R |
MAE |
RMSE |
R |
MAE |
RMSE |
R |
MAE |
||
|
Model 361 |
1/5 |
0.0318 |
0.7484 |
0.0012 |
0.0372 |
0.6602 |
0.0016 |
0.0840 |
0.8708 |
0.0611 |
|
Model 362 |
1/10 |
0.0539 |
0.4981 |
0.0039 |
0.0488 |
0.4842 |
0.0032 |
0.2275 |
0.6592 |
0.1801 |
|
Model 363 |
1/15 |
0.0760 |
0.7989 |
0.0104 |
0.0852 |
0.7581 |
0.0128 |
0.2411 |
0.8963 |
0.1977 |
|
Model 364 |
2/5 |
0.0486 |
0.3981 |
0.0043 |
0.0489 |
0.6733 |
0.0050 |
0.1366 |
0.5304 |
0.1100 |
|
Model 365 |
2/10 |
0.0566 |
0.8936 |
0.0064 |
0.0671 |
0.9105 |
0.0089 |
0.1886 |
0.9117 |
0.1174 |
|
Model 366 |
2/15 |
0.0428 |
0.6924 |
0.0185 |
0.0574 |
0.6729 |
0.0176 |
0.3063 |
0.8548 |
0.2559 |
|
Model 367 |
3/5 |
0.0456 |
0.8158 |
0.0044 |
0.0433 |
0.8827 |
0.0035 |
0.1466 |
0.7977 |
0.0935 |
|
Model 368 |
3/10 |
0.0624 |
0.5455 |
0.0119 |
0.0720 |
0.6377 |
0.0146 |
0.2700 |
0.6445 |
0.2372 |
|
Model 369 |
3/15 |
0.0337 |
0.7264 |
0.0055 |
0.0257 |
0.8272 |
0.0046 |
0.0931 |
0.7454 |
0.0843 |
|
Model 370 |
4/5 |
0.0374 |
0.6219 |
0.0024 |
0.0363 |
0.7380 |
0.0024 |
0.0895 |
0.7544 |
0.0804 |
|
Model 371 |
4/10 |
0.0386 |
0.8349 |
0.0062 |
0.0452 |
0.8215 |
0.0066 |
0.1142 |
0.8327 |
0.0860 |
|
Model 372 |
4/15 |
0.0281 |
0.8093 |
0.0023 |
0.0248 |
0.8230 |
0.0019 |
0.1281 |
0.7927 |
0.0967 |
|
Model 373 |
5/5 |
0.0265 |
0.8615 |
0.0008 |
0.0253 |
0.8238 |
0.0008 |
0.1080 |
0.8586 |
0.0867 |
|
Model 374 |
5/10 |
0.0268 |
0.8118 |
0.0011 |
0.0355 |
0.7089 |
0.0018 |
0.0600 |
0.9462 |
0.0498 |
|
Model 375 |
5/15 |
0.0395 |
0.6910 |
0.0039 |
0.0337 |
0.6571 |
0.0030 |
0.1310 |
0.7885 |
0.1099 |
From Table 28, it has been observed that the GD algorithm-based ANN model has predicted MDD of soil with a performance of less than 0.8, which is less acceptable. Therefore, model 374 has been identified as a better performance model in predicting MDD of soil with a performance of 0.9462.
6. Using Gradient Descent Algorithm with Adaptive Learning (GDA) Based Neural Network Models
Artificial neural networks have been developed to predict the MDD of soil using the GDA algorithm. The performance of GDA algorithm-based models is given in Table 29.
Table 29. Performance of GDA Algorithm-based ANN models for maximum dry density
|
Model ID |
HL/N |
Training |
Validation |
Testing |
||||||
|
RMSE |
R |
MAE |
RMSE |
R |
MAE |
RMSE |
R |
MAE |
||
|
Model 376 |
1/5 |
0.0138 |
0.9540 |
0.0025 |
0.0125 |
0.9553 |
0.0022 |
0.1172 |
0.9186 |
0.0938 |
|
Model 377 |
1/10 |
0.0140 |
0.9502 |
0.0081 |
0.0155 |
0.9451 |
0.0097 |
0.1438 |
0.8354 |
0.1014 |
|
Model 378 |
1/15 |
0.0154 |
0.9437 |
0.0018 |
0.0143 |
0.9368 |
0.0016 |
0.1161 |
0.9642 |
0.0952 |
|
Model 379 |
2/5 |
0.0203 |
0.8985 |
0.0014 |
0.0193 |
0.8968 |
0.0021 |
0.0945 |
0.7407 |
0.0574 |
|
Model 380 |
2/10 |
0.0134 |
0.9545 |
0.0280 |
0.0141 |
0.9579 |
0.0266 |
0.0661 |
0.9598 |
0.0537 |
|
Model 381 |
2/15 |
0.0143 |
0.9524 |
0.0027 |
0.0178 |
0.9102 |
0.0028 |
0.0656 |
0.9490 |
0.0543 |
|
Model 382 |
3/5 |
0.0158 |
0.9362 |
0.0029 |
0.0152 |
0.9466 |
0.0030 |
0.1103 |
0.8490 |
0.0857 |
|
Model 383 |
3/10 |
0.0173 |
0.9198 |
0.0126 |
0.0172 |
0.9415 |
0.0133 |
0.0997 |
0.8452 |
0.0776 |
|
Model 384 |
3/15 |
0.0171 |
0.9351 |
0.0110 |
0.0175 |
0.8902 |
0.0117 |
0.1399 |
0.7945 |
0.0998 |
|
Model 385 |
4/5 |
0.0137 |
0.9485 |
0.0005 |
0.0131 |
0.9669 |
0.0006 |
0.0881 |
0.9428 |
0.0745 |
|
Model 386 |
4/10 |
0.0156 |
0.9387 |
0.0061 |
0.0287 |
0.7949 |
0.0077 |
0.0839 |
0.7981 |
0.0568 |
|
Model 387 |
4/15 |
0.0179 |
0.9196 |
0.0074 |
0.0191 |
0.8982 |
0.0068 |
0.1095 |
0.8881 |
0.0896 |
|
Model 388 |
5/5 |
0.0153 |
0.9390 |
0.0042 |
0.0185 |
0.9193 |
0.0045 |
0.0783 |
0.9501 |
0.0705 |
|
Model 389 |
5/10 |
0.0221 |
0.8763 |
0.0032 |
0.0225 |
0.8692 |
0.0033 |
0.1065 |
0.8193 |
0.0953 |
|
Model 390 |
5/15 |
0.0175 |
0.9169 |
0.0035 |
0.0230 |
0.9018 |
0.0048 |
0.0801 |
0.8948 |
0.0685 |
From Table 29, it has been observed that the GDA algorithm-based ANN models employed with 5/15 neurons have predicted MDD of soil with a performance of more than 0.85. Thus, Model 378 has been identified as a better performance model with a performance of 0.9642.
The performance variation of ANN models configured with different backpropagation algorithms for predicting soil optimum moisture content has been mapped, as shown in Fig. 6.
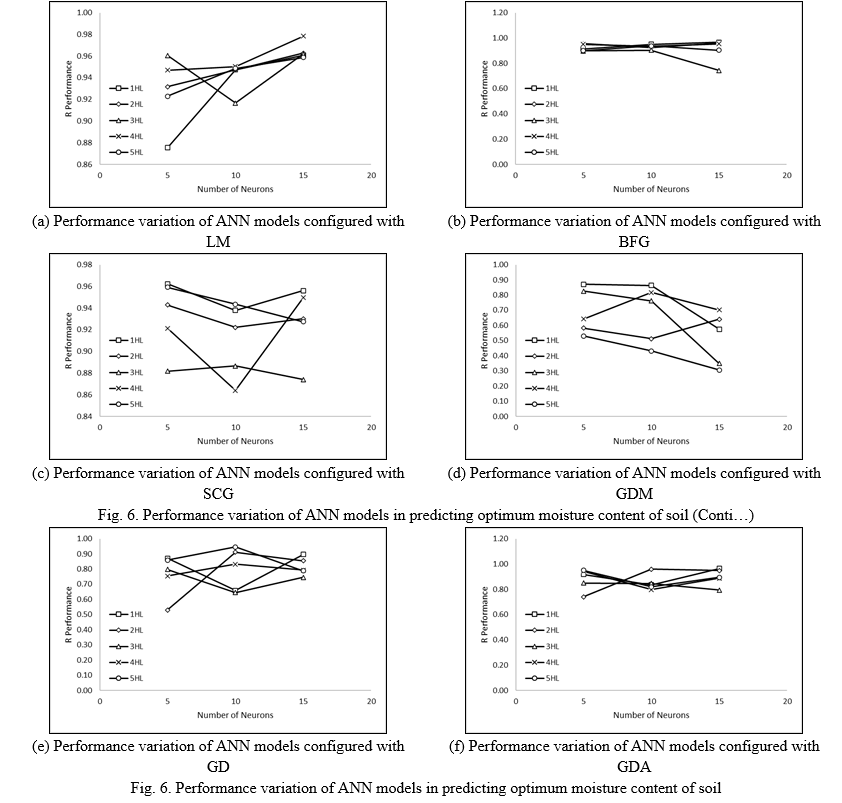
Fig. 6 depicts the performance variation of ANN models configured with different backpropagation algorithms in predicting the MDD of soil. The same pattern is mapped in the performance variation of ANN models in predicting MDD of soil. In a few cases, the performance of ANN models has continuously decreased with neurons. The maximum performance has been achieved by LM algorithm-based ANN models in predicting the MDD of soil. Therefore, it may be stated that the LM achieves better performance due to the strongly correlated datasets.
V. THE BEST ARCHITECTURE MODELS
The present research work has been carried out to predict the liquid limit, plasticity index, optimum moisture content, and maximum dry density. A total of 390 ANN models have been developed in the present work to identify the best architectural ANN models for predicting the geotechnical properties of soil. Models 3, 28, 45, 53, 69, and 83 have been identified as better performance models in predicting the liquid limit of soil. Similarly, Models 106, 118, 133, 152, 167, and 184 have been identified as better performance models in predicting soil plasticity index. The compaction parameters, namely maximum dry density and optimum moisture content, have also been predicted using artificial neural networks. Models 201, 220, 233, 252, 265, and 280 have been identified as better performance models in predicting the OMC of soil. Similarly, Models 312, 318, 331, 346, 374, and 378 have been identified as the better performance models in predicting MDD of soil. Finally, the best architectural ANN models have been identified by comparing the performance of better performance models, as shown in Fig. 7.
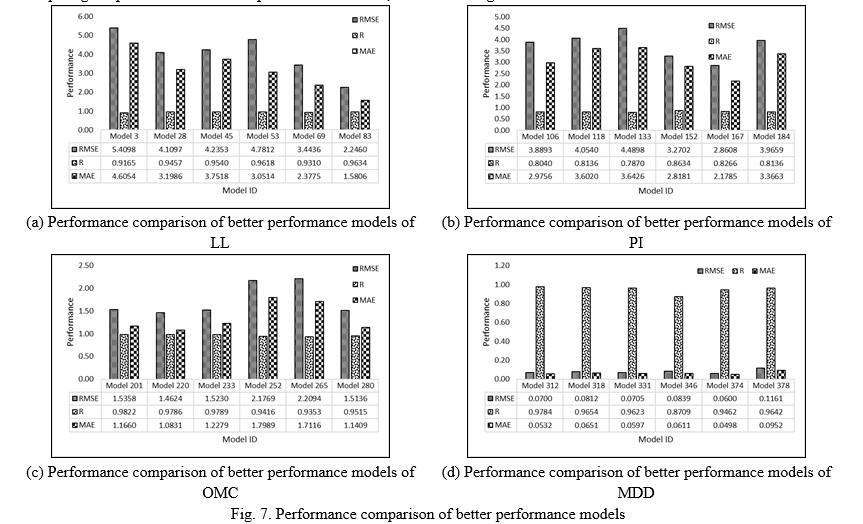
Fig. 7 depicts the performance comparison of the better performance models to identify the best architectural ANN Models for predicting LL, PI, OMC, and MDD of soil. Figure 7(a) shows that Model 83 has outperformed Models 3, 28, 45, 53, and 69 in predicting the liquid limit of soil with the performance of 0.9634. Figure 7(b) shows that Model 152 has outperformed Models 106, 118, 133, 167, and 184 in predicting the plasticity index of soil with a performance of 0.8634. Figure 7(c) shows that Model 201 has outperformed Models 220, 233, 252, 265, and 280 in predicting the OMC of soil. Figure 7 (d) shows that Model 312 has outperformed Models 318, 331, 346, 374, and 378 in predicting the MDD of soil. Models 83, 152, 201, and 312 have been configured with 3HL/10N, 3HL/5N, 1HL/5N, and 4HL/15N. Similarly, it has also been observed that the GDA algorithm-based ANN model has predicted LL with optimum performance of 0.9634, having strongly correlated datasets. But in the case of PI, the GDM algorithm-based ANN model has achieved a performance of 0.8634, having strongly correlated datasets. The LM, BFG, and SCG algorithm-based ANN models did not perform well. Therefore, models 201 and 312 of OMC and MDD have been identified as the best architectural ANN models. Models 201 and 312 have been configured with the LM backpropagation algorithm. The input (S, FC, LL, PI) and output (OMC, MDD) compaction parameters are strongly to very strongly correlated. Therefore, it may be stated that the LM backpropagation algorithm-based ANN model requires strongly to very strongly correlated datasets to achieve higher performance and prediction accuracy. The artificial neural network models have been classified based on their performance, as shown in Fig. 8.
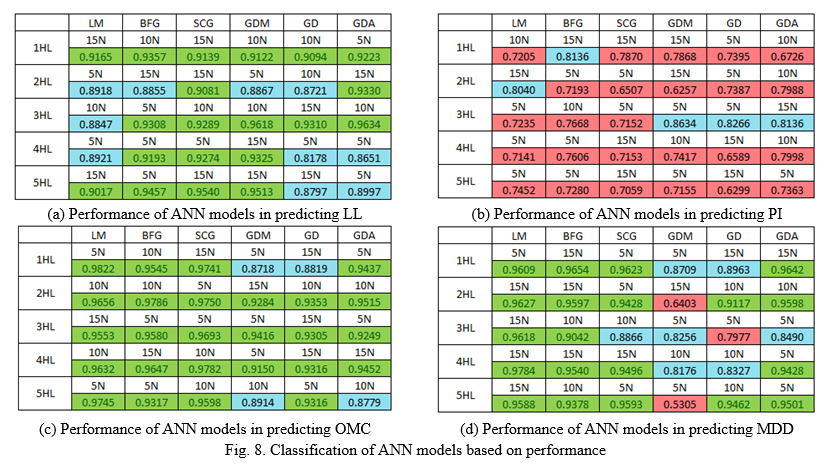
Fig. 8 depicts the classification of ANN models based on test performance. The artificial neural network model is classified as a robust, high, moderate, and good performance model if the model has a performance of more than 0.95, between 0.9-0.95, between 0.8-0.9, and less than 0.8, respectively. The following formulas have also been suggested for the required number of hidden layers and neurons to achieve robust or high-performance during prediction by ANN models. The suggested equations are applicable only for datasets with a correlation coefficient of more than 0.85.
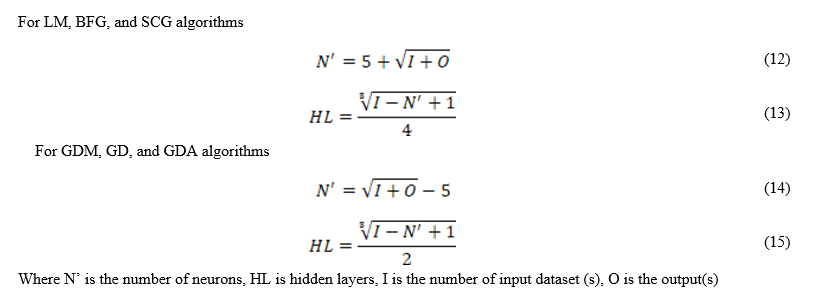
Conclusion
The present research work was carried out to determine the best architecture models to predict soil\'s consistency limits and compaction parameters. On the other hand, hidden layers, neurons, and backpropagation algorithms were studied while predicting consistency limits and compaction parameters. The artificial neural network models were developed using the different number of hidden layers (one to five), neurons (5, 10 & 15), and backpropagation algorithms (LM, BFG, SCG, GDM, GD & GDA). The present study maps the following conclusions. 1) In the prediction of liquid limit, it was observed that the performance of the LM algorithm-based ANN model was decreased with increasing the number of hidden layers and neurons. On the other hand, the performance of BFG and SCG algorithm-based ANN models was increased by increasing the hidden layers and neurons. The performance of the GDA, GD and GDM algorithm-based ANN model was increased up to 3 hidden layers interconnecting with 10/15 neurons. Therefore, it may be stated that the LM requires the least hidden layers and neurons for achieving a performance of more than 0.9. Thus, Models 3 (LM), 28 (BFG), 45 (SCG), 53 (GDM), 69 (GD), and 83 (GDA) were identified as better performance models in predicting the liquid limit of soil. Models 3, 28, 45, 53, 69, and 83 showed that Model 83 outperformed other better performance liquid limit models with a performance of 0.9634. 2) In the prediction of plasticity index, it was observed that the performance of LM algorithm-based ANN models was increased up to two hidden layers interconnected with 15 neurons (Model 106). Further, the performance of the LM algorithm-based ANN model was started decreasing. The performance of the BFG and SCG algorithm-based ANN model decreased with an increasing number of hidden layers and neurons. On the other hand, the performance of the GDA, GD, and GDM algorithm-based ANN model was increased up to 3 hidden layers interconnected with 5/15 neurons. Therefore, it may be stated that the BFG and SCG algorithm-based ANN model requires the least hidden layer and neurons for achieving a performance of more than 0.75. Thus, Models 106, 118, 133, 152, 167, and 184 were identified as better performance models in predicting the plasticity index of soil. Models 106, 118, 133, 152, 167, and 184 showed that Model 152 outperformed other better performance plasticity index models with a performance of 0.8634. 3) In the prediction of optimum moisture content, it was observed that the performance of LM algorithm-based ANN models was decreased with the number of hidden layers and neurons (Models 201 to 215). The SCG algorithm-based ANN model 233 achieved a performance of 0.9789. Model 233 was configured with one hidden layer interconnected with 15 neurons. Similarly, the BFG algorithm-based ANN model 220 achieved a performance of 0.9786, which was close to the performance of Model 233. Model 220 was configured with two hidden layers interconnected with ten neurons. Furthermore, it was stated that the SCG algorithm-based ANN model 233 requires less hidden layers and neurons. The GDM, GD, and GDA algorithm-based ANN models achieved performance of 0.9416 (3 HL, 5N), 0.9353 (2HL, 10N), and 0.9515 (2HL, 10N), respectively. Thus, Models 201, 220, 233, 252, 265, and 280 were identified as better performance models in predicting the OMC of soil. Models 201, 220, 233, 252, 265, and 280 showed that Model 201 outperformed other better performance optimum moisture content models with a performance of 0.9822. 4) In the prediction of maximum dry density, it was observed that the performance of LM algorithm-based ANN models was increased with a number of hidden layers and neurons (Models 301 to 315). Model 312 predicted MDD of soil with a performance of 0.9784. The BFG and GDA algorithm-based ANN models predicted MDD of soil with a performance of 0.9654 and 0.9642, respectively. Therefore, it may be stated that the BFG and GDA algorithm achieves approximate equal performance if the model is configured with one hidden layer interconnected with 15 neurons. On the other hand, GDM and SCG algorithm-based ANN model\'s performance decreased with the increasing number of hidden layers and neurons. The GD algorithm-based ANN model achieved a performance of 0.9462 configured with five hidden layers interconnected with ten neurons. Thus, Models 312, 318, 331, 346, 374, and 378 were identified as the better performance model. The performance comparison showed that Model 312 outperformed the other ANN models in predicting the MDD of soil. The above statements show that the performance of artificial neural networks is affected by the number of hidden layers, neurons, and backpropagation algorithms. Finally, it may be concluded that the consistency limits of soil may be predicted with high accuracy using LM (1HL, 15N), BFG (5HL, 5N), SCG (5HL, 15N), GDM (3HL, 10N), GD (3HL, 15N) and GDA (3HL, 10N) algorithms for ANN models. Similarly, the compaction parameters of soil may be predicted with high accuracy using LM (1HL, 5N), BFG (2HL, 10N), SCG (1HL, 15N), GDM (3HL, 5N), GD (2HL, 10N), and GDA (2HL, 10N) algorithms for ANN models. The strength parameters are affected by the size of the particle and consistency limits. Therefore, the proposed ANN models of compaction parameters can be used to predict the UCS, C, and phi parameters of soil.
References
[1] Albaradeyia, I., Hani A., Shahrour I., WEPP and ANN models for simulating soil loss and runoff in a semi–arid Mediterranean region, Environ Monit Assess, 2011, 180(1-4), pp 537-556, Available: 10.1007/s10661-010-1804-x. [2] Alireza Ardakani & Afshin Kordnaeij, Soil compaction parameters prediction using GMDH-type neural network and genetic algorithm, European Journal of Environmental and Civil Engineering, 2017, 23(4), pp 449-462, Available: //dx.doi.org/10.1080/19648189.2017.1304269. [3] Al-Saffar R. Z., Khattab S. I., Yousif S. T., Prediction of soil’s compaction parameters using artificial neural network, Al-Rafidain Engineering, 2013, 21(3), pp 15-27, Available: 10.33899/rengj.2013.75444. [4] Arora K. R., Soil mechanics and foundation engineering, Standard Publisher Distributors, New Delhi, India, 2004 [5] Binaghi, E., Boschetti M., Brivio P. A., Gallo I., Pergalani F., Rampini A., Prediction of displacements in unstable areas using a Neural model, Natural hazards, 2004, pp 135–154, Available: http://irinsubria.uninsubria.it/retrieve/handle/11383/1491924/556/Prediction%20of%20Displacements%20in%20Unstable%20Areas.pdf [6] Chang, T., \"Risk degree of debris flow applying Neural Networks\", Nat. Hazards, 2007, pp 209–224, Available: 10.1007/s11069-006-9069-y. [7] Chen, C., Chien-Chung Ke, Chein Lee Wang, \"A back–propagation network for the assessment of susceptibility to rock slope failure in the eastern portion of the southern cross–island highway in Taiwan\", Environ Geol, 2009, 57, pp 723–733, Available: https://doi.org/10.1007/s00254-008-1350-9. [8] Di Matteo, L, Bigotti, F, Ricco, R, Best-fit models to estimate modified proctor properties of compacted soil. J. Geotech. Geoenviron. Eng., 2009, 135 (7), pp 992–996, Available: https://doi.org/10.1061/(ASCE)GT.1943-5606.0000022. [9] Erzin, Y. et. al., \"Artificial Neural Network models for predicting electrical resistivity of soils from their thermal resistivity”, International Journal of Thermal Sciences, 2010, 49(1), pp. 118–130, Available: https://doi.org/10.1016/j.ijthermalsci.2009.06.008 [10] Farooq, K., Khalid U., Mujtaba H, Prediction of compaction characteristics of fine-grained soils using consistency limits, Ara. J. Sci. Eng. 2016, 41(4), pp. 1319-1328, Available: 10.1007/S13369-015-1918-0. [11] Gunaydin O, Ozbeyaz A, Soylemez M., Regression analysis of soil compaction parameters using support vector method, Celal Bayar University Journal of Science, 2018, 14(4), 443-447, Available: https://doi.org/10.18466/cbayarfbe.449644. [12] Günayd?n, O, Estimation of soil compaction parameters by using statistical analyses and artificial neural networks. Environ. Geol. 2009, 203, 57 (1), Available: https://doi.org/10.1007/s00254-008-1300-6. [13] Hair Jr. J, Wolfinbarger M. C., Ortinau, D. J. & Bush, R. P., Essentials of Marketing, New York, Mc Graw Hill, 2013. [14] Hasnat Arif, Hasan Md Mehedi, Islam Md Rabiul, Alim Md Abdul, Prediction of compaction parameters of soil using support vector machine, Current Trends in Civil Engineering & Structural Engineering, 2019, 4(1), pp 1-7, Available: 10.33552/CTCSE.2019.04.000580. [15] IS 2720 (P-5): 1985, Method of Test for Soil: Determination of liquid and plastic limit. [16] IS 2720 (P-7): 1980, Method of Test for Soil: Determination of water content-dry density relation using light compaction [17] IS 2720 (P-8): 1983, Method of Test for Soil: Determination of water content-dry density relation using heavy compaction. [18] J. Khatti, Prof. Kamaldeep Singh Grover (2021), Prediction of index properties of soil using AI approaches, Proceedings of International Conference on Advancements in Computer Applications 2021, FISAT, pp. 8-14, ISBN: 978-93-5473-978-1, Available: https://www.researchgate.net/publication/354378693_Prediction_of_Index_Properties_of_Soil_using_AI_Approaches [19] Jayan J., Dr. N. Sankar, Prediction of compaction parameters of soils using artificial neural network, Asian Journal of Engineering and Technology, 2015, 3(4), Special issue for ICETTAS’15, Available: https://ajouronline.com/index.php/AJET/article/view/3049 [20] Khalid U., Rehman Zia Ur, Evaluation of compaction parameters of fine-grained soils using standard and modified efforts, International Journal of Geo-Engineering, 2018, 9(15), Available: https://doi.org/10.1186/s40703-018-0083-1. [21] Khuntia S., Mujtaba H., Patra Chittaranjan, Farooq K, Sivakugan N., Braja M. Das, Prediction of compaction parameters of coarse-grained soil using multivariate adaptive regression splines (MARS), International Journal of Geotechnical Engineering, 2015, 9(1), pp. 79-88, Available: DoI 10.1179/1939787914Y.0000000061. [22] Majidi A., Lashgaripour G., Shoaie Z., Nashlaji M. N., Firouzei Y., Estimating compaction parameters of marl soils using multi-layer perceptron neural networks, Journal of the Balkan Tribological Association, 2014, 20(2), pp 170-198. [23] Mujtaba, H, Farooq, K, Sivakugan, N, Das, B M, Correlation between gradational parameters and compaction characteristics of sandy soils. Int. J. Geotech. Eng., 2013, 7 (4), pp. 395–401, Available: https://doi.org/10.1179/1938636213Z.00000000045. [24] Rehman, A. U., K. Farooq, and H. Mujtaba, \"Prediction of California bearing ratio (CBR) and compaction characteristics of granular soils.\" Acta Geotechnica Slovenica, 2017, 14(1), pp. 63-72. [25] Shrivastava A. K., Dr. P. K. Jain, Prediction of compaction parameters using regression and ANN tools, International Journal for Scientific Research and Development, 2016, 3(11), pp 697-702. [26] Sivrikaya O., Kayadelen C., Cecen E., Prediction of the compaction parameters for coarse-grained soils with fine content by MLR and GEP, Acta Geotechnica Slovenica, 2013, 2, 29-41, Available: https://www.semanticscholar.org/paper/PREDICTION-OF-THE-COMPACTION-PARAMETERS-FOR-SOILS-Sivrikaya-%C3%87e%C3%A7en/1f723f6a0f5b98a09686616ac79df3da15987bc1 [27] Wang Han-Lin, Zhen-Yu Yin, High performance prediction of soil compaction parameters using multi expression programming, Engineering Geology, 2020, 276, 105758, Available: https://doi.org/10.1016/j.enggeo.2020.105758.
Copyright
Copyright © 2022 Jitendra Khatti, Dr. Kamaldeep Singh Grover. This is an open access article distributed under the Creative Commons Attribution License, which permits unrestricted use, distribution, and reproduction in any medium, provided the original work is properly cited.

Download Paper
Paper Id : IJRASET43662
Publish Date : 2022-05-31
ISSN : 2321-9653
Publisher Name : IJRASET
DOI Link : Click Here
 Submit Paper Online