

Ijraset Journal For Research in Applied Science and Engineering Technology
Estimating the Risk of Developing Heart Disease Using the Logistic Regression Model of Machine Learning
Authors: Geetha M , Monika S, Pavithra P, Sowmiya A, Dinesh V
DOI Link: https://doi.org/10.22214/ijraset.2023.50542
Certificate: View Certificate
Abstract
Asymptomatic diseases, such as cardiovascular diseases, are driving up healthcare costs to the point where they are exceeding corporate and national budgets. As a result, these diseases must be identified and treated as soon as possible. One of the hottest technologies, machine learning is used to predict diseases in many fields, including the healthcare industry. This study uses logistic regression to predict the overall risk and identify the most significant predictors of heart disease. As a result, the c predicators in this study are identified using the binary logistic model, which is one of the classification algorithms in machine learning. In addition, Jupiter Lab and Python are utilized for data analysis in order to validate the logistic regression.
Introduction
I. INTRODUCTION
Over the past few years all over the world. Regardless of whether these infections has found as the main wellspring of death, it has been declared as the most sensible and avoidable sickness [1]. Heart stroke is mostly caused by artery blockage. It occurs when the heart does not effectively circulate blood throughout the body. Additionally, high blood pressure is one of the primary risk factors for heart disease.
According to a survey, from 2011 to 2014, about 35% of people worldwide had hypertension, which is also a factor in heart disease. In a similar vein, there are numerous additional risk factors for heart disease, including obesity, inadequate nutrition, elevated cholesterol, and inactivity.
Therefore, prevention is crucial. Heart disease awareness is essential for prevention. The fact that 47% of people die outside of the hospital demonstrates that they ignore early warning signs. Heart diseases are reducing an individual's lifespan today.
As a result, in 2013, the World Health Organization (WHO) established goals for the prevention of non-communicable diseases (NCDs).
These goals include ensuring that by 2025, at least 50% of patients with cardiovascular diseases will have access to relevant medications and medical counseling [2].
In 2016, cardiovascular diseases accounted for approximately 17.9 million deaths, or 31% of all deaths worldwide. The detection of heart disease is a major obstacle [3].
It is hard to foresee that an individual has a coronary illness or not. There are instruments accessible which can anticipate heart sicknesses yet it is possible that they are costly or are not effective to compute the opportunity of coronary illness in human [4]. According to a World Health Organization (WHO) survey, doctors can only predict 67% of heart attacks, so there is a lot of room for research [5].
In rural India, it is extremely difficult to find good doctors and hospitals. A 2016 WHO report says that, only 58% of the specialists have physician certification in metropolitan regions and 19% in country regions.
Heart infections can be anticipated utilizing Brain Organization, Choice Tree, KNN, and so forth. We will see how Logistic Regression is used to determine heart disease accuracy later in this paper. It likewise shows that how ML will help in our future for coronary illness.
II. WORKFLOW OF MACHINE LEARNING MODEL BUILDING
The machine learning logistic regression model's building process is depicted in Figure 2.
|
Variable Category |
Variable Name |
Description |
Data Type |
|
Demographic |
Sex |
Male or female |
Nominal |
|
Age |
Age of the patient |
Continuous |
|
|
Behaviour |
Current Smoker |
Current smoker or not? |
Nominal |
|
Cigs Per Day |
Cigarettes per day? |
Continuous |
|
|
Medical History |
B P Meds |
Blood pressure medication? |
Nominal |
|
Prevalent Stroke |
Whether previously had stroke? |
Nominal |
|
|
Prevalent Hyp |
Whether was hypertensive? |
Nominal |
|
|
Diabetes |
Whether had diabetes? |
Nominal |
|
|
Current Medical Status |
Tot Chol |
Total Cholesterol Level |
Continuous |
|
Sys BP |
Systolic Blood Pressure |
Continuous |
|
|
Dia BP |
Diastolic Blood Pressure |
Continuous |
|
|
BMI |
Body Mass Index |
Continuous |
|
|
Heart Rate |
Heart Rate |
Continuous |
|
|
Glucose |
Glucose Level |
Continuous |
|
|
Predicted Variable |
TenYearCHD |
10-year risk of CHD |
Binary |
Table 1.2.1: Input Variables
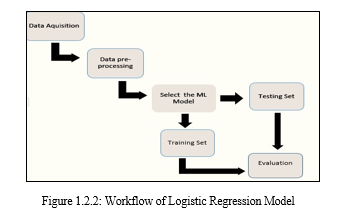
- Obtaining the Dataset The dataset was gathered from the Kaggle website.
- Data Pre-Processing Data pre-processing is necessary for building a more accurate ML model. The process of cleaning the data is called data pre-processing. This includes finding data that is missing, noisy, or inconsistent.
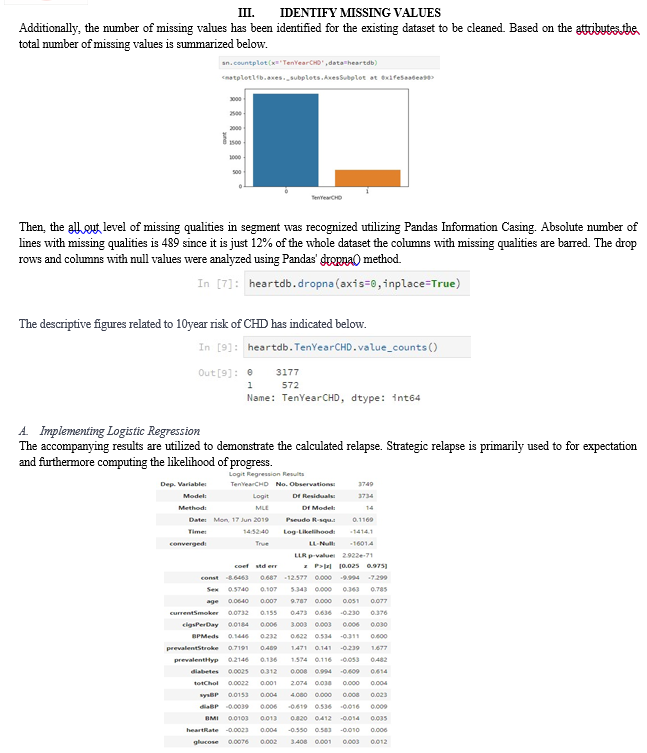
- Choose a Machine Learning Model Machine learning algorithms are used to identify the pre-processed data. a) The study's input variables The data set includes 14 IVS and predicted values. DV identification is the foundation of the ML model. It has utilized paired calculated relapse which is one of the order calculations because of target variable is downright.
- Python and Jupiter Lab were utilized for the analysis of the data. The logistics regression was processed using the following procedures.
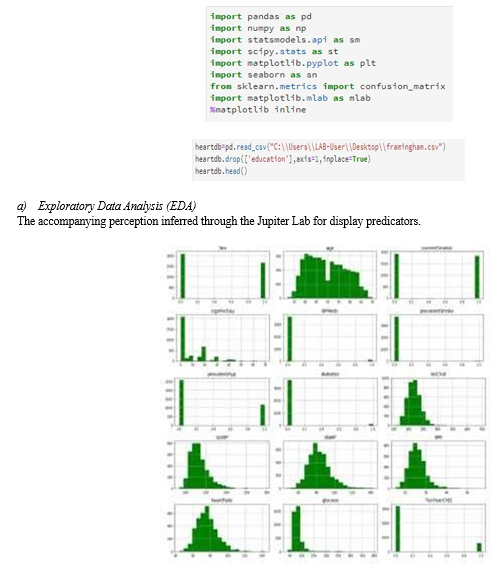
- Loading Data and Other Required Libraries Jupiter Lab has loaded the Framingham CSV file of heart prediction data in order to construct the logistic regression model.
In addition, necessary libraries that are utilized as supporting applications are loaded. The education field has been removed from the database.
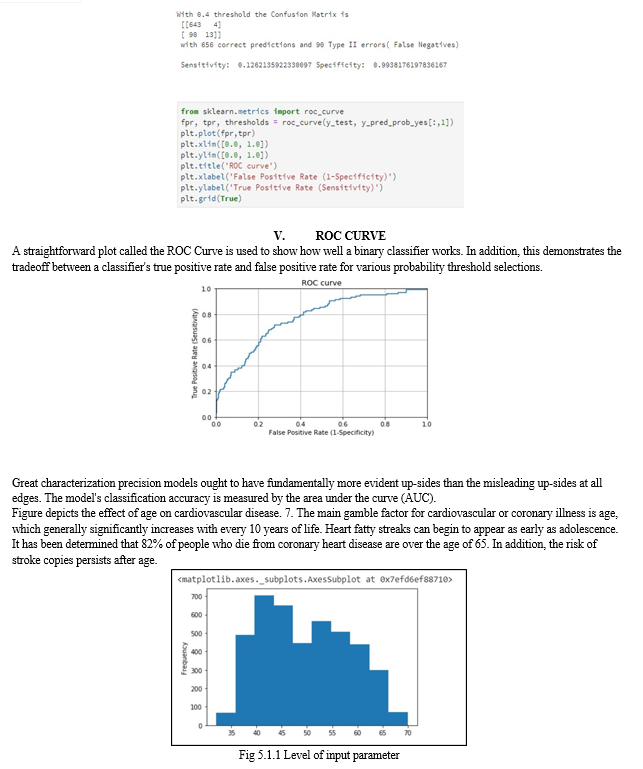
The effectiveness of a binary classifier is demonstrated through the use of a straightforward plot known as the ROC Curve. This also demonstrates the tradeoff between a classifier's true positive rate and false positive rate for various probability threshold choices. At all edges, great portrayal accuracy models ought to have in a general sense more clear advantages than deceiving benefits. The degree of the model's data classification accuracy is measured by its area under the curve, or AUC.
At all edges, excellent characterization precision models should have fundamentally more obvious benefits than misleading benefits. The area under the curve is used to measure the model's classification accuracy.
Conclusion
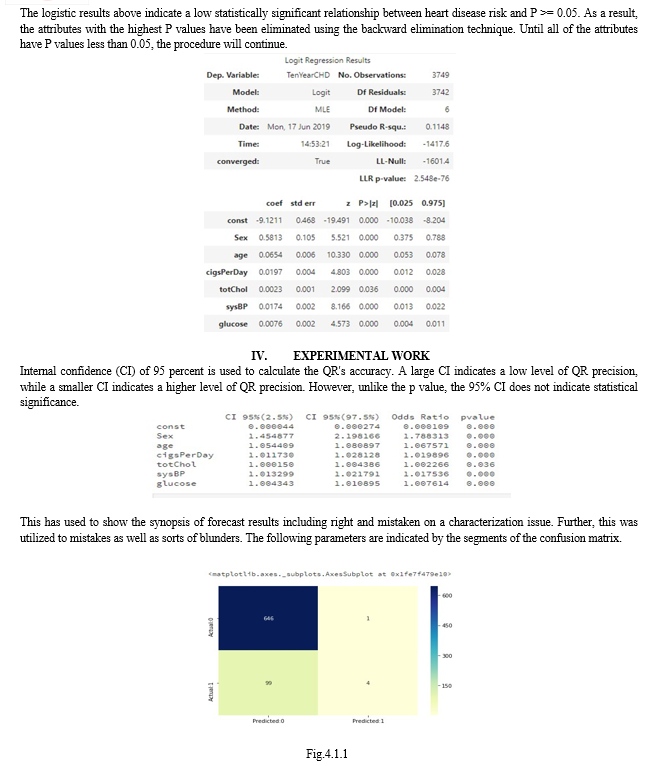
Using 14 intravenous (IV) injections, the purpose of this study is to ascertain the risk of 10-year CHD. P values below 5% are taken into consideration when selecting the attributes through backward elimination. Therefore, the P values of the variables 0.05 (sex, age, cigs Per Day, tot Chol, sys BP, glucose) are used to generate the logistic regression model. The logistic regression result indicates that men are more likely than women to develop heart disease. High systolic blood pressure, age, and smoking are all risk factors for coronary heart disease. Notwithstanding, neither the absolute cholesterol level nor the glucose level altogether change. Regardless, the possibilities are not completely influenced by glucose levels. The model is less sensitive than specific. Additionally, this model has a 0.87 accuracy. In some ways, the value below the ROC curve, 73.5, is sufficient. The model could also be improved with additional data.
References
[1] E. Benjamin, A. Go, D. Arnett, M. Blaha, M. Cushman, et al. 2015). Statistics on Heart Disease and Stroke—Update for 2015 131(4) of Circulation. 10.1161/cir.0000000000000152. [2] S. Das, A. Dey, A. Pal, N. Roy, and others Machine Learning and Applications of Artificial Intelligence: Prospect and Review 115(9): 31–41, International Journal of Computer Applications.: 10.5120/20182-2402 [3] R. Abduljabbar, H., S. Liyanage, and S. Transport-Based Applications of Artificial Intelligence: An Outline. 189 of Sustainability, 11(1). : 10.3390/su11010189 [4] Pedro Luis Cruz, Carlos Soares, Joo Moreira, and Rui Abreu are among the contributors. (2015). A Comparative Study of Classification and Regression Algorithms for Modeling Students\' Academic Performance, accessed at: https://www.researchgate.net/publication/27803068 9 A Comparative Study of Classification and Regression Algorithms for Modeling Students\' Academic Performance June 10th, 2019. [5] R. Sathya and A. Abraham (2013) published their work in the International Journal of Advanced Research in Artificial Intelligence, Volume 2, No. 2, 2013, accessed through http://ijarai.thesai.org/Downloads/IJARAI/Volume2No2/Paper_6-Comparison_of_Supervised_and_Unsupervised_Learning_Algorithms_for_Pattern_Classification.pdf, with the following page: June 10th, 2019. [6] CVA, K. (2017),https://www.medwinpublishers.com/JOBD/JOBD1 6000139.pdf. 1(7) of the Journal of Orthopedics and Bone Disorders. : 10.23880/jobd-16000139 [7] Miguel-Hurtado, O., Visitor S., Neil, G., and Dark, S. (2016). Comparing Linear/Logistic Regression and Machine Learning Classifiers to Study the Relationship Between Hand Dimensions and Demographic Characteristics. 11(11), e0165521, PLOS ONE. : [8] 10.1371/journal.pone.0165521 Jordan, M. I., and A. Y. Ng (2002) Comparing generative and discriminative classifiers: a comparison of naive bayes and logistic regression. NIPS 14, pages 841–848. [9] Peng, C., Lee, K., and G. Ingersoll An Overview of the Concepts and Methods of Logistic Regression Reporting 3–14 in 96(1) of the Journal of Educational Research: [10] 1080/00220670209598786 [11] Park, H. (2019). An Overview of Logic Regression: From Fundamental Ideas to Understanding with Specific Regard for Nursing Domain, https://pdfs.semanticscholar.org/3305/2b1d2363aee 3ad290612109dcea0aed2a89e.pdf, saw : June 10, 2019
Copyright
Copyright © 2023 Geetha M , Monika S, Pavithra P, Sowmiya A, Dinesh V. This is an open access article distributed under the Creative Commons Attribution License, which permits unrestricted use, distribution, and reproduction in any medium, provided the original work is properly cited.

Download Paper
Paper Id : IJRASET50542
Publish Date : 2023-04-17
ISSN : 2321-9653
Publisher Name : IJRASET
DOI Link : Click Here
 Submit Paper Online