

Ijraset Journal For Research in Applied Science and Engineering Technology
Explanation of BMI data using Linear Regression Model in R
Authors: Sukhvir Singh
DOI Link: https://doi.org/10.22214/ijraset.2022.40640
Certificate: View Certificate
Abstract
This paper describes the regression analysis between different variable like Weight & BMI, Weight & Height, and Height & BMI using Linear Regression Model & data visualization techniques in R Programming from a sample data of 68 students of BCA. The collected data were analyzed for underweight, overweight, obese personalities by using conditional statements. The result of the model will give Residual Standard Error, Multiple R2, Adjusted R2, F-statistic and p-value. There is visualization of data using ggplot() and geom() in last steps.
Introduction
I. INTRODUCTION TO R PROGRAMMING [8]
R is developed by two personalities one is Ross Ihaka and other is Robert Clifford Gentleman. Ross Ihaka, Professor of Statistics at University of Auckland, completed his PhD from University of California in 1985 & Robert Clifford Gentleman, PhD from University of Washington in 1988, founder director of Centre of Computational Biomedicine at Harvard Medical School. The letter “R” of R Programming is taken from the first alphabet of the names of both the programmers. The language was developed in 1993 at A.T. & T Bell Labs USA. The important features of the language are effectiveness, simple to learn, comprise of loops, conditional statements, graphical tools, various testing tools like t-test, F-test, chi square test, easy representation of data using scatter plot, bar plot, box plot and many more. We can easily import CSV (Comma Separated Values) or Excel data files in R and can work on that data. The key part of this paper focuses on data visualization using R.
II. BMI
BMI stands for Body Mass Index. It gives us the information about our weight category as per given in Table 2.1.The mathematical formula for the calculation of BMI is
BMI = Weight / (Height) 2
(Weight is in Kg and Height in m)
Table 2.1 [7]
|
BMI (Body Mass Index) |
Result |
|
Below 18.5 |
Underweight |
|
18.5-24.9 |
Normal Weight |
|
25.0-29.9 |
Over Weight |
|
30.0-34.9 |
Obesity Class I |
|
35.0-39.9 |
Obesity Class II |
|
Above 40 |
Obesity Class III |
III. DATA VISUALIZATION USING R [9]
The platform used in this paper is Jupyter notebook (Anaconda). It’s an open source web application allows us to visualize data.
The libraries used for data importing and visualization are as under; read_csv() for comma separated values, read_tsv() for tab separated values, read_delim() for general delimited files, read_table() for tabular files where columns are separated by white space, read_log() for web log files.
- tidyverse
- ggplot2
- tibble
- tidyr
- readr
-
-
- read_csv()
- read_tsv()
- read_delim()
- read_fwf()
- read_table()
- read_log()
-
The data set used is
- BMI.csv
The command used to read csv file is read.csv & stored in the variable d1. After that using head we can display first 6 rows of data.
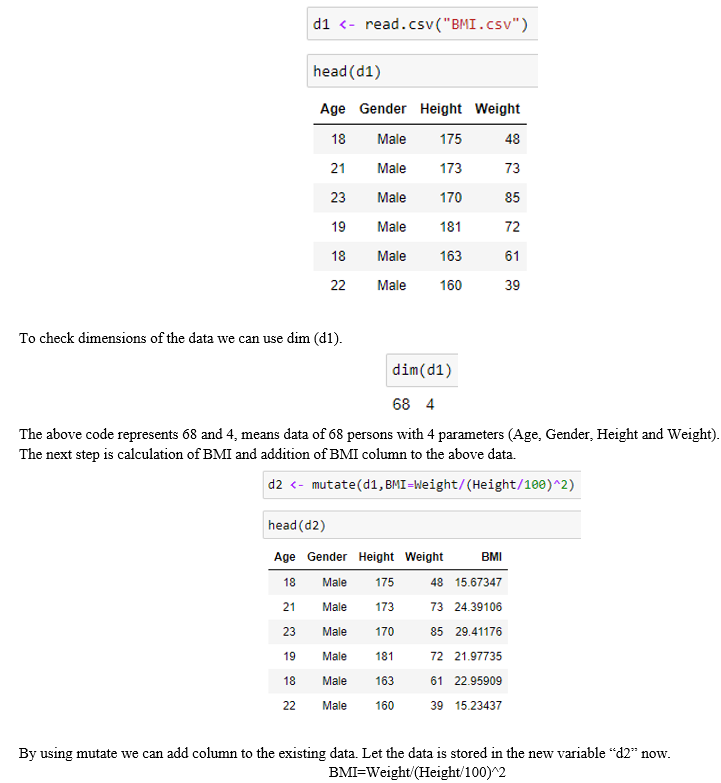
Height is divided by 100 because it’s required in meters and in collected data it was in centimeters.
Now using Table 2.1 conditional statements can be applied to display the result column.
We have to apply conditions on BMI column of data “d2”. Let’s save this in variable T : T <- d2$BMI
Now ifelse condition can be applied to implement the conditions given in Table 2.1
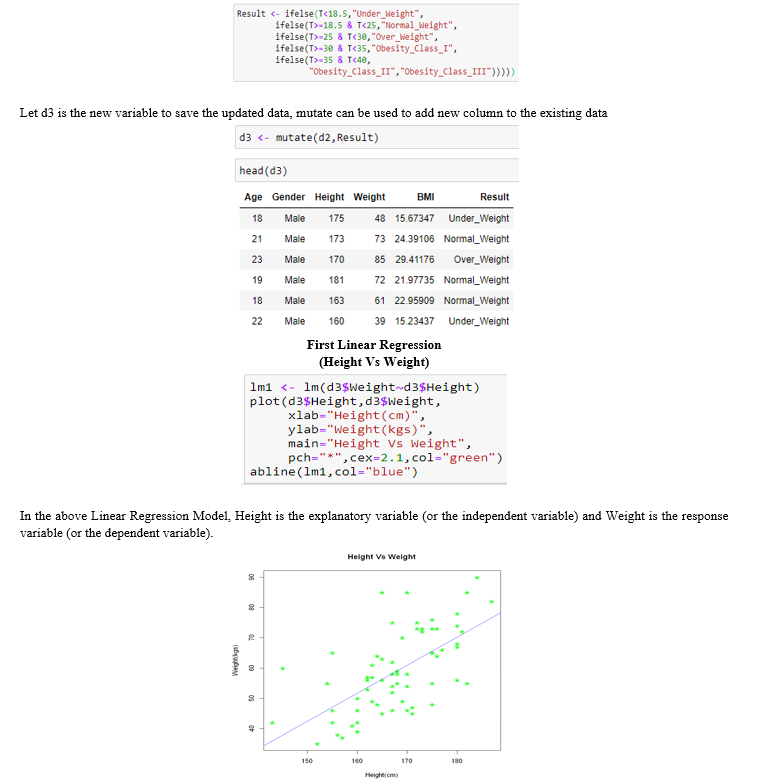
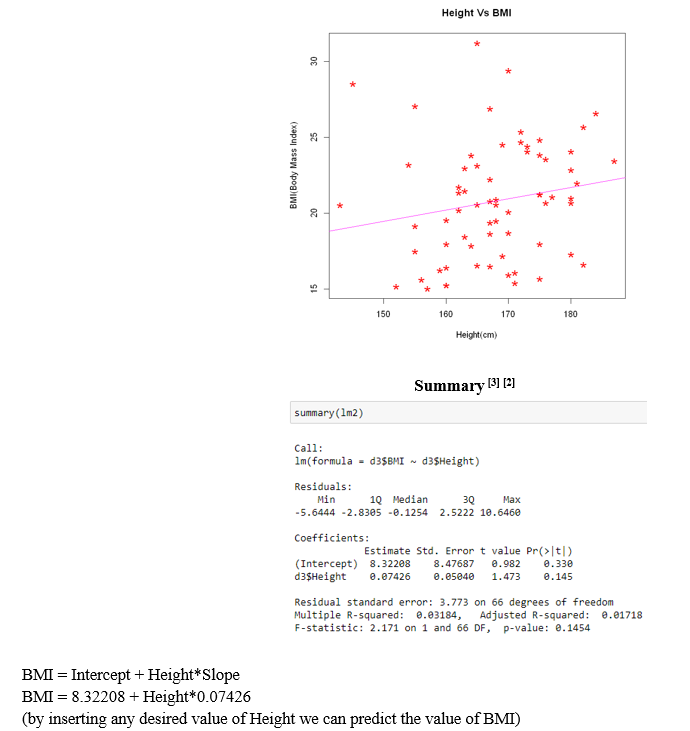
In this model, Height is the explanatory variable (or the independent variable) and BMI (Body Mass Index) is the response variable (or the dependent variable).
- The regression line represents how much and in what direction dependent variable changes with respect to independent variable.
- The line closely approximates all the points.
- The purpose of regression line is make predictions.
IV. DATA VISUALIZATION USING GGPLOT() & GEOM():
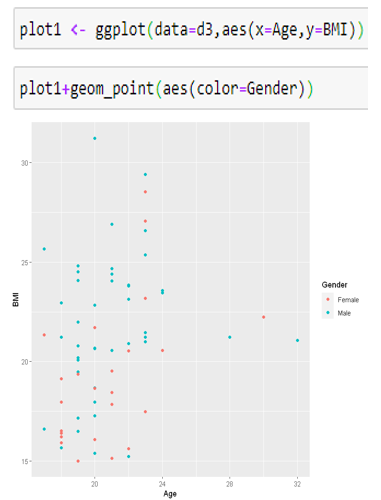
- Plot 1: Age Vs BMI (Body Mass Index)
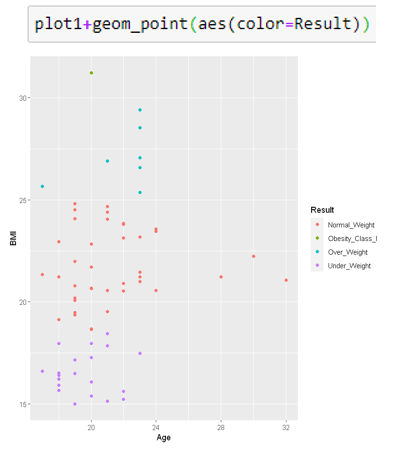
2. Plot 2: Age Vs BMI
Keeping in view the Result (Weight factor)
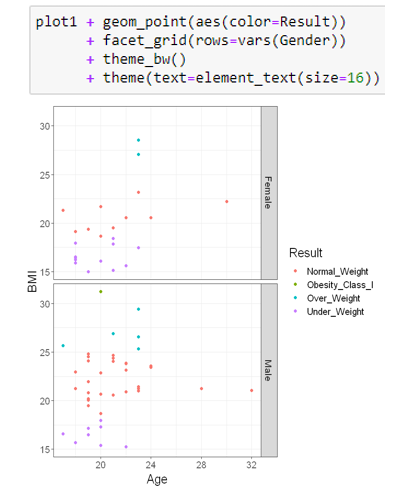
3. Plot 3: Age Vs BMI
Showing separately the data of Male & Female
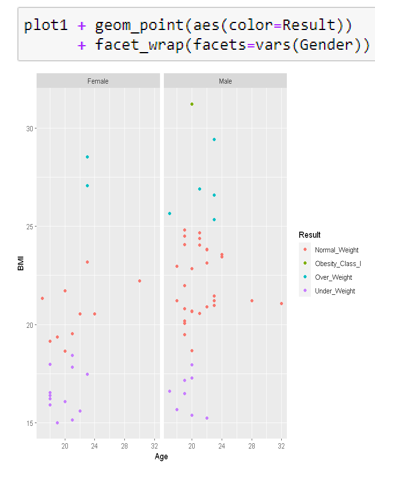
4. Plot 4: Horizontal view of Plot 3
V. RESULTS
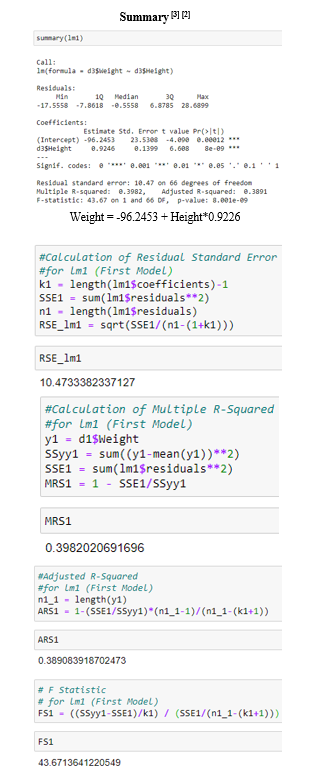
The results of above regression models is [1]
- Weight = -96.2453 + Height*0.9226
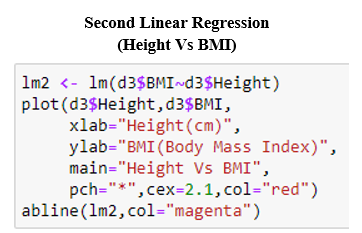
- BMI = 8.32208 + Height*0.07426
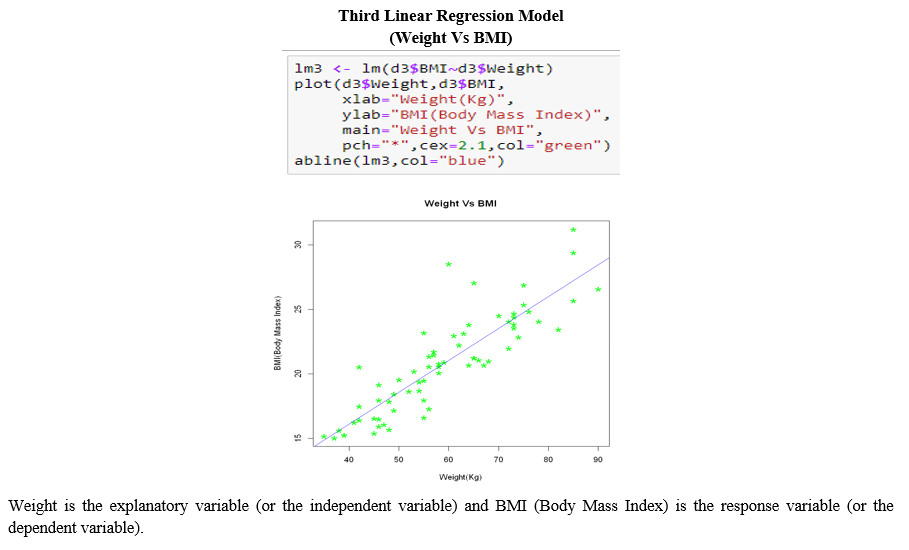
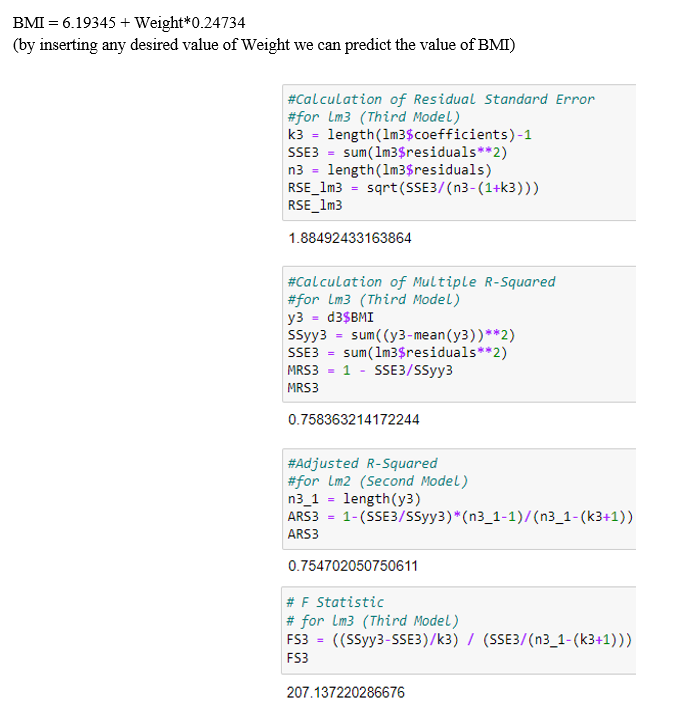
- BMI = 6.19345 + Weight*0.24734
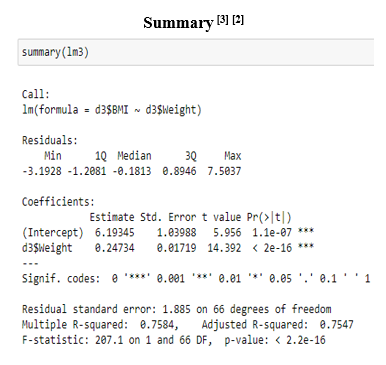
A. Explanation of Summary
- Call is the feature in R that represents what function & parameters were used to create the model[2]
- Residuals represents the difference between observed data of the dependent variable (y) and the fitted values(?) ? = a + bx, where a is y intercept, b is slope of the line and x is independent variable [1]
- In Coefficients four parts are there[2]
- Estimate : gives us intercept and slope regression line
- Std Error : RSE/sq root of sum of squares of x variable
- t value : Estimate/SE
- Pr(>|t|) : Probability of occurrence of t-value
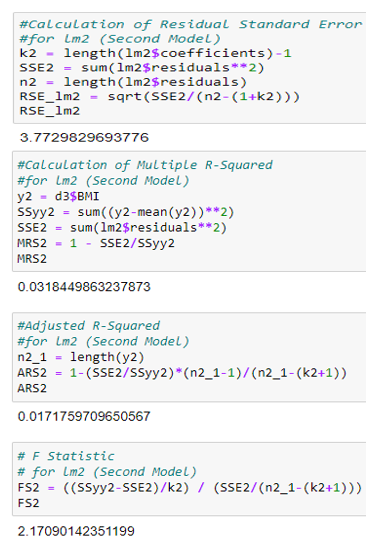
- Calculation of Residual Standard Error, Multiple R-Squared, Adjusted R-Squared & F-Statistic for each model.
- In Plot 4
- Count of Females with Normal Weight are less than that of Males
- No female is there in obese category
- Overweight male candidates are more than those of female candidates
References
[1] https://www.learnbymarketing.com/tutorials/explaining-the-lm-summary-in-r/ [2] https://www.learnbymarketing.com/tutorials/explaining-the-lm-summary-in-r/ [3] Chan YH. Biostatistics 201: Linear regression analysis. Age (years). Singapore Med J 2004;45:55-61. [4] Gaddis ML, Gaddis GM. Introduction to biostatistics: Part 6, correlation and regression. Ann Emerg Med 1990;19:1462-8. [5] Elazar JP. Multiple Regression in Behavioral Research: Explanation and Prediction. 2nd ed. New York: Holt, Rinehart and Winston; 1982. [6] Schneider A, Hommel G, Blettner M. Linear regression analysis: Part 14 of a series on evaluation of scientific publications. Dtsch Arztebl Int 2010;107:776-82. [7] https://www.ncbi.nlm.nih.gov/books/NBK535456/figure/article-18425.image.f1/ [8] https://www.youtube.com/watch?v=XAnilMY-ILs&list=PLpApktzwiFX9UZk5ZijcDuTa9q9MLgWZD [9] https://cran.r-project.org/web/packages/readr/readme/README.html
Copyright
Copyright © 2022 Sukhvir Singh. This is an open access article distributed under the Creative Commons Attribution License, which permits unrestricted use, distribution, and reproduction in any medium, provided the original work is properly cited.

Download Paper
Paper Id : IJRASET40640
Publish Date : 2022-03-05
ISSN : 2321-9653
Publisher Name : IJRASET
DOI Link : Click Here
 Submit Paper Online