

Ijraset Journal For Research in Applied Science and Engineering Technology
Flood Plain Mapping and Identification of Warning Level Prior to Flood for Chalakudy River
Authors: Shinto M D, Chinnamma M . A, Deepa Davis
DOI Link: https://doi.org/10.22214/ijraset.2022.45181
Certificate: View Certificate
Abstract
Flood is one of the most dangerous disasters occur in the world. It endangers the lives of humans and other species. In India one – fifth of the global death rate is happening due to flood. From 2018 June 1 st to August 19 Kerala also experienced a high intense rainfall which results severe flooding. Five million people were affected and 433 people loss their life during this flood. Hence one way to minimize the effect of flood is proper operation of flood forecasting and flood control systems. In this paper we analysed drastic flood situations in Chalakudy river basin during the years 2018 - 2021. Mapping of flood plain of Chalakudy river basin was prepared using HEC – RAS and ARC GIS and initially drowned areas were mapped using Google Earth Engine. Also identified the flood warning level of Chalakudy river and each local bodies based on actual data and field surveys.
Introduction
I. INTRODUCTION
Throughout the history of man, flood is one of the foremost devasting and expensive natural disasters. Flood typically caused intense precipitation, fast snowmelt or tsunami in coastal areas. The impacts caused go so much on the far side the value of broken things within the flood. It threatens the lives and properties of humans and other species. In this paper, we prepared the flood inundation map of Chalakudy river basin with respect to water level by analysing the water level at the river gauge stations and rainfall intensities from the previous records and inundation area found by direct field enquiries. The main scope of this project is to provide a warning system for each local body to evacuate the house holders prior to flood. Other scope of this project is to safeguard the house hold materials from flood by early warning and evacuate only the people that will be affect by flood. It will offer time to manage the condition by the government. It will scale back the value of flood management and relief camp expenses.
II. STUDY AREA
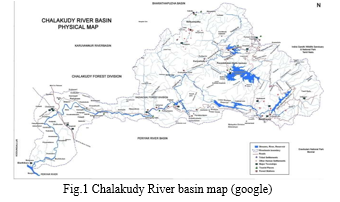
The Chalakudy river basin in Kerala is selected as the study area. Fig.1 shows the physical map of Chalakudy river basin It is the fifth largest river in Kerala with length of 144 km. The river basin is bounded by the Karuvannur sub-basin on the north and the Periyar sub-basin on the south. The basin consists of about 30,000 ha of wet lands. The river basin receives an average rainfall of about 3000 mm. The total drainage area of the river is 1704 sq.km a nd out of this 1404 sq.km lies in Kerala and the rest 300 sq.km in Tamil Nadu. Major tributaries of this west flowing river originate from the Anamalai hills, Parambikulam plateau and Nelliyampathy hills of southern western ghats.
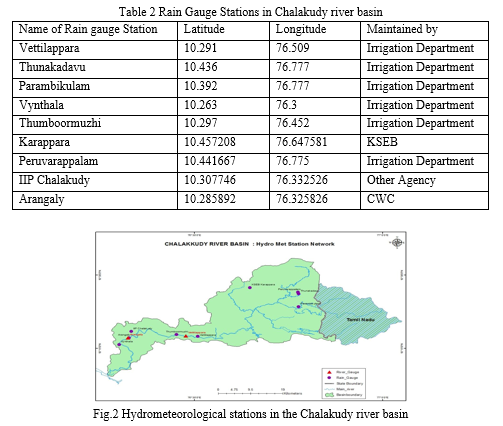
The river and its tributaries have been dammed at six places, Thunakkadavu dam, Peruvaripallam dam, Parambikulam dam, Kerala Sholayar dam, Tamilnadu Sholayar dam and Poringalkuthu dam. The natural hydrological regime in the river altered due to these dams and diversions. Apart from dams and diversion structures, numerous drinking water schemes and lift irrigation schemes are also dependent on the river. Chalakudy river basin having two river gauge stations. One of it is at Vettilappara near silver storm water theme park. it is under Kerala irrigation department. The another one is at Arangalay downstream of Chalakudy bridge near Arangaly manappuram. The exact location of river and rain gauge stations are described in Table1 and Table 2 and a map of hydrological meterological stations are shown in Fig.2.
Table 1 Gauge discharge stations in Chalakudy river basin
|
Name of Station |
Latitude |
Longitude |
Maintained by |
|
Vettilappara |
10.29279 |
76.4777002 |
Irrigation Department |
|
Arangaly |
10.286071 |
76.323631 |
CWC |
III. DATA COLLECTION
The hydraulic modelling of the study area is carried out in HEC-RAS, which requires both basin model as well as meteorological data. Basin model preparation requires inputs including Digital Elevation Model (DEM), land use map. The meteorological data include daily precipitation readings from Vettilappara and Thumboormuzhi rain gauge stations and the discharge data of outlet station. These are required for the analysis and fixing of flood warning level in the Chalakudy river basin and at the local bodies. Also the field survey conducted and questionnaires were prepared to interview the people of the panchayat to record the details of the flood, its intensity, and its impact.
A. Collection of River Gauge Reading from Vettilappara River Gauge Station
For the preparation of flood map with respect to water level at Vettilappara river gauge station, it has been collected river gauge readings from the Chalakudy Hydrology Department for the years 2018, 2019 and 2021 shown in Table.3 From these readings, we tabulate the river gauge reading with respect to the flood happening instance.
Table 3 River gauge reading at Vettilappara at the time of flood in August 2018, 2019 and 2021
|
Date |
Water Level in m |
|
12-10-2021 |
3.13 |
|
18-10-2021 |
2.28 |
|
21-10-2021 |
2.08 |
|
19-10-2021 |
1.80 |
|
08-08-2019 |
4.40 |
|
09-08-2019 |
4.30 |
|
10-08-2019 |
2.70 |
|
11-08-2019 |
2.30 |
|
16-08-2018 |
6.70 |
|
17-08-2018 |
5.10 |
|
15-08-2018 |
3.64 |
|
18-08-2018 |
2.90 |
B. . Collection of rainfall reading corresponds to maximum water level
For fixing the safe flood warning levels, rainfall intensities corresponds to maximum water level at each rain gauge stations have been collected from Chalakudy Hydrology Department for the years 2018, 2019 and 2021 as shown in Table 4.
Table 4. Rainfall intensity corresponds to maximum water level
|
Date |
Rainfall intensity |
||
|
Vettilappara |
Thumboormuzhy |
Vynthala |
|
|
12-10-2021 |
95.3 |
82.4 |
42 |
|
18-10-2021 |
110.2 |
91.4 |
123.8 |
|
19-10-2021 |
5.3 |
7.4 |
2 |
|
21-10-2021 |
62.3 |
15.1 |
16 |
|
08-08-2019 |
75.3 |
65.2 |
40.8 |
|
09-08-2019 |
152.1 |
157.8 |
155.8 |
|
10-08-2019 |
63.2 |
35.9 |
63.2 |
|
11-08-2019 |
111.2 |
116.4 |
122.8 |
|
15-08-2018 |
220.3 |
213 |
196.2 |
|
16-08-2018 |
230.1 |
300 |
- |
|
17-08-2018 |
210.1 |
209.4 |
- |
|
18-08-2018 |
36.2 |
34 |
- |
C. Field Survey
A survey was carried out in the selected local bodies for finding the exact days and time which the flood happens. From the above it has been found out by people interaction the height of water level with respect to time at the time of flood. Then find out the latitude and longitude of the points at which the height of water level that are collected.
From the above data prepared a table showing water level, date, time of flood water of each flood affected area in each local bodies. Finally prepare the inundation map with respect to water level with Google Earth Engine.
D. Materials and Softwares Used
For this study, flood prone areas mapped using HEC – RAS and Arc GIS software. Survey of India Toposheet (SOI Toposheet) used for drawing drainage patterns. Mapping of Initially drawned areas were done using Google Earth Engine software. Survey of India (SOI) Toposheet on 1:50,00 scales used for drawing drainage patterns.
IV. RESULTS AND DISCUSSION
A. Flood Plain Mapping Using HEC-RAS and Arc GIS
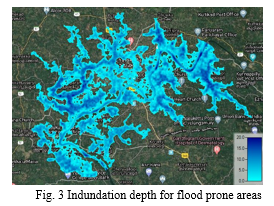
Regarding a flood inundation study the flow depth is the most important output. The flow depth corresponding to the given conditions was obtained as output from HEC- RAS as shown in Fig.3. The inundation depth varies from 0 to 20 m. Higher depths are observed in the channel and it reduces on banks. The terrain elevation is the most important factor that determines the flood inundation. the flood inundation is maximum in the agricultural areas specifically paddy fields which have a low elevation compared to other regions.
B. Preparation of A Flood Map of Initially Drowned Areas in the Chalakudy River Basin at the Panchayat Level Using Google Earth Engine
From the field enquiries and data collected from the hydrology section chalakudy, tabulate results of some places which is affected by flood. separate flood maps were prepared for chalakudy municipality and severly affected Panchayaths within the Chalakudy river basin. The flood affected panchayats and municipality in the Chalakudy River Basin taken for the study were pariyaram, meloor, kadukutty, annamamada, kuzhoor panchayats and chalakudy municipality. The panchayat level flood maps and the flood analysis are detailed below.
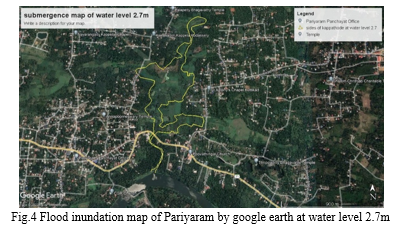
- Pariyaram Panchayat: The flood water level and spatial extent will be documented through the survey along with the duration of flood and rate of water level increase during the period. From the field observation and enquiry, the area which is affected by flood in Chalakudy river basin is very first is at Kammalam. This place is in pariyaram panchayat ward. This place is flooded due to over flows Kappathode which is a tributary of Chalakudy river. This happened when the river gauge reading reached at 2.7 m and the height of indundation was 0.5 m. water level and indundation heights are shown in Table 5 and indundation map of Pariyaram panchayat at water level 2.7 m is shown in Fig.4.
Table 5. Pariyaram panchayat- Water level, date, time and inundation height
|
Date |
Time |
River gauge reading |
Height of inundation |
Description of place |
|
12 /10 /2021 |
5.00 |
2.7 |
.5 |
Pariyaram panchayath Ward 2, kammalam
|
|
12 /10 /2021 |
6.00 |
2.8 |
1.2 |
|
|
12 /10 /2021 |
7.00 |
2.95 |
1.9 |
|
|
12 /10 /2021 |
8.00 |
3.13 |
2.6 |
2. Meloor Panchayat: From the analysis of collected datas and enquiries, 13th ward at Devine colony was the initially drowned area in meloor panchayat which loacted along the banks of chalakudy river. This locality is mainly depending on the water level at Arangaly station. The panchayat is completely surrounded by the river and over of river inundated 16 of the 17 wards in the recent floods. This happened when the river gauge reading reached at 4.51 m and the inundation height was 0.2m. during high intense rainfall when the river gauge reading at 5.75 m, the height of inundation was 1.4 m. River gauge readings and corresponding inundation heights are shown in Table 6.
Table 6 Meloor panchayat- Water level, date, time and inundation height
|
Date |
Time |
River gauge reading at vettilapara station |
River gauge reading at arangaly station |
Height of inundation |
Description of place |
|
08/08/2018 |
3.00 pm |
3.59 |
4.51 |
0.2 |
Ward13,Devine colony,Meloor
|
|
08/08/2018 |
4.00 pm |
3.559 |
5.16 |
1.0 |
|
|
08/08/2018 |
5.00 pm |
3.413 |
5.75 |
1.4 |
|
|
12/10/2018 |
8.00 am |
3.13 |
5.94 |
0.1 |
3. Kadukutty Panchayat: From the field enquiries and surveys, we got a clear idea about the aftereffects of flood in this panchayat. All the roads leading to the locality were washed away by the overflowing waters of Chalakudy river. Kadukutty grama panchayat is mainly depending on the water level at Arangaly station. This area is inundated when the water level reached at 3.96 m and the height of inundation was 0.6m. Table 7 shwos the river gauge readings at two different stations and corresponding height of inundation. From the analysis of data, Valoor bridge, Koratty- Annamanada road in ward 11 was initially drowned on 8th August 2018.
Table 7 Kadukutty panchayat- Water level, date, time and inundation height
|
Date |
Time |
River gauge reading at vettilapara station |
River gauge reading at arangaly station |
Height of inundation |
Description of place |
|
08/08/2018 |
2.00 pm |
3.598 |
3.96 |
0.6 |
|
|
08/08/2018 |
3.00 pm |
3.59 |
4.51 |
1.2 |
Ward 11, valoor bridge, koratty- Annamanada road |
|
08/08/2018 |
4.00 pm |
3.559 |
5.16 |
1.8 |
|
|
12/10/2018 |
8.00 am |
3.13 |
5.94 |
0.1 |
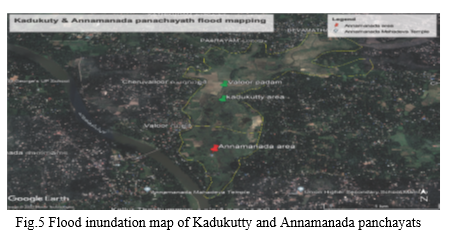
4. Annamanada Panchayat: From the surveys and analysis, it is clear that left bank of Cheruvaloor and upstream side of Pulikakadavu bridge was the initially drowned area. Area inundated when river gauge reading reached 4.26 m at arangaly station and the corresponding inundation height was 0.1 m. Table 8 explains river gauge readings and corresponding inundation heights at vettilappara and arangaly station. Fig.5 shows inundation map of Kadukutty and Annamanada panchayats.
Table 8 Annamanada panchayat- Water level, date, time and inundation height
|
Date |
Time |
River gauge reading at vettilapara station |
River gauge reading at arangaly station |
Height of inundation |
Description of place |
|
12 /10 /2021 |
5.00 am |
2.7 |
4.26 |
0.1 |
u/s of pulikkakadavu bridge left bank cheruvaloor
|
|
12 /10 /2021 |
6.00 am |
2.8 |
5.01 |
0.2 |
|
|
12 /10 /2021 |
7.00 am |
2.95 |
5.55 |
0.4 |
|
|
12 /10 /2021 |
8.00 am |
3.13 |
5.94 |
0.8 |
5. Kuzhur Panchayat: This panchayat was completely submerged in the 2018 floods and initially drowned area was Kunnathumkadu.This area has an agricultural based economy. The Chalakudy River runs along the area.The houses near the wetlands, riverbanks, and paddy fields were inundated with high water levels which had risen more than 5.11 m and the corresponding height of inundation was 0.6 m. The Poringalkuthu reservoir had a major role in the flood levels of the kuzhur panchayat and its surrounding areas. The reservoir was opened unexpectedly on August 14th, 2018 raising the water level in all drainages. The unexpected opening of the Poringalkuthu reservoir made evacuation difficult. The water flow did not follow the meandering path of the river and was diverted resulting in flash floods. Table 9 shows the river gauge readings and corresponding inundation heights at Vettilappara and Arangaly stations.
Table 9 Kuzhur Panchayat-Water level, date, time and inundation height
|
Date |
Time |
River gauge reading at vettilapara station |
River gauge reading at arangaly station |
Height of inundation |
Description of place |
|
14/08/2018 |
3.00 am |
2.701 |
5.11 |
0.6 |
Ward9, kunnathumkadu
|
|
14/08/2018 |
9.00 am |
2.905 |
5.48 |
1 |
|
|
14/08/2018 |
3.00 pm |
4.114 |
5.82 |
2.10 |
|
|
1 /10/2021 |
8.00 am |
3.13 |
5.94 |
0.1 |
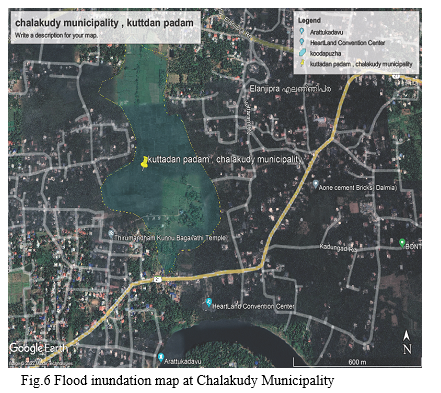
6. Chalakudy Municipality: Chalakudy municipality is mainly depending the water level at Arangaly station. From the analysis it is clear that this area was inundated when the water level reached at 5.11 m at Arangaly station and the corresponding height of inundation was 0.6 m. Table 10 shows the river gauge readings and corresponding inundation heights at Vettilappara and Arangaly stations. Kuttan padam in ward 12 was initially drowned during 2018 flood. Fig.6 shows the flood inundation map at Chalakudy municipality.
Table 10- Chalakudy municipality- Water level, date, time and inundation height
|
Date |
Time |
River gauge reading at vettilappara station |
River gauge reading at arangaly station |
Height of inundation |
Description of place |
|
14/08/2018 |
4.00 pm |
4.20 |
5.11 |
0.6 |
Ward12,kuttadan padam,Chalakudy municipality koodappuzha |
|
14/08/2018 |
5.00 pm |
4.321 |
5.48 |
0.70 |
|
|
14/08/2018 |
6.00 pm |
4.55 |
5.82 |
0.75 |
|
|
12/10/2018 |
8.00 am |
3.13 |
5.94 |
0.2 |
C. Warning Water Levels for Each Panchayat Prior to Flood
By analysing river gauge readings at vettilappara and arangaly stations and data collected through field survey, we can identify and suggest the warning flood levels for each panchayat. This information will be very helpful for local body authority and people for safe evacuation process. Table 11 shows warning water levels for each panchayat prior to flood. In the table, precipitation readings 0-50 mm and 50-200 mm indicates light rain and heavy rain respectively. Table 12 shows warning level of chalakudy river of each river gauge station. Pariyaram was the only panchayat which mainly depends water level at vettilappara station and others are mainly depending water level at arangaly station. At vettilappara station, warning level and dangerous level identified as 2.30 m and 2.70 m respectively. At arangaly station, 4.30 m chosen as warning level and 5.10 m fixed as dangerous level.
Table11 Warning water levels for each panchayat prior to flood
|
Name of local body |
Water level in vettilappara station(m) |
Water level in arangaly station(m) |
Precipitation (mm) |
Water level mainly depends on |
|
Pariyram |
2.5 |
4.3 |
0-50 |
Vettilappara station |
|
2.3 |
4.1 |
50-200 |
||
|
Meloor |
3.0 |
5.9 |
0-50 |
Arangaly station |
|
3.0 |
5.5 |
50-200 |
||
|
Kadukutty |
3.1 |
5.9 |
0-50 |
Arangaly station |
|
3.0 |
5.0 |
50-200 |
||
|
Annamamda |
3.1 |
5.9 |
0-50 |
Arangaly station |
|
3.0 |
5.0 |
50-200 |
||
|
Kuzhur |
3.0 |
5.9 |
0-50 |
arangaly station |
|
2.7 |
4.8 |
50-200 |
||
|
Chalakudy municipality |
3.0 |
6.0 |
0-50 |
Arangaly station |
|
3.0 |
5.5 |
50-200 |
Table 12 Warning level and dangerous water level of Chalakudy river of each river gauge station
|
River gauge station |
Warning level (m) |
Dangerous level(m) |
|
Vettilappara |
2.30 |
2.70 |
|
Arangaly |
4.30 |
5.10 |
V. ACKNOWLEDGMENT
We would like to thank Hydrology Department, Chalakudy and Irrigation Department Chalakudy for providing all required data. And also, we grateful to native people who co operate with us for field survey and data collection.
Conclusion
This study paved the way to found the flood inundated areas and the preparation of the maps of initially drowned areas of each local bodies. These maps and findings will be an asset for future uses in disaster preparedness and land use planning. For collecting required data field survey was conducted and it was very effective. It helps to empower the community involvement. The flood inundation map of Chalakudy River basin was prepared in ArcGIS by modelling the unsteady flow analysis in HEC-RAS and mapping of initially drowned areas was done using Google Earth Engine software.by analysing these results we concluded that Pariyaram grama panchayat area is mainly affected due to the water level at Vettilappara river gauge station and Meloor, Kadukutty, Annamanada, Kuzhur and Chalakudy municipality areas mainly depending water level at Arangaly river gauge station. other objectives of the present study were to identify the warning level of Chalakudy River and also for each local bodies based on actual data and field surveys. At Vettilappara station, warning level and dangerous level identified as 2.30 m and 2.70 m respectively. At Arangaly station, 4.30 m chosen as warning level and 5.10 m fixed as dangerous level. Combination of the above results can aid in the flood mitigation plans, especially because the study area is often experiencing flash floods. These results can be of great use in the review of hydrology of dam located at the upstream reach, designing of new hydraulic structures in the study area and planning proper mitigation strategy. This warning levels can use the local bodies for evacuating the respective people before affecting flood and also avoid unnecessary evacuation. This reduces the damage of men and materials and also the cost of running flood relief camps.
References
[1] G. Sankar, “Monsoon Fury in Kerala — A Geo-environmental Appraisal,” Journal of Geological Society of India, vol.94, pp.383-388, 2018. [2] R. Lougeay, P. Baumann and M. Nellis, “Two digital approaches for calculating,” Geocarto International, vol.9, pp. 53 – 59,1994 [3] P.A. Brivio, J.M. Gregoire and E. Zilioli, “The detection of hydrological indicators in the study of Niger River regime by means of Landsat imageries,” ITC Journal, vol.3, pp.191–199, 1984 [4] P. R Praveen, K. K Vimod, “Flood impact analysis of Kuzhur panchayat, Thrissur District Kerala,” ESRI Conference in Centurion University Assam, May 2022 [5] P. Sunilkumar, K. O Vargheese, “Flood modelling of Mangalam river using GIS and HEC-RAS,” 3rd International Conference on Emerging Trends in Engineering, Technology,Science and Management,2017, paper ISBN:978-93-86-171-48-1
Copyright
Copyright © 2022 Shinto M D, Chinnamma M . A, Deepa Davis. This is an open access article distributed under the Creative Commons Attribution License, which permits unrestricted use, distribution, and reproduction in any medium, provided the original work is properly cited.

Download Paper
Paper Id : IJRASET45181
Publish Date : 2022-07-01
ISSN : 2321-9653
Publisher Name : IJRASET
DOI Link : Click Here
 Submit Paper Online