

Ijraset Journal For Research in Applied Science and Engineering Technology
An Analysis of Growth and Pattern of Revenue and Expenditure in the State of Uttarakhand
Authors: Dr. Kailash Bharti Goswami
DOI Link: https://doi.org/10.22214/ijraset.2022.46156
Certificate: View Certificate
Abstract
The focus of the paper is to examine trends and growth in state government revenue and expenditures in Uttarakhand. In order to perform its functions i.e. social, economic and general government needs funds that have to be garnered from a variety of sources. Revenue and Expenditure plays a very significant role to achieve the major economic goals of growth, stability, equity and efficiency. The revenue and capital receipts, revenue and capital expenditure of the state determine their ability to deliver services. Weaknesses in revenue and expenditure management could constrain the ability of a state to contribute to poverty reduction and economic development. The importance of public revenue has greatly increased during recent times. This paper reviews key trends in public spending and revenue during this period. The result indicates that the revenue and expenditure of the state government increases from 17% to 23% during study period.
Introduction
I. INTRODUCTION
Fiscal policy plays an important part in achieving macroeconomic balance. The adequate fiscal policy has been seen as a necessary instrument used to achieve sustainable growth, price stability and increase in employment in any economy. Public finance is a field of economics concerned with how a government raises money, how that money is spent and the effects of these activities on the economy and society, It studies how government at state and local, provide the public with desired services and how they secure the financial resources to pay for these services. Public finance deals with the finances of public bodies for the performance of their functions. The performance of these functions leads to expenditure. The expenditure is incurred from funds raised through taxes, fees, sale of goods and services and loans. The different sources constitute the revenue of the public authorities. Public finance studies the manner in which revenue is raised; the expenditure is incurred upon different items etc. The state of Uttarakhand has its own receipts but these receipts are very low to meet the expenditure, so the union government gives special category status to state. Due to special status, the state government gets maximum receipts from union government. The receipts of the state broadly categorized into revenue and capital receipts. Revenue receipts are the income generated from the operating activities of the business, which don’t create additional assets while capital receipts are the income generated from investment and financing activities of the business, which create physical or financial assets. Both revenue and capital receipts plays a vital role in the state economy. Uttarakhand is one of the fastest growing states of the India. The State’s economy grew at an annual growth rate of over 10 percent during the last decade. In terms of economic growth, the state’s performance has been above the national average. Karnataka has made notable progress in all sectors during the course of the 11th Plan. As far as overall growth is concerned, the increase in State Income has been satisfactory. When these receipts are used for the growth and development of economy and expends on different sectors. When some expenditure is incurred for the sake of generation of revenue in the current year, this is revenue expenditure. This type of expenditure doesn’t create any productive assets.
II. OBJECTIVES OF THE STUDY
A. To analyze the growth in the revenue and capital receipt of state government from 200001 to 201617
B. To analyze the growth in the revenue and capital expenditure of state government from 200001 to 201617
III. RESEARCH METHODLOGY
The study covers the period 2000-01 to 2016-17 and base on secondary data, which is collected from various issues of statistical diary of Uttarakhand and from budgetary analysis of state revenue and expenditure (NITI Ayog) government of India. The research tools and concepts used for the study include simple percentage, compound growth rate etc.
IV. DATA ANALYSIS & INTERPRETATION
|
Table 1: Total Receipts of the State Government of Uttarakhand |
||||||
|
Year |
Revenue Receipts |
Capital Receipts |
Total Receipts |
|||
|
% |
(Rs. crore) |
% |
(Rs. crore) |
% |
(Rs. crore) |
|
|
2000-2001 |
66.5 |
924 |
33.5 |
465 |
100 |
1389 |
|
2001-2002 |
63.8 |
2733 |
36.2 |
1546 |
100 |
4279 |
|
2002-2003 |
61.8 |
3218 |
38.2 |
1983 |
100 |
5201 |
|
2003-2004 |
59.9 |
3600 |
40.1 |
2404 |
100 |
6004 |
|
2004-2005 |
64.7 |
4086 |
35.3 |
2231 |
100 |
6313 |
|
2005-2006 |
69.4 |
5537 |
30.6 |
2445 |
100 |
7982 |
|
2006-2007 |
86.8 |
7373 |
13.2 |
1120 |
100 |
8493 |
|
2007-2008 |
81.6 |
7891 |
18.4 |
1782 |
100 |
9673 |
|
2008-2009 |
84.6 |
8635 |
15.4 |
1568 |
100 |
10203 |
|
2009-2010 |
70.4 |
9486 |
29.6 |
3989 |
100 |
13475 |
|
2010-2011 |
74 |
11608 |
26 |
4069 |
100 |
15667 |
|
2011-2012 |
83.8 |
13691 |
16.2 |
2638 |
100 |
16329 |
|
2012-2013 |
78.8 |
15747 |
21.2 |
4233 |
100 |
19980 |
|
2013-2014 |
78.7 |
17321 |
21.3 |
4691 |
100 |
22012 |
|
2014-2015 |
76.4 |
20247 |
23.6 |
6240 |
100 |
26487 |
|
2015-2016 |
79 |
26013 |
21 |
6932 |
100 |
32945 |
|
2016-2017 |
81.5 |
32276 |
18.5 |
7336 |
100 |
39612 |
|
Source: Uttarakhand Public Finance Statistics various issues |
||||||
Table 1 shows the amount of total receipts, revenue receipts and capital receipts of the state government of Uttarakhand. Figure 1 exhibits that total receipts, revenue receipts and capital receipts of the state government of Uttarakhand are showing an increasing trend. Total receipts of the state government of Uttarakhand have been continuously increasing since 2000-01. The total receipts of state government in 2000-01 was ? 1389 crore in which the share of revenue receipts was 66.5% and share of capital receipts was 33.5%. The total receipts showed an increasing trend and reached to the line of Rs 9697 crore in 2007-08 from Rs 1389 crore in 2000-01. It showed further increasing trend and reached Rs 39612 crore in 2016-17. Table 2 shows that during 2000-01 to 2007-08, the total receipts of the state government increased at the rate of 27% per annum. From 2008-09 to 2016-17 the total receipts increased at the rate of 16% per annum and during the study period it increases 21% per annum.
Along with the increase in total receipts of the state government of Uttarakhand, the revenue receipts of the state government have also witnessed a rise. Such receipts increased from Rs 924 crore in 2000-01 to Rs 7891 crore in 2007-08. The total receipts increases by 27% from 2000-01 to 2007-08. It constituted 66.5% in 2000-01 of the total receipts of the state government (as shown in Table 1). This percentage declined to 59.9% in 2003-04. The share of revenue receipts in total receipts increased to 86.6% in 2006-07, which reached at highest level, after onwards there were shown fluctuations in revenue receipts. It has been fluctuating from 70% to 85%. The revenue receipts of the state government increased at the rate of 30% per annum from 2000-01 to 2007-08. From 2008-09 to 2016-17 the total receipts increased at the rate of 15% per annum and during the study period it increases 23% per annum.
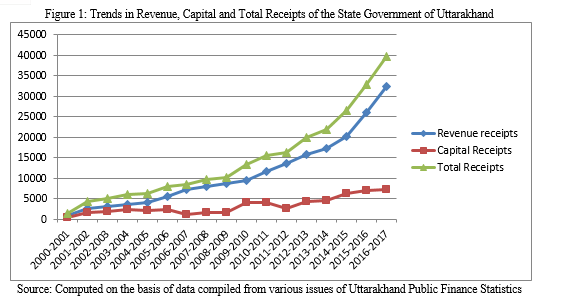
The share of capital receipts in total receipts was 36.2% 2001-02. This percentage rose to 40.1% in 2003-04 and in 2006-07 it declined to 13.1%. The capital receipts of the state government increased from Rs 465 crore in 2000-01 to Rs 2445 crore in 2005-06 mainly because of larger market borrowings, state and public provident funds. It further moved up to Rs 4069 crore in 2010-11 and further declined to Rs 2638 crore in 2011-12. The capital receipts of the state government increased at the rate of 18% per annum from 2000-01 to 2007-08. From 2008-09 to 2016-17 the total receipts increased at the rate of 18% per annum and during the study period it increases 17% per annum.
|
Table 2: Compound Growth Rates of Receipts of the State Government of Uttarakhand (%) |
|||
|
Year |
2000-01 to 2007-08 |
2008-09 to 2016-17 |
2000-01 to 2016-17 |
|
Total Receipts |
27 |
16 |
21 |
|
Revenue Receipts |
30 |
15 |
23 |
|
Capital Receipts |
18 |
18 |
17 |
|
Note: As in Table 1 Source: Computed on the basis of data compiled from various issues of Uttarakhand Public Finance Statistics |
|||
Looking at capital receipts as a proportion of total receipts of the state government, the share of capital receipts showed a fluctuating trend.
|
Table 3: Total Expenditure of the State Government of Uttarakhand |
||||||
|
Year |
Revenue Expenditure |
Capital Expenditure |
Total Expenditure
|
|||
|
% |
(Rs. crore) |
% |
(Rs. crore) |
% |
(Rs. crore) |
|
|
2000-2001 |
82.2 |
914 |
17.8 |
197 |
100 |
1111 |
|
2001-2002 |
85.9 |
2833 |
14.1 |
465 |
100 |
3298 |
|
2002-2003 |
75.8 |
3676 |
24.2 |
1173 |
100 |
4849 |
|
2003-2004 |
70.3 |
4362 |
29.7 |
1845 |
100 |
6207 |
|
2004-2005 |
79.1 |
5036 |
20.9 |
1330 |
100 |
6366 |
|
2005-2006 |
73.2 |
5611 |
26.8 |
2053 |
100 |
7664 |
|
2006-2007 |
76 |
6477 |
24 |
2039 |
100 |
8516 |
|
2007-2008 |
72.7 |
7255 |
27.3 |
2720 |
100 |
9975 |
|
2008-2009 |
77.1 |
8395 |
22.9 |
2493 |
100 |
10888 |
|
2009-2010 |
80.1 |
10657 |
19.9 |
2640 |
100 |
13297 |
|
2010-2011 |
83 |
11621 |
17 |
2389 |
100 |
14010 |
|
2011-2012 |
79.9 |
12975 |
20.1 |
3257 |
100 |
16232 |
|
2012-2013 |
72.6 |
13960 |
27.4 |
5256 |
100 |
19216 |
|
2013-2014 |
75.3 |
16216 |
24.7 |
5307 |
100 |
21523 |
|
2014-2015 |
77.4 |
24352 |
22.6 |
7107 |
100 |
31459 |
|
2015-2016 |
80.7 |
25739 |
19.3 |
6154 |
100 |
31893 |
|
2016-2017 |
81.5 |
29918 |
18.5 |
6809 |
100 |
36727 |
|
Source: Uttarakhand Public Finance Statistics various issues |
||||||
Table 3 shows the amount of total expenditure, revenue expenditure and capital expenditure of the state government of Uttarakhand. Figure 2 exhibits that total expenditure, revenue expenditure and capital expenditure of the state government of Uttarakhand are showing an increasing trend. Total expenditure of the state government of Uttarakhand has been continuously increasing since 2000-01. The total expenditure of state government in 2000-01 was ? 1111 crore in which the share of revenue expenditure was 82.2% and share of capital expenditure was 17.8%.
The total expenditure showed an increasing trend and reached to the line of Rs 9975 crore in 2007-08 from Rs 1111crore in 2000-01. It showed further increasing trend and reached Rs 36727 crore in 2016-17. Table 4 shows that during 2000-01 to 2007-08, the total expenditure of the state government increased at the rate of 31% per annum. From 2008-09 to 2016-17 the total expenditure increased at the rate of 14% per annum and during the study period it increases 22% per annum.
Along with the increase in total expenditure of the state government of Uttarakhand, the revenue expenditure of the state government has also witnessed a rise. Such expenditure increased from Rs 914 crore in 2000-01 to Rs 7255 crore in 2007-08. It constituted 85.9% in 2001-02 of the total expenditure of the state government (as shown in Table 1). This percentage declined to 72.7% in 2007-08.
The share of revenue expenditure in total expenditure increased to 83% in 2010-11, which reached at highest level, after onwards there were shown fluctuations in revenue receipts. It has been fluctuating from 70% to 80%. The revenue expenditure of the state government increased at the rate of 31% per annum from 2000-01 to 2007-08. From 2008-09 to 2016-17 the revenue expenditure increased at the rate of 11% per annum and during the study period it increases 22% per annum ( as in Table 4).
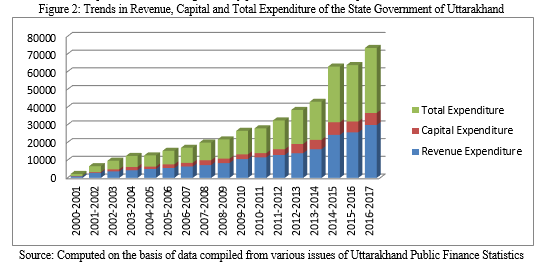
The share of capital expenditure in total expenditure was 17.8% in 2001-02. This percentage rose to 27.3% in 2007-08 and in 2010-11 it declined to 17%. The capital expenditure of the state government increased from Rs 465 crore in 2000-01 to Rs 2445 crore in 2005-06. It further moved up to Rs 2720 crore in 2007-08 and further declined to Rs 2389 crore in 2010-11.
The capital expenditure of the state government increased at the rate of 38% per annum from 2000-01 to 2007-08. From 2008-09 to 2016-17 the capital expenditure increased at the rate of 15% per annum and during the study period it increases 23% per annum ( as in Table 4).
|
Table 4: Compound Growth Rates of Expenditure of the State Government of Uttarakhand (%) |
|||
|
Year |
2000-01 to 2007-08 |
2008-09 to 2016-17 |
2000-01 to 2016-17 |
|
Total Expenditure |
31 |
14 |
22 |
|
Revenue Expenditure |
29 |
11 |
22 |
|
Capital Expenditure |
38 |
15 |
23 |
|
Note: As in Table 2 Source: Computed on the basis of data compiled from various issues of Uttarakhand Public Finance Statistics |
|||
Table 4 shows that during 2000-01 to 2007-08, the total expenditure of the state government increased at the rate of 31% per annum. From 2008-09 to 2016-17 the total expenditure increased at the rate of 14% per annum and during the study period it increases 22% per annum. The revenue expenditure and capital expenditure during 2000-01 to 2007-08, 2008-09 to 2016-17 and 2000-01 to 2016-17 increased at the rate of 29%, 11%, 22% and 38%, 15%, 23% respectively in the state of Uttarakhand.
|
Table 5: Difference in Total Revenue & Expenditure of the State Government of Uttarakhand |
|||
|
Year |
Total Revenue |
Total Expenditure |
Difference |
|
2000-2001 |
1389 |
1111 |
278 |
|
2001-2002 |
4279 |
3298 |
981 |
|
2002-2003 |
5201 |
4849 |
352 |
|
2003-2004 |
6004 |
6207 |
-207 |
|
2004-2005 |
6313 |
6366 |
-53 |
|
2005-2006 |
7982 |
7664 |
318 |
|
2006-2007 |
8493 |
8516 |
-23 |
|
2007-2008 |
9673 |
9975 |
-302 |
|
2008-2009 |
10203 |
10888 |
-685 |
|
2009-2010 |
13475 |
13297 |
178 |
|
2010-2011 |
15667 |
14010 |
1657 |
|
2011-2012 |
16329 |
16232 |
97 |
|
2012-2013 |
19980 |
19216 |
764 |
|
2013-2014 |
22012 |
21523 |
489 |
|
2014-2015 |
26487 |
31459 |
-4972 |
|
2015-2016 |
32945 |
31893 |
1052 |
|
2016-2017 |
39612 |
36727 |
2885 |
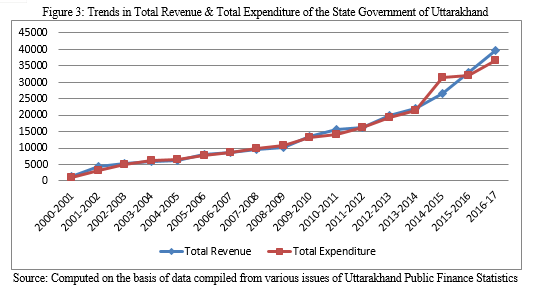
Table 5 shows the difference in total revenue and total expenditure in the economy of Uttarakhand during study period. The trend shows that only some financial years has more expenditure than revenue. In figure 3 the trend line of total revenue and total expenditure coincide with each other, this shows that there is balance in revenue and expenditure in the state of Uttarakhand.
References
[1] Ernest, Kurnow, \"Determinants of State and Local Expenditure, Reexamined\", National ,Jou_J_~1, Vol.XV1, pp.252-254 [2] Gangal and Gupta, “Public Expenditures and Economic Growth – A Case Study of India”, Global Journal of Management and Business Studies, Vol.3, No.2, 2013, pp.191-196 [3] Martin, A. and Arthur Lewis, A.W., \"Pattern of Public Revenue and Expenditure\", The Manchester School of Economic and Social Studies, Vol. XXIV, 1956, pp.102 [4] Niti Ayoug [5] Reserve Bank of India:”State Finances- A Study of Budgets”, RBI Bulletin various issues”. [6] www.rbi.org.in
Copyright
Copyright © 2022 Dr. Kailash Bharti Goswami. This is an open access article distributed under the Creative Commons Attribution License, which permits unrestricted use, distribution, and reproduction in any medium, provided the original work is properly cited.

Download Paper
Paper Id : IJRASET46156
Publish Date : 2022-08-03
ISSN : 2321-9653
Publisher Name : IJRASET
DOI Link : Click Here
 Submit Paper Online