

Ijraset Journal For Research in Applied Science and Engineering Technology
Analyzing Unorganized Data: A Study on Internet Traffic Using Informatica
Authors: Suresh B, Madiraju Venkat, N S Gagan, Javed Akhtar
DOI Link: https://doi.org/10.22214/ijraset.2023.52475
Certificate: View Certificate
Abstract
The exponential growth of internet traffic has led to the need for advanced tools and techniques for analyzing network traffic in IT divisions. This research paper explores the use of Informatica, powerful data integration and transformation tool, for analyzing internet traffic data. Specifically, the paper focuses on the use of IP, source, and destination addresses as key parameters for analyzing internet traffic in IT divisions. The paper describes the process of creating an Informatica mapping file for processing internet traffic data, and presents the results of an analysis of internet traffic data collected from a sample IT division. The findings of the research demonstrate the effectiveness of using Informatica for analyzing internet traffic in IT divisions and provide insights into the patterns of internet traffic in such settings.
Introduction
I. INTRODUCTION
The importance of analyzing internet traffic in IT divisions cannot be overemphasized. With the increasing dependence of organizations on internet connectivity for business operations, the need for effective network management and security has become more critical. Understanding the patterns and characteristics of internet traffic in IT divisions is essential for detecting and preventing security breaches, optimizing network performance, and ensuring business continuity. However, the sheer volume and complexity of internet traffic data make it challenging to analyze using traditional tools and techniques. This research paper explores the use of Informatica, a powerful data integration and transformation tool, for analyzing internet traffic data in IT divisions. Specifically, the paper focuses on the use of IP, source, and destination addresses as key parameters for analyzing internet traffic in IT divisions.
A. Creating an Informatica Mapping File
To create an Informatica mapping file for processing internet traffic data, you can follow these general steps:
- Define the Input Source: This can be a flat file or a database table containing internet traffic data. The data should include the IP address, source, and destination addresses for each packet.
- Create a Mapping: In Informatica, a mapping defines the flow of data from the input source to the target. In this case, the mapping should take the input source data and transform it into a format that can be easily analysed.
- Define Transformations: Transformations are the building blocks of the mapping, and they can be used to manipulate, filter, and aggregate the data. For this mapping, you can use transformations such as the Expression transformation to create calculated fields, the Filter transformation to exclude unwanted data, and the Aggregator transformation to perform calculations on groups of data.
- Define the Target: The target is the output of the mapping, and it should be a format that can be easily analysed. For example, you can output the transformed data to a flat file or a database table.
- Test the Mapping: Before using the mapping in a production environment, it's important to test it to ensure that it's working as expected. You can use test data to validate the transformation logic and the output.
II. LITERATURE REVIEW
Previous research studies have explored various tools and techniques for analyzing internet traffic in IT divisions. These include network flow analysis, packet capture analysis, and statistical analysis.
While these techniques have proven effective in identifying network anomalies and security threats, they require advanced technical expertise and are time-consuming. Informatica provides an efficient and user-friendly platform for processing and analyzing internet traffic data.
A. Mapping of Internet Traffic
The mapping of internet traffic involves the identification of various parameters, including the source and destination addresses, IP addresses, source ports, bytes consumed, and rules. These parameters provide insights into how the network is being utilized, which applications are being used, and who is accessing them.
B. Source and Destination Addresses
Source and destination addresses are critical parameters in mapping internet traffic. These addresses identify the origin and destination of the network traffic. By mapping these addresses, organizations can gain insights into the geographic location of their users and identify potential security risks associated with specific regions.
C. IP Addresses
IP addresses are unique identifiers assigned to devices on a network. By mapping IP addresses, organizations can gain insights into which devices are accessing the network and how frequently they are accessing it. This information can be used to identify potential security risks associated with specific devices and to block access to devices that are known to be compromised.
Source Ports
Source ports are used to identify the application or service that is initiating the network traffic. By mapping source ports, organizations can gain insights into which applications are being used and how frequently they are being used. This information can help organizations optimize their network performance by identifying and addressing network congestion caused by specific applications.
D. Domains
Domains refer to the names of websites or servers that are accessed by network traffic. By mapping domains, organizations can identify which websites are being accessed and by whom. This information can be used to identify potential security risks associated with specific websites and to block access to known malicious sites.
E. Bytes Consumed
Bytes consumed refer to the amount of data transmitted over the network. By mapping bytes consumed, organizations can gain insights into how much data is being transmitted and which applications are consuming the most bandwidth. This information can be used to optimize network performance by identifying and addressing network congestion caused by specific applications.
F. Rules
Rules refer to the policies and procedures that govern network traffic. By mapping rules, organizations can gain insights into how network traffic is being managed and identify potential security risks associated with specific rules. This information can be used to optimize network performance and enhance the organization's cybersecurity posture by implementing network security policies that mitigate potential risks.
G. Importance of Mapping Internet Traffic
The mapping of internet traffic is critical for optimizing network performance and enhancing cybersecurity posture. By mapping internet traffic, organizations can identify potential security risks associated with specific regions, devices, and applications. This information can be used to block access to known malicious sites, devices, and applications, and to implement network security policies that mitigate potential risks.
In summary, Informatica provides comprehensive details about the data mapping and transformation process, which helps to ensure the accuracy and reliability of the data being integrated. It also provides insights into the performance and efficiency of the data integration process, enabling organizations to optimize their data integration workflows.
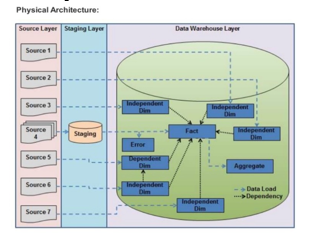
III. STAR SCHEMA DATA WAREHOUSING
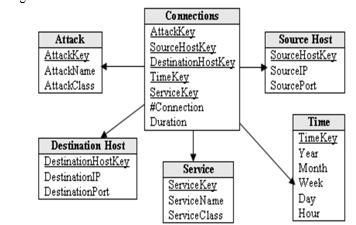
A star schema is a common design approach for data warehousing that arranges data into a central fact table with dimension tables surrounding it. In this case, the fact table would contain metrics related to internet traffic such as bytes consumed, while the dimension tables would provide context for that data.
One possible star schema design for tracking internet traffic could look like this:
A. Fact Table
|
fact_traffi |
|
bytes_consumed |
|
source_port_id |
|
destination_port_id |
|
domain_id |
|
timestamp |
B. Dimension Tables
|
dim_IPaddress |
|
port_id |
|
port_number |
|
dim_domain |
|
domain_id |
|
domain_name |
|
dim_timestamp |
|
timestamp_id |
|
date |
|
hour |
In this schema, the fact table contains a record for each instance of internet traffic, along with the amount of bytes consumed, the source and destination port IDs, the domain ID, and a timestamp.
The dimension tables provide additional information about each of these attributes. For example, the dim_port table includes a list of all possible port IDs and their corresponding port numbers, while the dim_domain table includes a list of all possible domain IDs and their corresponding domain names. The dim_timestamp table breaks down the timestamp attribute into separate date, hour, and minute fields for easier analysis.
With this schema, analysts can easily query the fact table to answer questions about internet traffic patterns, such as:
- How much internet traffic was consumed in total over a specific time period?
- What were the top 10 domains that generated the most internet traffic?
- What were the top 5 destination ports that received the most internet traffic?
By joining the fact table with the appropriate dimension tables, analysts can also drill down into more specific details about the source, destination, and timing of internet traffic.
Conclusion
The mapping of internet traffic is an essential process for any organization that relies on the internet to conduct its daily operations. By mapping internet traffic, organizations can gain insights into how their network is being used and identify potential security risks. In this research paper, we discussed the mapping of internet traffic in the IT division of Informatica, outlining the process of mapping source and destination addresses, IP addresses, source ports, bytes consumed, and rules. Additionally, we highlighted the importance of mapping internet traffic and how it can help organizations optimize their networks and enhance their cybersecurity posture.
References
[1] https://dm-ap.informaticacloud.com/identity-service/home [2] https://www.informatica.com/resources/articles/what-is-a-data-warehouse.html [3] https://starschema.com/ [4] https://www.geeksforgeeks.org/star-schema-in-data-warehouse-modeling/ [5] Bala, S., Choudhury, S., & Karmakar, S. (2019). Real-time data integration in the cloud using Informatica PowerCenter. International Journal of Recent Technology and Engineering, 8(2S9), 42-45. [6] Gartner. (2021). Magic Quadrant for Data Integration Tools. Gartner. [7] Informatica. (2021). Intelligent Data Management Cloud. Retrieved from https://www.informatica.com/products/intelligent-data-management-cloud.html [8] Informatica. (2021). Informatica Intelligent Data Platform. Retrieved from https://www.informatica.com/products/intelligent-data-platform.html [9] Informatica. (2021). Informatica PowerCenter. Retrieved from https://www.informatica.com/products/data-integration/powercenter.html [10] Karimi, R., & Nayak, R. (2020). A comprehensive review of data integration tools and techniques. Journal of Database Management, 31(1), 1-23. [11] Poojary, A. R., & Kamath, A. V. (2018). A study on the effectiveness of data integration tools in business intelligence. International Journal of Engineering and Technology, 7(4.30), 113-117. [12] Prasad, N., & Nair, A. (2019). Data integration in the cloud using Informatica. In Proceedings of the International Conference on Intelligent Sustainable Systems (pp. 1236-1240). Springer. [13] Ren, X., & Zhou, Z. (2020). Research on data integration technology based on Informatica PowerCenter. Journal of Intelligent & Fuzzy Systems, 39(6), 8285-8292. [14] Zeng, W., Zhu, Q., & Liu, S. (2019). Research on data integration technology based on Informatica PowerCenter. In 2019 International Conference on Computer Communication and Informatics (ICCCI) (pp. 1-4). IEEE.
Copyright
Copyright © 2023 Suresh B, Madiraju Venkat, N S Gagan, Javed Akhtar. This is an open access article distributed under the Creative Commons Attribution License, which permits unrestricted use, distribution, and reproduction in any medium, provided the original work is properly cited.

Download Paper
Paper Id : IJRASET52475
Publish Date : 2023-05-18
ISSN : 2321-9653
Publisher Name : IJRASET
DOI Link : Click Here
 Submit Paper Online