

Ijraset Journal For Research in Applied Science and Engineering Technology
LiDAR Based Self-Driving Car
Authors: Vedant Rane, Hrithik Poojari, Prasan Sharma, Soham Phansekar, Prof. Prajakta Pawar
DOI Link: https://doi.org/10.22214/ijraset.2022.41213
Certificate: View Certificate
Abstract
LiDAR, typically used as an acronym for “’light detection and ranging’”, is essentially a sonar that uses pulsed laser waves to map the distance to surrounding objects. It is used by a large number of autonomous vehicles to navigate environments in real time. Its advantages include impressively accurate depth perception, which allows LiDAR to know the distance to an object to within a few centimetres, up to 60 metres away. It’s also highly suitable for 3D mapping, which means returning vehicles can then navigate the environment predictably —a significant benefit for most self-driving technologies. One of the key strengths of LiDAR is the number of areas that show potential for improvement. These include solid-state sensors, which could reduce its cost tenfold, sensor range increases of up to 200m, and 4-dimensional LiDAR, which senses the velocity of an object as well as its position in 3-D space. However, despite these exciting advances, LiDAR is still hindered by a key factor; its significant cost. LiDAR is not the only self-driving detection technology, with cameras as the major rival, championed by Tesla as the best way forward. Elon Musk has described LiDAR as “a fool’s errand” and “unnecessary”. The argument runs that humans drive based only on ambient visible light, so robots should equally be able to. A camera is significantly smaller and cheaper than LiDAR (although more of them are needed), and has the advantage of seeing in better resolution and in colour, meaning it can read traffic lights and signs. However, cameras have a wide host of characteristics that make them tricky to use in common driving conditions. Whereas LiDAR uses near infra-red light, cameras use visible light, and are thus more susceptible to issues when faced with rain, fog, or even some textures. In addition, LiDARs do not depend on ambient light, generating their own light pulses, whereas cameras are more sensitive to sudden light changes, direct sunlight and even raindrops.
Introduction
I. INTRODUCTION
Every year around in the world approx. 1.5 million deaths caused by road accident. Around age 18 or generally the new learner who are just learning how to drive, it’s scary for me to think of the about accident Because what if the Accident occur due to someone else mistake. On the top of that, as we know that amount of traffic, we have it just create the useless/unnecessary frustration for nearly every 9 people out of 10. This was the main reason for deciding our project that is and Self-Driving Car which is also known as autonomous car (A car which can run without Driver or also known as robotic Car). It is a vehicle that is capable of sensing its surrounding and also navigating the input without any help of human. These type of car uses variety of techniques like Lidar, radar, laser light gps computer vision. Due to which this type of car also known as human brain because of the ability to sense the surrounding and also give the input by itself. According to research there have been testing and experiment going on to develop self-driving car for over a 40-45 year. This type of vehicle requires wide range of technologies and infrastructure to operate properly. With the development of technology, there have been driverless cars. It is a concept which is pushed and supported by Google, and various other company. As we know as the Development in technology increases the concern for the technology safety is also increases. the main concern is the security of the car. the way we human drive the car is much different the way robotic brain think like example we say the miscommunication between car and the passenger we human can drive at our own will to make passenger happy but self-driving car will only use the safest and only route which are provided to it. it is difficult to think that if the car makes some kind of mistake like crossing at high speed or ignoring signal because of technology failure how it can correct it mistake on its own. And the second most important concern our that people will never be able to trust the machine as they trust our fellow humans without understanding the logic of the car and how its operate. It is important to understand the issues that surround the logic that has been used in the car. There are many more concern regarding robotic car. here some question i.e. Will it be possible to have changes in the places where the owner of the driverless car wants to go? What if I want to change where I am going? if there any communication barrier how can we communicate with the system or car? For our project we have collected our data from the university of Hesai Inc. and Ford Motor Company as we have decided to work on it i.e., Self-Driving Car by using Lidar to sense the surrounding. We hope the dataset will be useful to the robotics algorithm. Since 2016, self-driving cars have moved toward partial autonomy, with features that help drivers stay in their lane, along with ACC technology and the ability to self-park. Developer of self-driving car use the vast amount of data from various dataset such as image recognition machine learning and neural network to build system which can work in normal surrounding.
II. HISTORY OF SELF-DRIVING CARS
The concept of self-driving or autonomous cars has gained momentum in the last decade. However, it seems that the idea of designing a vehicle that was capable of navigating itself without human input was conceived way back in the Middle Ages. Leonardo da Vinci’s sketches of the self-propelled cart was designed to be powered by coiled springs with programmable steering and braking capabilities. Obviously since then, technology has advanced greatly.Birth of an idea, The first recorded actual attempt towards building a driver-less vehicle can be traced to 1925, when Francis Houdina invented a radio controlled car. The “Phantom Auto,” as it was known then, was controlled through radio signals sent from another vehicle that drove close behind. About a decade later, an industrialist by the names of Norman Bel Geddes conceptualised an automated highway system wherein cars were controlled via electric circuits built into the pavements. This prototype was successfully tested but didn’t take off due to the large financial investment required. During the same time, the Transport and Road Research Laboratory in the UK conceived a similar driverless car and road system that was also successfully tested, and predicted to reduce road accidents and increase road capacity substantially. However, the project was scrapped due to the government’s reluctance to fund the project.
As early as 1925, Francis Houdina exhibited a remote-control car called the American wonder, which drove through the streets of Manhattan. In Europe's early advances [15] in the 1980s, pioneers worked on self-driving technology for more than 40 years, with early vehicles mostly partially autonomous. In the year 1986, Ernst Dickens and his team from the University of Munich created a robotic van that was able to drive fully autonomously without traffic. In 1987, it pushed its speeds up to 60 kilometers per hour. Around the same time in the US, Carnegie Mellon University's Navlab was busy building a steady series of prototypes with ever-improving capabilities. In 1986, their first self-driving vehicle, Navlab1, managed 30 kilometers per hour on the road. Then in 1990, Navlab2, a modified Humvee, performed autonomously both off and on-road.
A. Advancements in the Industry
In 1977, The Tsukuba Mechanical Engineering Laboratory in Japan developed a model that moved away from external road technology and concentrated on making the car smarter. The technology comprised of a computer that studied the surrounding environment using in-built camera imagery. This was considered the first stand-alone autonomous vehicle and was capable of moving at a speed of 20 mph.Then, during the 80’s, a German aerospace engineer used artificial-intelligence, and backed by Mercedes Benz, invented a prototype- VAMORs that could self-drive at high speeds. Constructed using a Mercedes van, it was operated through a computer program that was fed off data collected from inbuilt cameras and sensors autonomy. Inspired by this success, the Eureka Prometheus Project, the largest R&D endeavour in self-driving cars took off in 1987 in Europe where a number of universities and car manufacturers participated. Ernst Dickmanns and his team demonstrated their twin robot vehicles VaMP and VITA-2 autonomous capabilities when they drove 1000 km at speeds of 130 km on the Paris highway.
Meanwhile, similar other attempts were being made in America, notable among these was the Navlab self-driving car system that used a supercomputer, GPS receiver and video equipment to travel close to 3000 miles in 1995. In 2000, the DARPA Grand Challenge was announced, offering one million dollar prize money to anyone who could build an autonomous vehicle to navigate 150 miles through the Mojave Desert. Unfortunately, no one succeeded in completing this challenge. Yet, in 2010 Google announced that they had been working on a secret project testing and developing a system that could help reduce the number of accidents through autonomous driving. Many of the engineers who worked on cars in the DARPA challenge were part of this team. Since then, Google has logged more than one million miles as well as lobbied to help pass legislation and make self-driving cars legal in four US states. Today, there are self-driving cars picking and dropping people in Pittsburg, Phoenix and Boston. Recently, Nvidia in collaboration with Volkswagen, announced a self-driving chip that connects artificial intelligence to production-ready hardware. This is expected to improve the performance of self-driving cars as well as induct attractive features like digital assistants. Although autonomous car technology has come a long way, with cars having highly advanced driver assistance features like Tesla’s Autopilot and Cadillac’s Super Cruise, it still needs to be seen whether regulators will allow the unrestricted use of self-driving cars across the world.
B. Defining Levels Of Automation
Automated driving is not an all-or-nothing proposition. Far from it. Automakers are incrementally adding active safety and self-driving features to their vehicles. These features generally fall into logical groups based on how they combine acceleration and braking (called longitudinal control), and steering (called lateral control). Some features have the exact same functionality, but differ in the degree of human control vs. autonomous system control of the vehicle, so they correspond to different levels of driving automation.
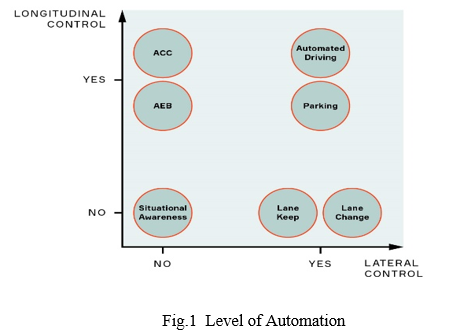
The Society of Automotive Engineers (SAE) developed an industry-standard scale from zero to five to describe this continuum, although there are many gray areas where features might overlap. Here’s what those levels generally mean:
- Level 0: No Automation. The driver is completely responsible for controlling the vehicle, performing tasks like steering, braking, accelerating or slowing down. Level 0 vehicles can have safety features such as backup cameras, blind spot warnings and collision warnings. Even automatic emergency braking, which applies aggressive braking in the event of an imminent collision, is classified as Level 0 because it does not act over a sustained period.
- Level 1: Driver Assistance. At this level, the automated systems start to take control of the vehicle in specific situations, but do not fully take over. An example of Level 1 automation is adaptive cruise control, which controls acceleration and braking, typically in highway driving. Depending on the functionality, drivers are able to take their feet off the pedals.
- Level 2: Partial Automation. At this level, the vehicle can perform more complex functions that pair steering (lateral control) with acceleration and braking (longitudinal control), thanks to a greater awareness of its surroundings. Level 2+: Advanced Partial Automation. While Level 2+ is not one of the officially recognized SAE levels, it represents an important category that delivers advanced performance at a price consumers can afford. Level 2+ includes functions where the vehicle systems are essentially driving, but the driver is still required to monitor the vehicle and be ready to step in if needed. (By contrast, Level 3 represents a significant technology leap, as it is the first level at which drivers can disengage from the act of driving — often referred to as “mind off.” At Level 3, the vehicle must be able to safely stop in the event of a failure, requiring much more advanced software and hardware.) Examples of Level 2+ include highway assistance or traffic jam assistance. The ability for drivers to take their hands off the wheel and glance away from the road ahead for a few moments makes for a much more relaxing and enjoyable experience, so there is strong consumer interest.
- Level 3: Conditional Automation. At Level 3, drivers can disengage from the act of driving, but only in specific situations. Conditions could be limited to certain vehicle speeds, road types and weather conditions. But because drivers can apply their focus to some other task such as looking at a phone or newspaper this is generally considered the initial entry point into autonomous driving. Nevertheless, the driver is expected to take over when the system requests it. For example, features such as traffic jam pilot mean that drivers can sit back and relax while the system handles it all acceleration, steering and braking. In stop-and-go traffic, the vehicle sends an alert to the driver to regain control when the vehicle gets through the traffic jam and vehicle speed increases. The vehicle must also monitor the driver’s state to ensure that the driver resumes control, and be able to come to a safe stop if the driver does not.
- Level 4: High Automation. At this level, the vehicle’s autonomous driving system is fully capable of monitoring the driving environment and handling all driving functions for routine routes and conditions defined within its operational design domain (ODD). The vehicle may alert the driver that it is reaching its operational limits if there is, say, an environmental condition that requires a human in control, such as heavy snow. If the driver does not respond, it will secure the vehicle automatically.
- Level 5: Full Automation. Level 5-capable vehicles are fully autonomous. No driver is required behind the wheel at all. In fact, Level 5 vehicles might not even have a steering wheel or gas/brake pedals. Level 5 vehicles could have “smart cabins” so that passengers can issue voice commands to choose a destination or set cabin conditions such as temperature or choice of media. In April 2021, the SAE published an update to its taxonomy to clarify that Levels 0-2 are “driver support features” because the driver is still heavily involved with the vehicle operation, while Levels 3-5 are “automated driving features.Each level of automation requires additional layers of sensors, as the vehicles increasingly assume functions previously controlled by the driver. For example, a Level 1 vehicle might only have one radar and one camera. A Level 5 vehicle, which must be able to navigate any environment it encounters, will require full 360-degree sensing across multiple sensor types.
III. HOW LiDAR WORKS
LiDAR, or light detection and ranging, is a popular remote sensing method used for measuring the exact distance of an object on the earth’s surface. Even though it was first used in the 1960s when laser scanners were mounted to airplanes, LiDAR didn’t get the popularity it deserved until twenty years later. It was only during the 1980s after the introduction of GPS that it became a popular method for calculating accurate geospatial measurements. Now that its scope has spread across numerous fields, we should know more about LiDAR mapping technology and how it works. What is LiDAR technology and how does it work? Here are a few insights about it that are good to know. Lidar follows a simple principle — throw laser light at an object on the earth surface and calculate the time it takes to return to the LiDAR source. Given the speed at which the light travels (approximately 186,000 miles per second), the process of measuring the exact distance through LiDAR appears to be incredibly fast. However, it’s very technical. The formula that analysts use to arrive at the precise distance of the object is as follows:
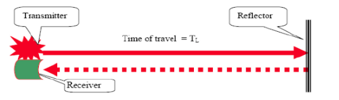
Fig 2.1 Schematic for distance measurement with LiDAR principle. The transmitter and receiver uses laser and photodiode respectively. [Courtesy: Vehicular Electronics Laboratory, Clemson University]
The distance of the object= (Speed of Light x Time of Flight)/ 2
For LiDAR to work effectively, its data must be analyzed. LiDAR data on its own is simply a number of disconnected points in space. But once processed and analyzed, this data will form a consolidated topographical map. LiDAR data is often gathered via sensors placed on vehicles such as UAVs (drones), helicopters, and planes. The method by which LiDAR data is captured does have some impact on its quality. Planes fly much higher than drones or helicopters, and consequently the data will not be as high resolution as it otherwise could be. However, that also means data can be captured much faster. LiDAR differs from the other major surveying method, which is photogrammetry. Under photogrammetry, photos of terrain are taken in quick succession, also often from an aerial vehicle. These photos are then analyzed to create a 3D model. Photogrammetry is not as accurate because it relies on 2D pictures to create a 3D model, but it is fast and cheap, and it does produce models that are usually fairly easy to understand; unlike LiDAR, these photos have color and realistic texture, so it is easy for the untrained eye to recognize things like fields, rivers, and roads. According to the American Geoscience Institute, LiDAR uses a pulsed laser to calculate an object’s variable distances from the earth surface. These light pulses — put together with the information collected by the airborne system — generate accurate 3D information about the earth surface and the target object. There are three primary components of a LiDAR instrument — the scanner, laser and GPS receiver. Other elements that play a vital role in the data collection and analysis are the photodetector and optics. Most government and private organizations use helicopters, drones and airplanes for acquiring LiDAR data.
Types of LiDAR Systems LiDAR systems are divided into two types based on its functionality Airborne LiDAR & Terrestrial Lidar. Airborne LiDAR is installed on a helicopter or drone for collecting data. As soon as it’s activated, Airborne LiDAR emits light towards the ground surface, which returns to the sensor immediately after hitting the object, giving an exact measurement of its distance. Airborne LiDAR is further divided into two types — Topological LiDAR and Bathymetric LiDAR. Unlike Airborne, Terrestrial LiDAR systems are installed on moving vehicles or tripods on the earth surface for collecting accurate data points. These are quite common for observing highways, analyzing infrastructure or even collecting point clouds from the inside and outside of buildings. Terrestrial LiDAR systems have two types — Mobile LiDAR and Static LiDAR. Before last year I didn’t have a faint clue of what LiDAR is, what it does and why it is among the technologies decisively shaping the future. It was while researching about autonomous cars that I got to know about LiDAR – and my immediate reflex was that LiDAR seems to be a lesser-known cousin of the famous Radar. A nondescript member, but in the family after all! And now this obscure cousin was striving to carve a niche away from the shadow of its more distinguished peer, I thought upon learning that LiDAR is being used in everything from laser scanning to 3D Modeling to sensors. No, LiDAR isn’t the cousin of ‘Big Brother’ Radar. But I want to emphasize how the term Radar has been etched in our minds and imagination, so the very first thing that anyone who hasn’t heard LiDAR would relate to is invariably Radar. LiDAR, as we all know, stands for Light Detection and Ranging. It appears to be an acronym just like Radar is for Radio Detection and Ranging. Even someone who flunked his physics tests would confidently argue that instead of radio waves, LiDAR uses light waves (not at all an incorrect reasoning!) and both are apparently acronyms. But apparently is the determiner here. And another old wisdom being ‘appearances are often deceptive’. LiDAR isn’t a short form. But rather a combination of two different words – what’s called portmanteau. Words like motel (motor +hotel) or broadcast ( broad+cast). Brexit (Britain +exit) being another example. Similarly, LiDAR was originally coined as Light + Radar. So it’s a portmanteau rather than an acronym. So while Radar isn’t the big brother or a cousin of LiDAR but etymologically they are literally inseparable. What’s even more interesting and mind-blowing is the fact that the full form of LiDAR was conceived many years later. And unbelievably, when the full form was decided after extensive research into its operational phenomenon, it fitted into the original term which was simply made by combining two words. Facts are stranger than fiction.
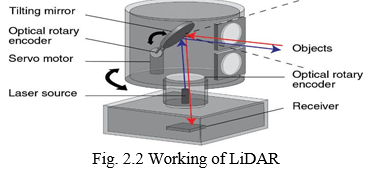
A. Setup and Construction of LiDAR
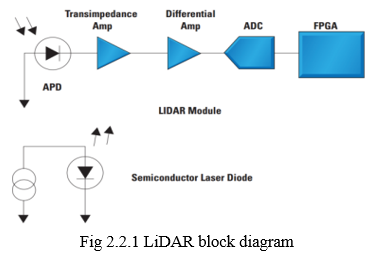
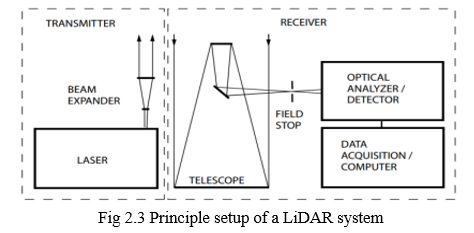
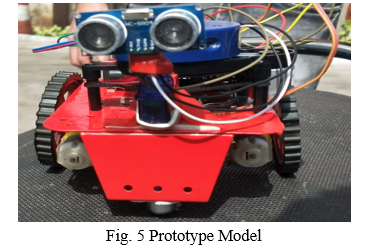
The basic setup of a LiDAR system is shown in Fig. 4, consists of a transmitter and a receiver. Narrow width light pulses in the range of a several hundred nanoseconds and specific spectral properties are generated by the laser. A beam expander can be included in the system within the transmitter unit to reduce the divergence of the light beam before it is sent out into the atmosphere. At the receiver end, a geometrical optical arrangement collects the backscattered photons in the atmosphere. It is usually followed by an optical analyzing system which, depending on the application, selects specific wavelengths or polarization states out of the collected light. The selected optical wavelength radiation is received at the detector where optical signal is converted back into an electrical signal. The signal intensity depends on the time elapsed after the laser pulse emission occurred. The distance of the object is calculated according to electronic time calculation with computer stored data. The 3D construction setup of the available LiDAR sensor is shown in Fig. 5. Most of these devices rely on the use of a single laser emitter/detector pair combined with some type of moving mirror to effect scanning across at least one plane. This mirror not only reflects the emitted light from the diode, but also reflects the return light to the detector. Use of a rotating mirror in this application is a means to achieving typically 90 – 180 degrees of azimuth view while simplifying both the system design and manufacturability, as there is only one moving part, the mirror.
IV. LITERATURE REVIEW
- Ford Campus Vision: They have presented a time-registered vision and navigational data set of unstructured urban environments. They believe that this data set will be highly useful to the robotics community, especially to those who are looking toward the problem of autonomous navigation of ground vehicles in an a-priori un-known environment. The data set can be used as a benchmark for testing various state of the art computer vision and robotics algorithms like SLAM, iterative closest point (ICP), and 3D object detection and recognition.
- The KITTI: In this paper, they have presented a calibrated, synchronized and rectified autonomous driving dataset capturing a wide range of interesting scenarios. We believe that this dataset will be highly useful in many areas of robotics and computer vision. In the future we plan on expanding the set of available sequences by adding additional 3D object labels for currently unlabelled sequences and recording new sequences, for example in difficult lighting situations such as at night, in tunnels, or in the presence of fog or rain. Furthermore, we plan on extending our benchmark suite by novel challenges. In particular, we will provide pixel-accurate semantic labels for many of the sequences.
- Oxford RobotCar : In this paper they have presented the Oxford RobotCar Dataset, a new large-scale dataset focused on long-term autonomy for auto-tonomous road vehicles. With the release of this dataset we intend to challenge current approaches to long-term localisation and mapping, and enable research investigating lifelong learning for autonomous vehicles and mobile robots. In the near future we hope to offer a benchmarking service similar to the KITTI benchmark suite4 providing the opportunity for researchers to publicly compare long-term localisation and mapping methods using a common ground truth and evaluation criteria. We also encourage researchers to develop their own application-specific benchmarks derived from the data presented in this paper, e.g. using the open source structure-from-motion of or the optimisation package of, which we will endeavour to support.
- David Pfeiffer Daimler AG: In this contribution, they presented an improvement of the state-of-the-art 3D Stixel intermediate representation by exploiting stereo confidence information in a probabilistic fashion. It is shown that the intuitive approach to sparsity. The disparity maps based on confidence allows to reduce the false positive rate by a factor of three. Instead of simply ap-plying such a threshold, using confidences in a Bayesian manner yields an additional improvement by a factor of two while maintaining the same detection rate. These find-ings have been obtained from an extensive evaluation over a large database containing more than 76, 000 frames of mostly challenging video material. A subset of this database containing 3D ground truth object data is considered to be made publicly available. The best performing metric “Local Curve”, a quality measure for the sub-pixel curve fit, comes at no extra com-mutational cost. The same holds true for integrating confidence information into the subsequent Stixel processing step. We are convinced that similar improvements can be achieved in other stereo-driven tasks. Future work will further extend the usage of the agger-gated confidence up to the object level. Also, when using Stixels with motion information, the identical concept can be applied for using optical flow confidence information.
- KAIFENG GAO, GANG MEI: In this paper, they have proposed a fast method, which uses a GPU-based parallel IDW interpolation algorithm to impu-tate the incomplete road point cloud datas obtained by IoT technology to enhance the safety of autonomous driving. Two groups of benchmarks have been conducted to evaluate the performance of the proposed method. We have found that:(1) the known point cloud data within 5 meters around the obstacle vehicle are sufficient to guarantee the imputation accuracy; (2) when the weight parameter of the IDW inter-polation is 4, the efficiency and accuracy of the imputationcan be optimally balanced; and (3) it takes approximately 0.6 seconds to imputate the incomplete dataset consisting of 15 million points, while the imputation error is approxi- mately 5 millimeters. The proposed method is capable of effi-ciently and effectively imputating the incomplete road point cloud data that are induced by obstacle vehicles, and outper-forms other interpolation algorithms and machine learning algorithms. The ApolloScape : In this work, they present a large-scale comprehensive dataset of street views. This dataset contains 1) higher scene complexities than existing datasets; 2) 2D/3D annotations and pose information; 3) various annotated lane markings; 4) video frames with instance-level annotations. In the future, we will first enlarge our dataset to achieve one million annotated video frames with more diversified conditions including snow, rain, and foggy environments. Second, we plan to mount stereo cameras and a panoramic camera system in near future to generate depth maps and panoramic images. In the current release, the depth information for the moving objects is still missing. We would like to produce complete depth information for both static background and moving objects
- Argoverse: They focus on the ADE and FDE for a prediction horizon of 3 seconds to understand which baselines are less impacted by accumulating errors. Constant Velocity is out- performed by all the other baselines because it cannot capture typical driving behaviours like acceleration, deceleration, turns etc. NN+map has lower ADE and FDE than NN because it is leveraging useful cues from the vector map.NN+map has lower error than NN+map(oracle) as well, emphasizing the multimodal nature of predictions. LSTM ED does better than NN. LSTM ED+social performs simi-lar to LSTM ED, implying that the social context does not add significant value to forecasting. A similar observation was made on KITTI in DESIRE, wherein their model with social interaction couldn’t outperform the one without it. We observe that LSTM ED+map outperforms all the other baselines for a prediction horizon of 3 sec. This proves the importance of having a vector map for distant fu-ture prediction and making multimodal predictions. More- over, NN+map has a lower FDE than LSTM ED+social and LSTM ED for higher prediction horizon (3 secs). UC Berkeley: In this work, they presented BDD100K, a large-scale driv-ing video dataset with extensive annotations for heteroge- neous tasks. We built a benchmark for heterogeneous multi-task learning where the tasks have various prediction structure and serve different aspects of a complete driving sys-tem. Our experiments provided extensive analysis to different multitask learning scenarios: homogeneous multitask learning and cascaded multitask learning. The results presented interesting findings about allocating the annotation budgets in multitask learning. We hope our work can foster future studies on heterogeneous multitask learning and shedlight in this important direction.
- Carnegie Mellon University: IN this paper, we have studied how the choice of sensor configuration parameters and how various environmental factors affect the performance of visual localization. We conducted an extensive series of experiments using both forward-facing cameras and virtual cameras extracted from panoramic imagery. Using an information-theoretic approach, we established a relationship between the infor- mation content of image regions and the usefulness of those regions for localization. Our findings reflect the intuition that the sides of the road provide the most benefit for lo- calization algorithms. Interestingly, many visual localization and mapping algorithms focus primarily on forward-looking Lidar.
- Ifte Khairul Alam Bhuiyan: The report presented the Light Detection and Ranging (LiDAR) Sensor and its application in autonomous driving as a potential companion for future safety roads. The Velodyne’s HDL-64E is a High Definition Lidar capable of acquiring a large volume of high resolution 3-D data. The HDL-64E features a unique combination of high resolution, broad field of view, high point cloud density and an output data rate superior to any available Lidar sensor in the marketplace today. It is the ideal building block for applications such as autonomous vehicle navigation, infrastructure surveying and mapping display and retrieval, as well as many other applications requiring 3-D data collection. Those of us fortunate enough to be part of the ADAS and. autonomous driving markets understand the critical role that LiDAR will play in vehicles of the future
V. HARDWARE COMPONENTS
A. Atmega 328p
B. Ulta-Sonic sensor
C. LiDAR (range :10 to 20 m)
D. Servo Motor
E. Motor driver
F. Dc motors
G. Arduino
H. LED
I. Push Buttons
J. GPS module
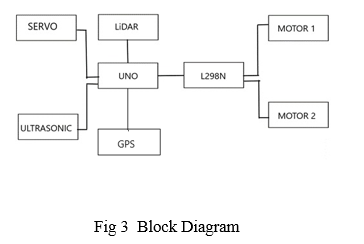
VI. BLOCK DIAGRAM
VII. HARDWARE COMPONENTS CONNECTION
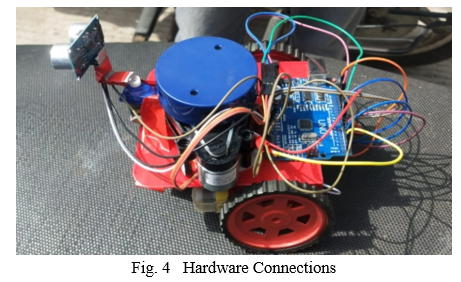
Ultra-sonic trigger is at A2 and echo is A3 in servo motor has three connection VCC, Ground, Output in that VCC and Ground will be connected with the same on the Arduino and the third pin is connected with digital 7 number pin. Lidar has 4 connections, 1 pin is connected with the motor to control the speed of the LiDAR, Tx is connected to digital of Rx, LiDAR has only transmission pin because receiving takes place in serial monitor which is actually shorten with Tx of Arduino. The motor driver has 9V motor. There are two ground pins on the motor, one ground is connected with Uno and other ground is connected with ultra-sonic sensor. There are 4 pins IN1, IN2, IN3 and IN4 connected with Uno pin from 9,10,11,12. IN1 and IN2 are use to control left motor and IN3 and IN4 to control right side motor.
VIII. BENEFITS
The map created by a LiDAR sensor is important for a self-driving vehicle, as it helps the car “see” the world around it. LiDAR technology provides more depth and detail than other solutions, such as radar and cameras. It can also work at night. LiDAR-created map from supplier Ushr that is updated quarterly, which provides the rest of the vehicle’s sensors and computers with the data to drive confidently without much driver intervention. LiDAR fills in the gaps where other sensors struggle. For example, radar is used to detect objects that surround a car, and can determine how far away they are and how fast they’re moving. This is why automakers use radar for parking sensors, blind spot monitors, and adaptive cruise control, but these same sensors struggle when it comes to detecting the exact position, size and shape of an object, elements that are vital for self-driving features like pedestrian, cyclist, and animal detection. Additionally, cameras are used for safety and driver assist systems, as they can recognize objects pretty well, but struggle in low light and with depth perception, where LiDAR fares better.
IX. DISCUSSION
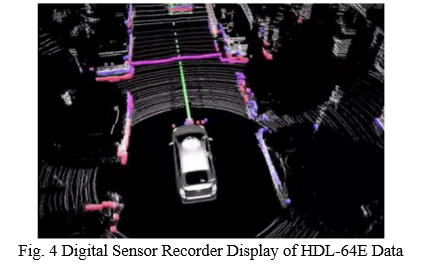
As the LiDAR sensor spins on top of the vehicle the digital data are collection of point clouds from the surrounding. The points come from a single emitter-detector pair over flat ground appears as a continuous circle. The Fig. 1 shows such 3D construction of image recorded with HDL-64E and there are no breaks in the circular data around the car in any of the point clouds. Fig. 1. Digital Sensor Recorder Display of HDL-64E Data This indicates that the laser pulse repetition rate and upper block to lower block duty cycles (emitter and detector arrays) are configured properly for the sensor. A repetition rate that is too slow would result in each of the circles would appear as dotted lines. The only areas of blanking, where there is no data, are between the point clouds or where a shadowing effect occurs, where a target is in the optical transmit path, and thus no information can be obtained from behind the target. The blanking behind the rear bed of the car is an example of this shadowing effect .
X. RESULT
Increasing population is the major issue of transportation nowadays. So, here we have developed an automated driving system which drives the car automatically. Our goal is to help prevent traffic accidents and save people’s time by fundamentally changing car use. We have developed a technology for cars that drives it automatically. We have designed an automated vehicle that is focused to give automated driving experience to the human driver. This car is capable of sensing the surroundings, navigating and fulfilling the human transportation capabilities without any human input. Lidar is used for sensing the surroundings. It continuously tracks the surrounding and if any obstacle is detected vehicle senses and moves around and avoids the obstacle. The advantages of an autonomous car are fewer traffic collisions, increased reliability, increased roadway capacity, reduced traffic congestion. We believe that the autonomous car is a reality shortly and be a necessity of life by overcoming the current obstacles, as human life has to be secured and safe, efficient, cost-effective and comfortable means of transport.
Conclusion
In this paper, we presented the Light Detection and Ranging (LiDAR)Sensor and its application in the autonomous driving as a potential companion for future safety road. Increasing population is the major issue of transportation nowadays. So, here we have developed an automated driving system based on LiDAR which drives the car automatically. Our goal is to help prevent traffic accidents and save people’s time by fundamentally changing car use.
References
[1] asirt.org/Initiatives/ -Road- Users/Road Safety Facts/Road-Crash-Statistics. [2] S. Sivaraman and M. M. Trivedi, “Looking at vehicles on the road: a survey of vision-based vehicle detection, tracking, and behavioranalysis,” IEEE Transactions on Intelligent Transportation Systems, vol. 14, no. 4, pp. 1773–1795, 2013 [3] Autonomous Vehicles, Clemson University Vehicular Electronics Lab [4] National Oceanic and Atmospheric Administration (NOAA) – 2013 [5] Nicolas, C., Inoue, D., Matsubara, H., Ichikawa, T. and Soga, M. (2015), Development of Automotive LIDAR. Electron Comm Jpn, 98: 28–33. doi:10.1002/ecj.11672 [6] J. Carter, K. Schmidt, et al., “An Introduction to Lidar Technology, Data, and Applications”, National Oceanic and Atmospheric Administration (NOAA), US, June 2013. [7] Weitkamp, Claus, ed. Lidar: range-resolved optical remote sensing of the atmosphere. Vol. 102. Springer Science & Business, 2006. [8] “High Definition LiDAR Sensor for 3D Application”, Velodyne’s HDL-64E, White Paper/Oct 2007 [9] P. McCormack., “LIDAR System Design for Automotive / Industrial / Military Applications”, Texas Instruments. [10] LiDAR News Magazine, Vol. 4 No. 6, Copyright 2014 [11] LIDAR for Automotive Application, First Sensor, White Paper, Jan 2012 [12] R. H. Rasshofer and K. Gresser, “Automotive Radar and Lidar Systems for Next Generation Driver Assistance Functions” Advances in Radio Science, 3, 205–209, 2005 [13] Velodyne’s Product manual, LiDAR Comparison chart; downloaded from website in May 2016. [14] [Zhang, 2000] Zhang, Z. (2000). A flexible new technique for camera cali-bration. IEEE Transactions on Pattern Analysis and Machine Intelligence,22(11):1330–1334. [15] https://www.aptiv.com/en/insights/article/what-are-the-levels-of-automated-driving [16] https://www.truebil.com/blog/the-history-of-self-driving-cars [17] https://www.automotiveworld.com/articles/lidars-for-self-driving-vehicles-a-technological-arms-race/
Copyright
Copyright © 2022 Vedant Rane, Hrithik Poojari, Prasan Sharma, Soham Phansekar, Prof. Prajakta Pawar. This is an open access article distributed under the Creative Commons Attribution License, which permits unrestricted use, distribution, and reproduction in any medium, provided the original work is properly cited.

Download Paper
Paper Id : IJRASET41213
Publish Date : 2022-04-04
ISSN : 2321-9653
Publisher Name : IJRASET
DOI Link : Click Here
 Submit Paper Online