

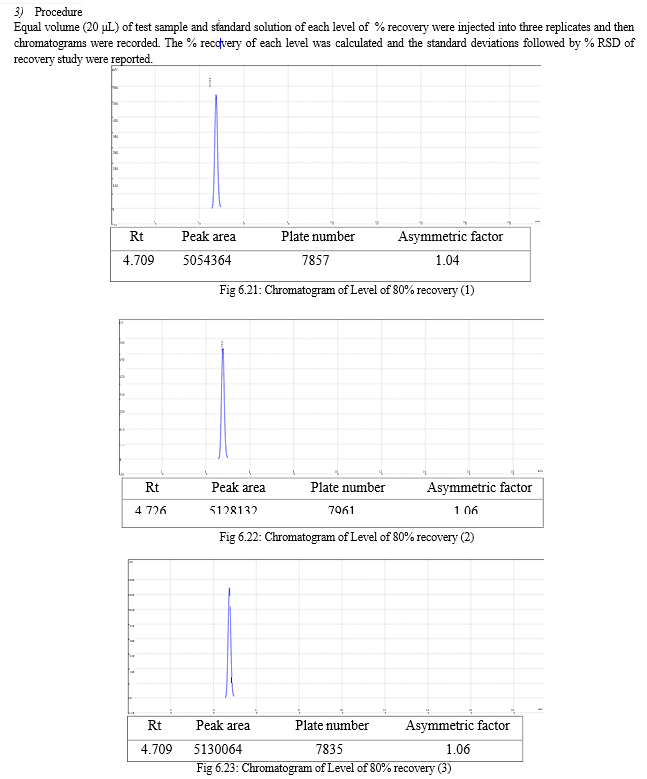
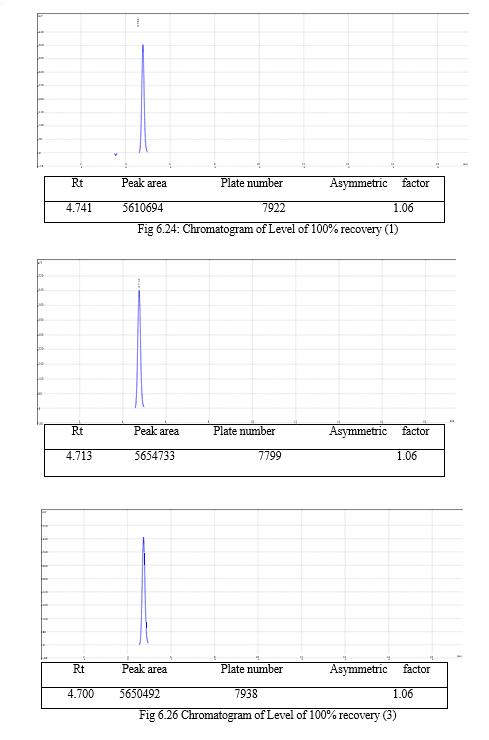
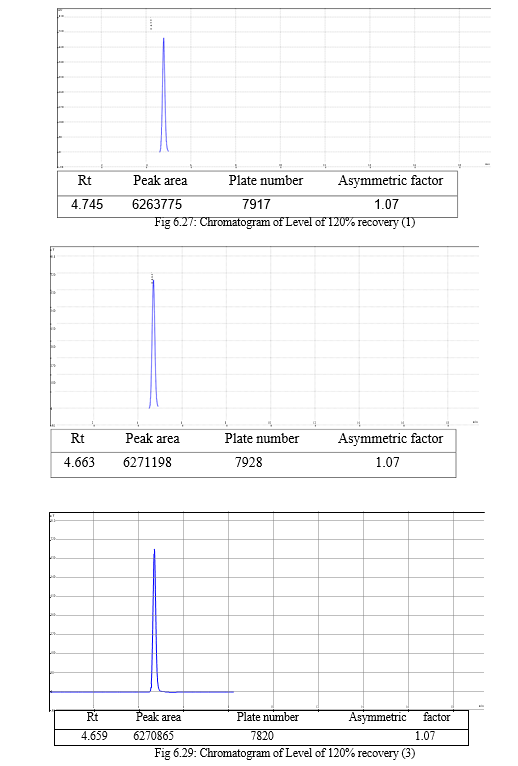
Ijraset Journal For Research in Applied Science and Engineering Technology
Method Development and Validation of Methoxsalen
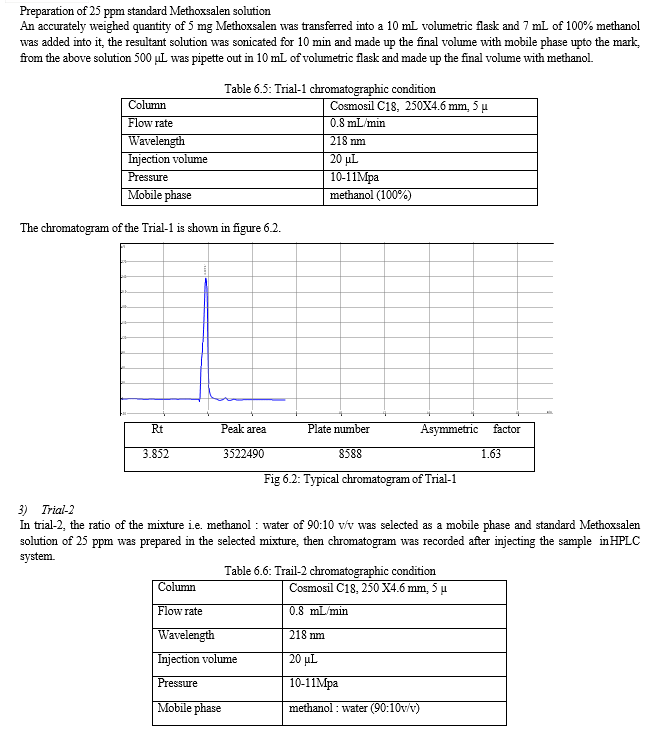
Authors: Bhagyashri Gayke
DOI Link: https://doi.org/10.22214/ijraset.2023.50978
Certificate: View Certificate
Abstract
Introduction
I. INTRODUCTION
Analytical chemistry more simply Analysis is understood as an examination of a chemical substance with the goal of eliciting information regarding its constituents: their character form, quality, or purity and quantity also known as concentration or content. [1] The Analysis is a key element of the advanced technologies in determining and optimizing the concentration of substances by selecting a suitable analytical method. By this, we can obtain both qualitative as well as quantitative analysis. The analytical method may be spectral, chromatographic, electrochemical, hyphenated or miscellaneous. The analytical instrument plays a significant role in the process to achieve high quality and reliable analytical data. [2]
Analytical method development is the process of developing an accurate assay procedure to determine the composition of a formulation or in a bulk of the specified substance. It is the process of proving that an analytical method is acceptable for use in a laboratory to measure the concentration of subsequent samples. Analytical methods should be used within criteria given as per regulatory authorities and must be developed using the protocols and acceptance criteria as per the regulatory guidelines.
A. Basic Equipment used in Analytical Chemistry
In analytical chemistry different types of the basic equipment used for measuring and transferring of solid, liquid and semisolid object according to the need of analysts. For measuring an accurate solid object the mostly use measuring balance such as analytical balance according to specification. The liquid objects measured in measuring cylinder having high accuracy and for transferring of liquid object different pipettes are used having different dimensions. The basic types of equipment are Analytical balance, Measuring cylinders, volumetric flasks, and pipettes, etc [3]
B. Analytical Techniques
Chemical or Physico-chemical processes that provide the basis for analytical measurement are known as analytical techniques. There are numerous chemical or Physico-chemical processes that can be used to provide analytical information. The Atomic, Molecular spectrometry and chromatography together contain the largest and most widely used groups of techniques. [4]
- Classification of Analytical Methods
A. Classical Methods
a. Qualitative - identification by color, indicators, boiling points, odours, etc.
b. Quantitative - mass or volume (e.g. gravimetric, volumetric, etc.)
B. Instrumental Methods
a. Qualitative - Chromatography, Electrophoresis and identification by measuring physical property (e.g. Spectroscopy, Electrode potential, etc.)
b. Quantitative - Measuring property and determining relationship of concentration (e.g. Spectrophotometry, Mass spectrometry, etc.)
C. Chromatography
A variety of methods are available for the separation of components from the mixture and to analyze them. There are a few methods for analysis.
a. Fractional distillation
b. Extraction
c. Fractional precipitation
d. Crystallization
These methods are effective in separation, purification, and identification of many compounds. However, a difficulty arises in case of compounds where individual components have similar physical and chemical properties i.e. the mixture of liquids having very close boiling points, etc. however these methods are not satisfactory in biological materials. Chromatographic methods represent the most useful and powerful technique for these problems. They are used for separation of components of a complex mixture.
Chromatography is a powerful separation technique that is used in all branches of science and these techniques are simple, rapid requires simple apparatus. [5]
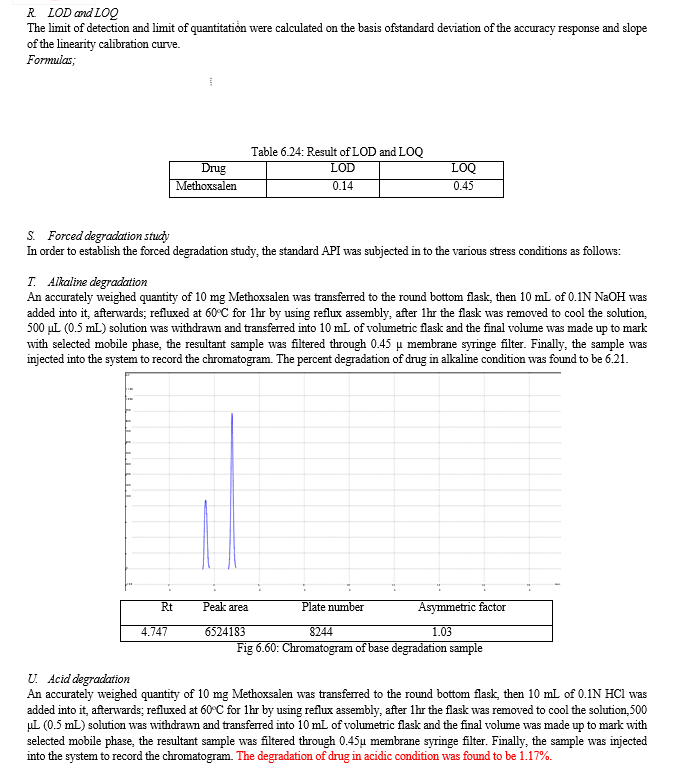
3. History
The term chromatography derived from the Greek word “Chroma” means “color” and “Graphe” means “writing”. Chromatography is a physicochemical method for separation of complex mixtures was discovered at the very beginning of the twentieth century by Russian–Italian botanist M. S. Tswett. In 1903 as he produced a colorful separation of plant pigments through a column of calcium carbonate. Chromatography has since developed into an invaluable laboratory tool for the separation and identification of compounds. Although color usually no longer plays a role in the process, the same principles of chromatography still apply. Chromatography technique developed substantially as a result of the work of Archer John Porter Martin and Richard Laurence Millington Synge during the 1940s and 1950s, for which they won the 1952 Nobel Prize in Chemistry. [6]
4. Types of Chromatography
Basically, the chromatography is classified into several classes according to principles of separation.
a. Adsorption Chromatography
b. Partition Chromatography
c. Ion exchange Chromatography
d. Size exclusion chromatography [7]
Now discussed all the types of chromatography in detailed are as follow,
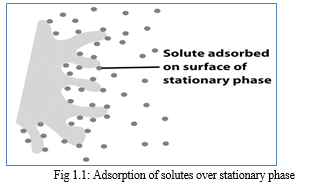
a. Adsorption Chromatography
Adsorption chromatography has a solid stationary phase and a liquid or gaseous mobile phase. The different solutes travelled a different distance through the stationary phase carried along by the solvent. Each solute has its own equilibrium between adsorption onto the stationary phase and solubility into the solvent. The separation depends upon the affinity of solute towards the stationary phase and mobile phase that solute having a greater affinity towards the stationary phase which elutes slowly compared with solutes having a greater affinity toward mobile phase.
b. Partition Chromatography
Partition chromatography has been one of the most significant classes of separation methods since its development by Martin and Synge in the 1940s. All partition chromatography techniques apply the same principle. There are two phases, one is stationary and other is a mobile phase, and the sample is partitioned between these two phases, based on their greater affinity to either one. The mobile phase can be liquid or gaseous.
c. Ion exchange chromatography
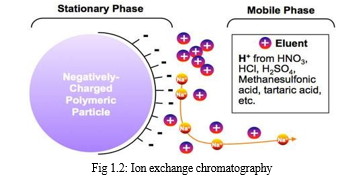
Ion-exchange chromatography may be viewed as a type of adsorption chromatography in which interactions between solute and stationary phase are primarily electrostatic in nature. The stationary phase (ion-exchanger) contains fixed functional groups that are either negatively or positively charged. A sample ion (or charged sites on large molecules) can exchange with the counter-ion to become the partner of the fixed charge. Chromatographic separations by ion exchange are based upon differences in affinity of the exchangers for the ions (or charged species) to be separated. [8]
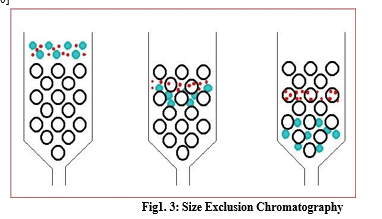
d. Size-Exclusion chromatography
Size exclusion chromatography is also known as Gel filtration. SEC separates molecules in aqueous solution according to their size as they pass through a porous structure. The largest molecule elute first compared to a smaller one. The components which are completely excluded from the gel will not be separated from each other, and similarly, small molecules which completely penetrate the gel will not be separated from the gel. If the substances are of similar chemical type, they are eluted in order of relative molecular mass. [9, 10]
5. Chromatographic methods
The different types of chromatographic methods are developed to separate mixtures and identify compounds.
a. Column chromatography
b. Thin layer chromatography
c. Paper chromatography
d. High-performance thin layer chromatography
e. High-performance liquid chromatography
f. Gas chromatography
g. Ultra performance chromatography
h. Flash chromatography
6. High-Performance Liquid Chromatography
HPLC is also known as High-pressure liquid chromatography, High-performance liquid chromatography, High-price liquid chromatography, High-speed liquid chromatography, High-efficiency liquid chromatography.
HPLC is a modern form of liquid chromatography that uses small particle column through which a mobile phase is pumped at high pressure. This is a chromatographic process, where a mixture of an analyte is separated into its distinct bands as they migrate down the column filled with a stationary phase. HPLC is a dynamic partitioning process of analyte between the flowing liquid and spherical packaging particles. HPLC is used either in the liquid-solid adsorption chromatography mode or the liquid-liquid partitioning chromatography mode, either normal or reverse-phase. Both partition and adsorption chromatography operates on differences in solute polarity since polarity is important in determining both adsorption and solubility. [11]
Modes of HPLC
- Normal Phase chromatography
The separation by this method based on adsorption of the analyte onto a polar stationary phase. The typical stationary phase includes silica, alumina that has a polar hydroxy group on their surface.
2. Reversed phase chromatography
The separation is based on analyte partition coefficient between the polar mobile phase and non-polar stationary phase. Typically stationary phase includes C18 bonded group on silica. [12]
Table 1.1: Modes of Chromatography
|
Mode of chromatography |
Stationary Phase |
Mobile Phase |
|
Normal phase chromatography |
Polar |
Non-polar |
|
Reverse phase chromatography |
Non-polar |
Polar |
Advantages
- It provides a specific, sensitive and precise method for analysis of different complicated samples.
- There is ease of sample preparation and sample introduction.
- There is the speed of analysis.
- The analysis by HPLC is specific, accurate and precise.
- Provides automated operation.
- Quantitative sample recovery.
C. Instrumentation
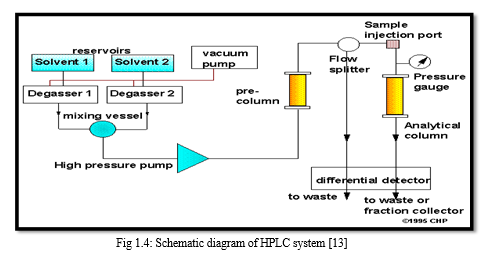
A schematic diagram of the HPLC system is shown in figure 1.4. To attain high flow rates and yet keep the particle size of packing very low (3-10 um), pumping pressures of several hundred atmospheres (2000-8000 psi) are required. Thus the equipment for HPLC is quite elaborate though simple.
D. Mobile Phase Reservoir And Solvent Treatment System
A modern HPLC apparatus is equipped with one or more glass or stainless steel reservoirs, containing 500 ml or more of solvent. The reservoir is often equipped with means of removing dissolved gases usually O2 and N2 that interfere by forming bubbles in the columns and detector system. These bubbles cause band spreading; in addition, they interfere with the performance of the detector. Hence the degassing of the mobile phase is too much importance in HPLC operation. [14]
E. Solvent Degassing methods
There are four main methods used to degas the mobile phase or solvents. They are: sparging with a less soluble gas, heating, reducing pressure by vacuum and sonication. These methods may be used singly or in combination.
a. Sparging (On-line degassing method)
Sparging or bubbling a gas through a solvent reduces the partial pressure of unwanted gas on the surface of the solvent. This will remove unwanted gas from the solution. But it will saturate with the second gas. Sparging with N2 or He will remove background absorbance on a UV detector.
b. Heat (Off- line degassing method)
The first is to raise vapor pressure of the solvent at the surface of the solvent, as the partial pressure of the solvent is raised the partial pressure of a gas is proportionally reduced. This will prevent further absorption of gas into solution. Secondly, heat may reduce the solubility of a gas in solution. However, this method is not recommended when organic solvents are present in the mobile phase.
c. Vacuum (Off-line degassing method)
A vacuum reduces pressure on the surface of the solvent. The mass of gas in solution is proportional to the partial pressure of the gas at the surface of the solvent, so, as the pressure is reduced, the mass of gas in solution is reduced. A recent introduction of degassing techniques is the in-line vacuum degassers. Here the mobile phase is degassed and the air free mobile phase enters the pump directly without any possibility of resaturation of air.
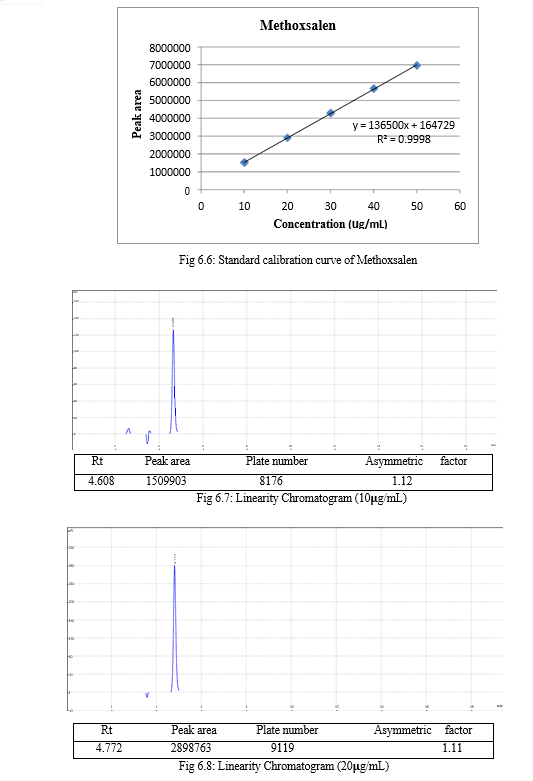
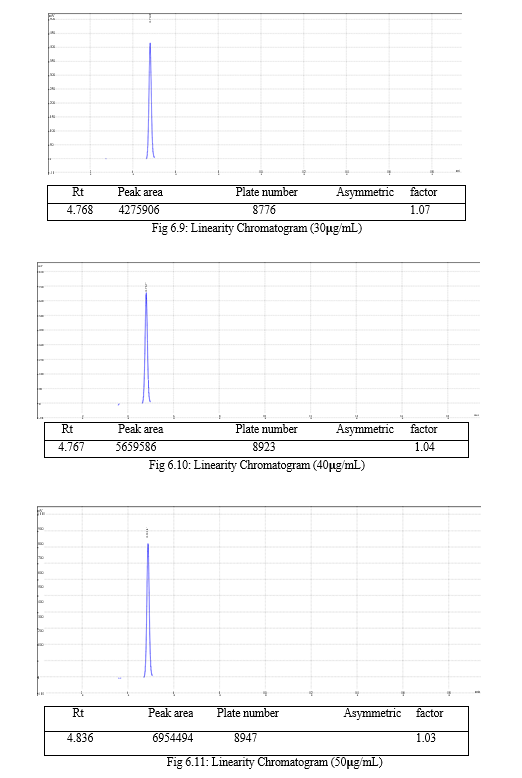
d. Sonication (Off-line degassing method)
Sonication with high energy sound waves drives energy into the solvent and seems to cause aggregation of the submicron-sized particles of gas. As the gas aggregates, the bubble becomes large enough to float out of the solvent and dissipate. Sonication alone will degas a gallon of solvent in approximately
F. Pumps
The pumps are used to pass the mobile phase through the column at high pressure and controlled flow rate. These pumps are necessary to force the liquid through a column with finely packed particles. It should be noted that the high pressures generated by the pumps should not lead to an explosion hazard as a liquid is not very compressible.
Criteria for selection of pumps
- Reproducible mobile phase flow rate ( variation in flow rate shall affect detector sensitivity and interfere with quantitation)
- Baseline pulsation minimum (pulseless flow) to minimize detector noise for trace analysis.
- Suitable for operation at variable pressures (3000-6000 psi).
- Suitable for a wide range of flow rate both for analytical (0.5-2 ml/min) and preparative chromatography (0-10 ml/min).
- Provide a constant flow rate.
- Resistant to chemicals and solvents commonly used in HPLC.
- Adaptable to gradient analysis.
- Suitable for use of small volumes of the mobile phase.
- Protects mobile phase from evaporation.
- Low maintenance cost.
Type of pumps
- Syringe pump ( Screw driven)
- Reciprocating pump
i. Single piston reciprocating pump
ii. Dual piton reciprocating pump
iii. Reciprocating diaphragm pump
3. Pneumatic pimp
i. Direct pressure pump
ii. Amplifier pump
Precautions
- Never store the corrosive solvents or buffers in the pump overnight.
- The pumps with electric motors may require periodic oiling.
- Use the degassed mobile phase.
- Avoid overheating in case of motor driven pumps.
- Do not allow the pump to dry.
Table 1. 1: Pump’s Advantages and Disadvantages
|
Types of pumps |
Advantages |
Disadvantages |
|
Syringe type |
Pulse free delivery at high pressure, flow rate independent of viscosity of MP |
Limited solvent capacity |
|
Reciprocating type |
Constant flow rate, independent of viscosity of solvent |
Detection noise due to pulsating outputs |
|
Pneumatic type |
Rugged, inexpensive, easy to operate, pulse free |
Flow rate dependent on the viscosity of MP, |
Precolumn (saturator column)
One of the factor affecting the life span of an analytical column is the dissolution of base silica due to the condition of pH >8.0 or <2.0, temperature >50oC, concentrated aqueous buffers, and ion-pair reagents. Pre-column fitted between the pump and the injector valve ensures that the mobile phase is fully saturated with silicates ions in pre- column prior to the sample injection. Thus the use of pre-column shall reduce adverse effects of low or high pH mobile phase.
???????G. Sample injectors
Often the limiting factor in the precision of liquid chromatographic measurements lies in the reproducibility where samples can be introduced into the column packing. It must be noted, that overloading of the sample causes band broadening. Therefore a minimum amount of sample must be introduced.
The sample injectors are of the following types,
a. Syringe injection
This is the simplest technique hence the sample is injected through a self-sealing elastomeric septum and the syringes are designed to withstand pressures up to 1500 psi. The disadvantage is that the reproducibility is poor.
b. Stop flow injection
This is too syringe injection but here the solvent flow is stopped momentarily. After removing the fitting at the column head, the sample is injected directly onto the head of the column packing at atmospheric pressure. Then the fitting is replaced ad the system is again pressurized.
c. Solvent flowing
Here sampling valves or loops are used, which inject sample volumes more than 10ul. Currently, this type of injectors is usually used in all automatic system. In the fil position, the sample loop is filled at atmospheric pressure. Actuation of the valve and the sample in the loop occurs at once. Samples in the range of 1-9 ml can be handled without affecting column efficiency.
d. Guard column
The primary purpose of the guard column is to protect expensive analytical columns by removing particulate garbage and strongly irreversible retained sample components which decrease the life span of an analytical column. Guard column is installed between the sample injector and the analytical column. The matching chemistry of guard column with an analytical column is very important. While using RP- C-18 analytical column, it is desirable to use a C-18 guard column.
e. Columns
Columns are often referred to as the heart of HPLC separation process. The stable, high-performance column is an essential requisite for rugged and reproducible method. They are usually constructed from smooth bore stainless steel tubing or heavy walled glass tubing. If prepared from heavy walled glass tubing, then pressure is restricted to lower than 600psi. Occasionally, you may come across coiled columns; but their use is very limited.
Column care
- Do not exceed the pH range from 2-8.5 with silica columns.
- Always avoid dramatic changes in running conditions.
- Always degas and filter the mobile phase.
- Protect your column from contaminants by using a guard column.
- Store the column in pure acetonitrile if possible.
- Increasing back pressure can be taken as a signal to change the guard column.
Table 1.2: Commonly used columns and their Manufacturer [15]
|
Column |
Manufacturer |
|
Adsorbosphere |
Alltech |
|
Alltima |
Alltech |
|
Chromegabond |
ES Industries |
|
Econosil |
Alltech |
|
Lichrosorb |
E. Merck |
|
Novapak |
Waters |
|
Spherisorb |
Waters |
|
Zorbax |
Hewlett Packard |
???????H. Detectors
A detector is the eye of an LC system and measures the compound after their separation on the column. There are basically two types of detectors,
a. The bulk property detectors
b. The solute property detectors
The bulk property detectors function on some bulk property of the effluent, such as refractive index and are not suitable for gradient elution and are usually less sensitive than solute property detectors. The solute property detector performs by measuring some type of physical or chemical property that is specific to the solute only.
Criteria for detectors
- High sensitivity
- Higher linear dynamic range
- Applicable to most of the solutes
- Does not contribute to band broadening
- Non-destructive
- Faster response.[16,]
a. UV- Visible detector
The UV absorbance detector is the most common HPLC detector in use today. The criteria for this detector the analyte should absorb UV light. There are three types of UV detector; fixed wavelength detector and variable and photodiode detector.
b. Fluorescence detector
Fluorescence detector measures the optical emission of light by solute molecules after they have been excited at a higher energy wavelength.
c. Conductivity detector
The conductivity detector is bulk property detector which measures the conductance of mobile phase. The conductance is changed according to the how much solute elutes through mobile phase.
d. Refractive index detector
The refractive index detector is universal bulk property detector and oldest LC detector. RI detector measures the optical refractive index difference between mobile phase and sample. [17]
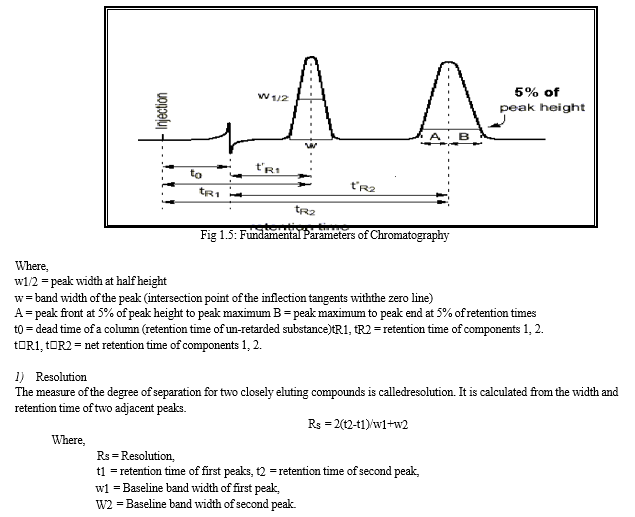
???????I. Fundamental Parameters of HPLC
???????L. UV-Visible Spectrometry
Ultraviolet and visible spectrometers have been in general use for the last 50 years and over this period have become the most important analytical instrument in the modern day laboratory. The alternate title for this technique is ‘Electronic Spectroscopy’ since it involves the promotion of electrons from the ground state to the higher energy state. It is very useful to measure the number of conjugated double bonds and also aromatic conjugation within the various molecules. It also distinguishes between conjugated and non-conjugated systems.
The energy level of the molecule is quantized, the energy required to bring about the excitation is a fixed quantity. Thus, the electromagnetic radiation with only a particular value of frequency will be able to cause excitation. Clearly, if the radiation of a desired or correct frequency is passed or made to fall on the sample of a substance, energy will be absorbed and electron will be promoted to higher energy state. [22]
- Lambert’s law
It states that when a beam of monochromatic radiation passes through a homogeneous absorbing medium, the rate of decrease of intensity of radiation with the thickness of absorbing medium is proportional to the intensity of the incident radiation.
2. Beer’s law
This law states that when a beam of monochromatic radiation is passed through a solution of an absorbing substance, the rate of decrease of intensity of radiation with the thickness of the absorbing solution is proportional to the intensity of incident radiation as well as the concentration of the solution.
3. Chromophore
The term chromophore was previously used to denote a functional group of some other structural features of which gives color to the compound, for example, Nitro group is chromophore because its presence in a compound gives yellow color to the compound. But nowadays the term chromophore is used in a broader sense which defined as “any group which exhibits absorption of electromagnetic radiation in the visible or ultraviolet region and it may or may not impart any color to the compound”.
M. Absorption and intensity shift
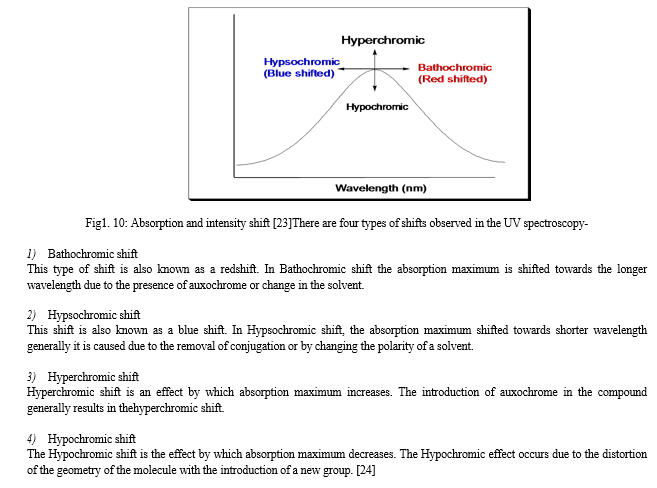
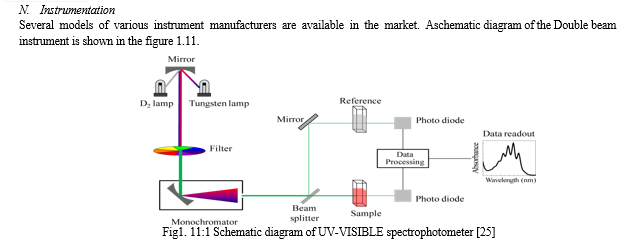
- Source of radiation
For the visible region, tungsten lamp is commonly employed in an instrument it emits continuous, incandescent radiations. For the UV region, a hydrogen or deuterium discharge lamp is used. Some instruments also provide mercury vapor lamps to give intense radiation of specific wavelength both in the UV-visible region.
2. Collimating system
It consists of a lens, mirror, and aperture of entrance slit in the spectrophotometer. This allows a narrow beam of collimated light and directed either on quartz or silica prisms or gratings to render monochromatic radiations.
3. Monochromator
Some instruments make use of prism in the form of a 30o-60o-90o triangle with an apical angle of 30o. This prism has its back aluminized which reflects the refracted ray through litrow mounted prism back to the same collimating mirror at a different height.
4. Sample holder
It is a slot in the instrument which holds test tubes, cuvettes of different size and capacity. The sample tubes are made from good quality glass having uniform transmittance. The tubes or cells are of uniform size, shape and internal diameter. For the study in UV region, the cells or cuvettes are made from quartz.
???????O. Detector
Detector unite is usually a barrier layer cell or a photo-tube. In some instruments, two interchangeable photo-tubes are employed to be useful in the red region and blue region of wavelength. In double beam instruments, two photo-tubes or photomultiplier tubes are employed.
Applications
- Qualitative analysis: UV absorption spectroscopy can characterize those types of compounds which absorb UV radiation. Identification is done by comparing the absorption spectrum with the spectra of known compounds. A record of UV absorption curves is found in certain reference books.
- Quantitative analysis: UV absorption spectroscopy is generally used for the quantitative determination of compounds that absorb UV. This determination is based on Beer’s law.
- Detection of conjugation: It helps to show the relationship between different groups, particularly with respect to conjugation.
- Detection of geometrical isomers: in case of a geometrically isomeric compound, the trans-isomers exhibit higher absorption at a slightly longer wavelength and have extinction coefficients than the cis-isomers.
- Detection of functional groups: it is possible to detect the presence of certain functional groups with the help of the UV spectrum. Even the absence of any absorption above 200nm is of some utility since it shows the absence of conjugation, carbonyl group, and benzene rings in the compound. [26]
???????P. ???????Method Development
Method development is a challenging and time-consuming process requiring much experience, creativity, logical thinking, and experimentation. With all the software and automated system available today, method development is still very much a trial and error approach, expedited by a logical sequence of generic scouting runs and fine- tuning steps to achieve the required resolution and method performance. It is the process of proving that an analytical method is acceptable for use in a laboratory to measure the concentration of subsequent samples. The analytical method should be used within criteria given as per regulatory authorities and must be developed using the protocols and acceptance criteria as per the regulatory guidelines.
Basic criteria for new Method development:
- If the proper analytical procedure for the drug may not be available in the literature.
- Analytical methods for the estimation of the drug in biological fluids may not be available.
- The available method may be complicated or difficult to perform.
- The analytical method for an older drug in a new combination with another drug may not be available.
- The available method analytical procedures require expensive reagents and solvents. It may also involve complicated extraction and separation procedures and these may not be reliable.
- To develop an alternative method to the older method.[27, 28]
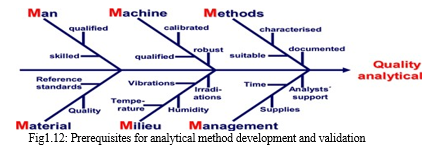
???????Q. Choice of Analytical Method
The analytical method should be chosen considering all the ideal characteristics of drug and applications of the method. The most important is that the method should be less time-consuming. The analytical method should take less time and economical. The accuracy of the analysis in the analytical method must accept the guidelines of Pharmacopoeia.
The following fishbone diagram shows the different types of prerequisites.
???????R. Development of stability indicating assay method
The main purpose of stability indicating assay method development is to identify the changes in the amount of the active pharmaceutical ingredient in the formulation due to degradation when exposed to extreme storage conditions. The stability indicating method is a validated quantitative analytical procedure used to detect how the stability of the drug substances and formulation changes with a period of time intervals. A stability indicating assay method measures the changes in API concentration without interference from other degradation products, impurities, with accuracy.
Following are the steps involved in carrying out degraded studies.
- Step 1: Method Development
The analytical method development is important during the development of drug substance and drug formulations. Method development should be based on various considerations. It is appropriate to have maximum sample information to make an effective development desired for the intended analytical method application and also on available resources for chromatography. [29]
Following are the steps involved in analytical method development
a. Collection of literature
The primary step of Method development or any type of research is a collection of literature. Literature creates a base for method development. All the information, ideal concepts and knowledge creates in researcher mind due to the collection of literature therefore the literature should have a wide range of area.
b. Solubility Study
Perform the solubility experiments to establish the solubility of the API in a number of aqueous and organic solvents like Water, Buffers, 0.1N sodium hydroxide, Methanol, Acetonitrile, Chloroform, Hexane, and Tetrahydrofuran (THF), etc. covering a range of polarities that are commonly used in the method development. The API should have good solubility in the selected diluent.
c. Selection of Chromatographic Technique
According to the nature of a drug molecule and their solubility researcher choose one method for analysis. Which drug is polar in nature and shows solubility in polar solvents then the researcher selects the Reversed-phase chromatography. The second choice is Normal phase chromatography for the drugs which is soluble in non-polar solvents i.e. Non-polar in nature.
d. Selection of Stationary Phase
HPLC column is the heart of the method and critical in performing the separation. The following parameters of the columns should be taken into consideration while choosing the column for the HPLC method:
e. Column Packing Material
- Size and Shape of the particle
- Column length and diameter
- % carbon load
- Pore Volume
- End-capping
For Reverse phase chromatography, a wide variety of the columns are available like C8, C18, Cyano group –CN and amino group like –NH2, etc. As column length changes the column efficiency changes in direct proportion to the ratio of the column length. To select the type of column in the method, conduct the experiments using different columns with different mobile phases to get best possible separation. Based on the experimental data, select the column which gives separation of all the possible impurities and principal peak and which is rugged for the variation in the mobile phase.
f. Selection of Mobile phase
Most separations can be achieved by choosing the optimum mobile phase compositions of the aqueous and organic portions. Most widely used solvent for the reverse phase chromatography is Methanol and Acetonitrile. If the sample is eluted with the mobile phase of 100% organic content, and there is no separation, the solvent strength should be decreased to get the retention. Generally, the increase in organic content will shorten the run time but leads to increased band overlap.
g. Selection of Detector
Various types of detector are used in HPLC. Depending upon the nature of API, relates substances and degraded product, selection of detector has been carried out. In UV the selection of the wavelength is a critical step in the method development. To select the wavelength, prepare the standard solution at the required concentration in the selected solvent and scan it on UV- Spectrophotometer and select the wavelength which shows maximum absorbance by the analyte.
h. Optimization of the method
After selection of the entire factor such as Mobile phase, Stationary phase, Detector and other necessities. The analyte goes for trials of HPLC with different conditions from those trials analyte select one trial condition which shows all factor such as tailing factor, Number of Theoretical plates within accepted limits given by guidelines. This selected trial condition is reported as an optimized method.
2. Step 2: Method validation
Validation is defined as “Documented evidence which gives a high degree of confidence that a process, system, facility will consistently produce a product meeting its predetermined specifications and quality attributes.” Validation is a systematic approach for identifying, measuring, evaluating, documenting and revaluating all critical steps responsible, before establishing the validity of the method. Validation of the analytical method is not only an integral part of the quality system but c-GMP does require assay validation.
Parameters for Method validation:
The parameters for method validation also referred to as “Analytical Performance Parameters” as defined by USP and ICH guidelines are summarized below;
a. Accuracy
The accuracy of an analytical method is the closeness of test results, obtained by that method to the true value. The accuracy of an analytical method should be established across its range. In the case of the assay of a drug in the formulated product, accuracy may be determined by the application of the analytical method to synthetic mixtures of drug product components to which known amount of analyte has been added within the range of the method.
b. Precision
The precision of the analytical method is the degree of agreement among individual test results when the method is applied repeatedly to multiple sampling of a homogenous sample. The precision of an analytical method is usually expressed as the standard deviation or relative standard deviation (coefficient of variation) of a series of measurement.
c. Specificity
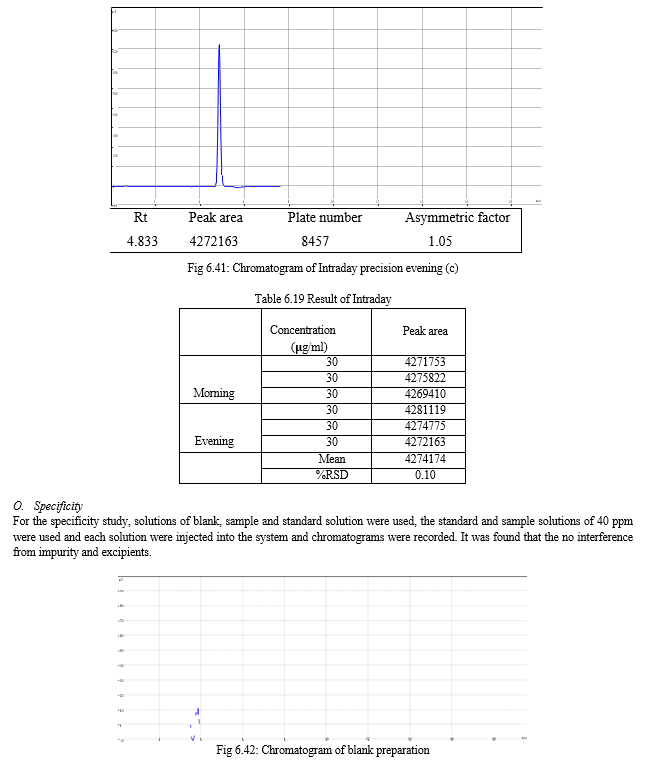
The specificity is the ability to assess unequivocally the analyte of interest in the presence of component that may be expected to be present, such as impurities, degradation products, and matrix components. In the case of an assay, demonstration of specificity requires that the procedure is unaffected by the presence of impurities or excipients. In practice, this can be done by spiking the drug substances or product with appropriate levels of impurities or excipients, and demonstrating that the assay result is unaffected by the presence of these extraneous materials
d. Linearity
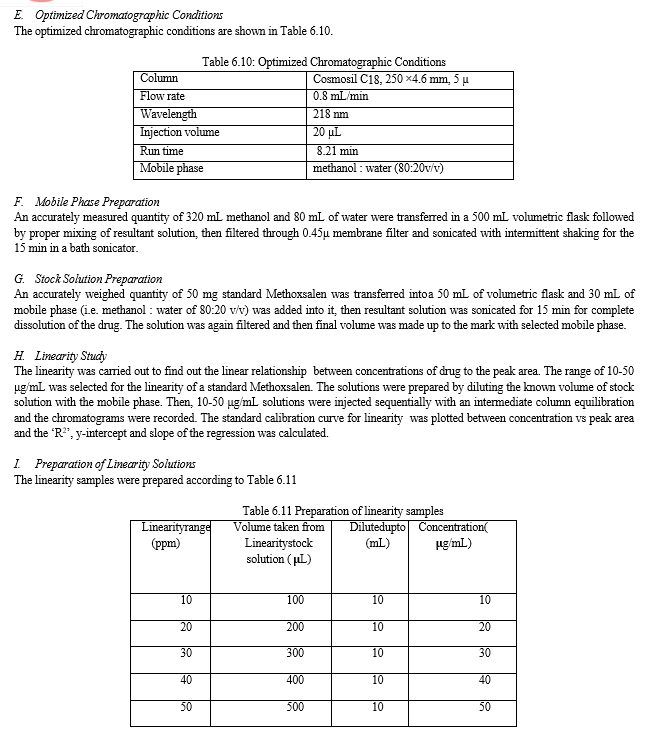
The linearity of an analytical method is its ability to elicit test results that are directly, or by a well-defined mathematical transformation, proportional to the concentration of analyte in a sample within the given range. It should be established across the range of the analytical procedure. Linearity is generally reported as the correlation coefficients, the slope of regression line i.e., r2 ≥ 0.999. The range of the analytical method is the interval between the upper and lower level of analyte that has been demonstrated to be determined with a suitable level of precision, accuracy, and linearity using method written.
e. Limit of Detection
The lowest conc. of the analyte in the sample that the method can detect but not necessarily quantify under the stated experimental conditions simply indicates that the sample is below or above a certain level. Limit test prescribed as a percentage or as parts per million. The limit of detection will not only depend on the procedure of analysis but also on type of instrument.
f. Limit of Quantitation
The limit of quantitation (LOQ) is the lowest amount of analyte in a sample that can be determined with acceptable precision and accuracy under the stated experimental conditions. It is expressed as the conc. of analyte (e.g., percentage, parts per billion) in the sample.
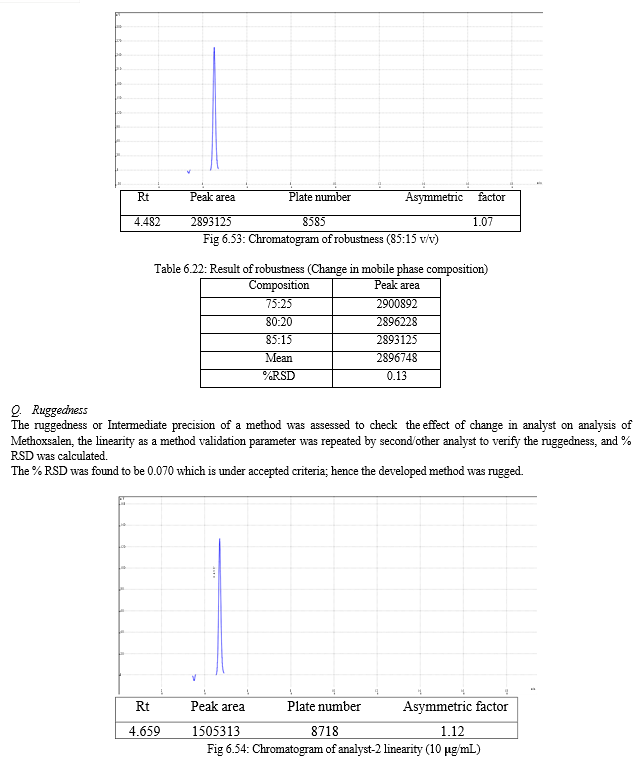
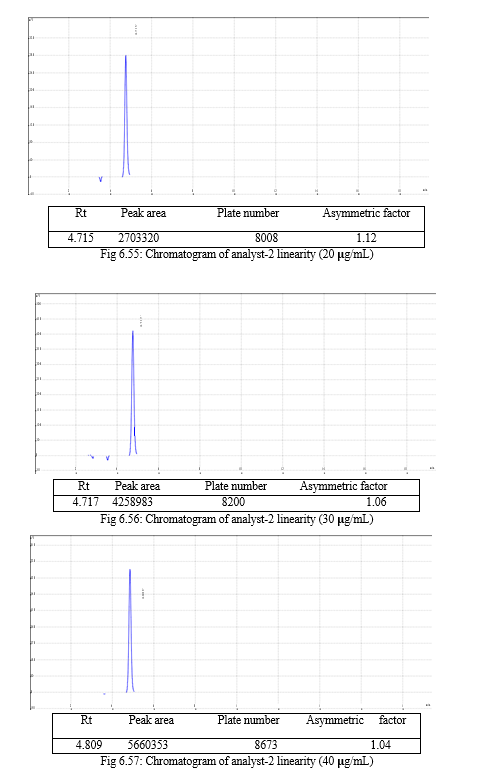
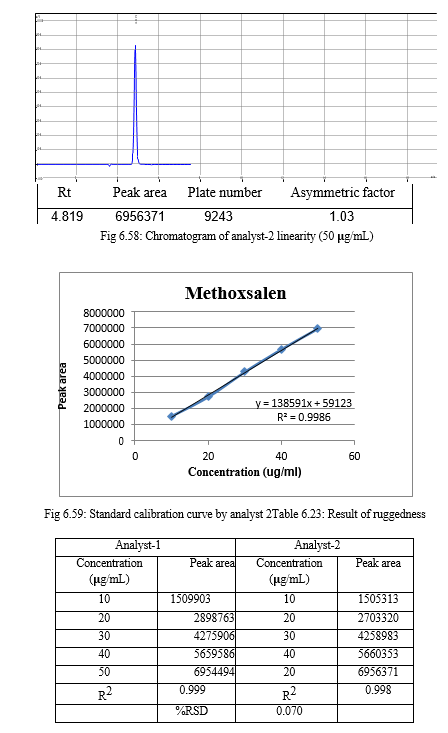
g. Ruggedness
Ruggedness, according to the USP, is the degree of reproducibility of the results obtained under a variety of conditions, expressed as % relative standard deviation (RSD). These conditions include differences in laboratories, analyst, instruments, reagents, and experimental periods.
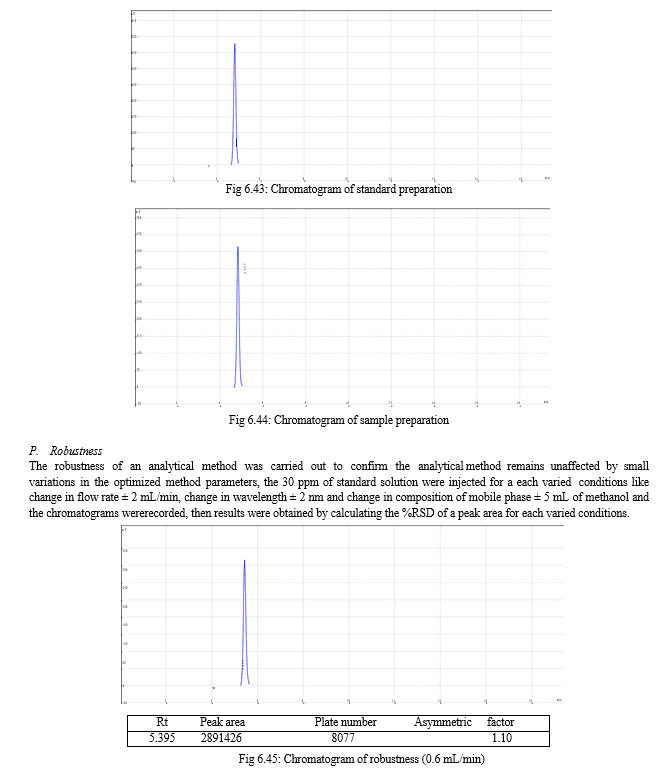
h. Robustness
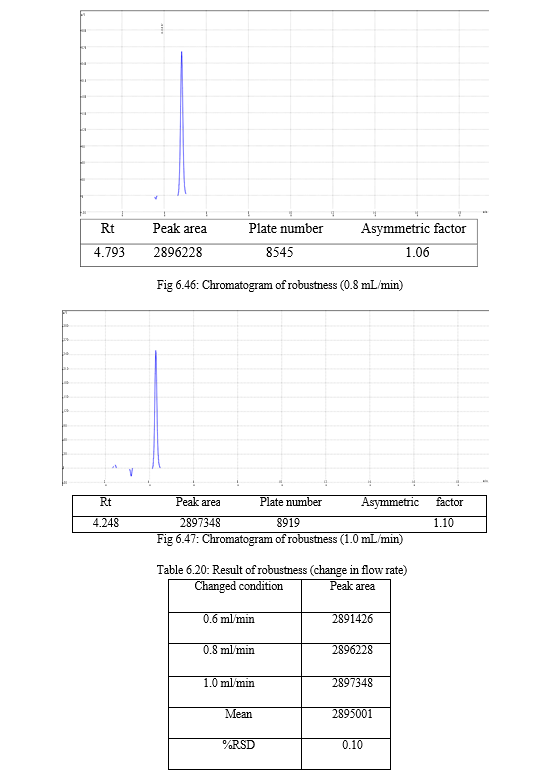
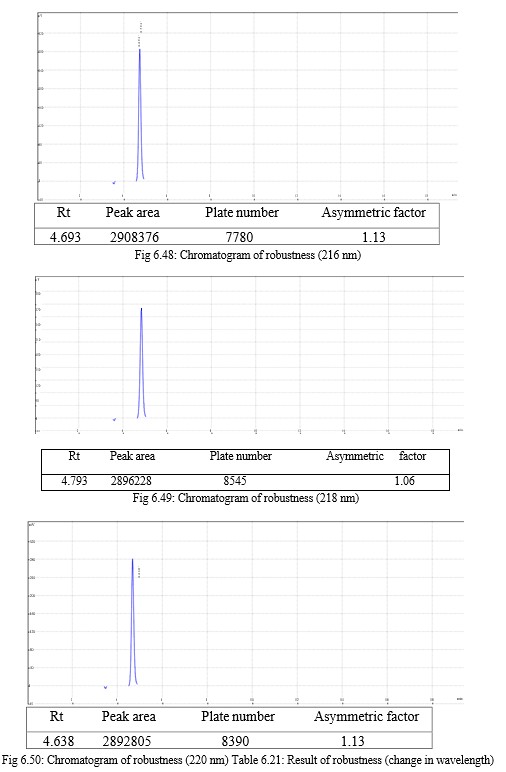
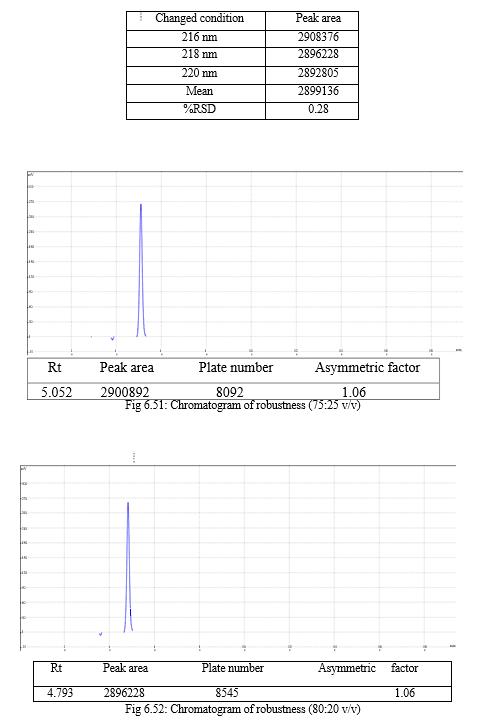
The robustness of analytical method is the measure of its capacity, to remain unaffected by small but deliberate variations in method parameters and provides an indication of its reliability during normal usage. Experiments are performed by changing conditions such as temperature (± 5 0C), buffer pH (± 0.5), and ionic strength of buffers, level of additives to mobile phase. The method must be robust enough to withstand slight changes and allow routine analysis of sample and the %RSD of all the peak areas measure in robustness should not be greater than 2%. [30, 31,32]
Table1.4: Characteristics to be validated in HPLC
|
Characteristics |
Acceptance Criteria |
|
Accuracy/trueness |
Recovery 98-102% |
|
Precision |
RSD < 2% |
|
Repeatability |
RSD < 2% |
|
Specificity / Selectivity |
No interference |
|
Detection Limit |
S/N > 2 or 3 |
|
Quantitation Limit |
S/N > 10 |
|
Linearity |
r2 ≥ 0.999 |
3. Step-3 Forced Degradation
The Forced degradation study is called as stress testing, stress studies, stress degradation studies, forced degradation studies, etc. the forced degradation is a process which involves the degradation of drug substance and formulation at stressed conditions. Thus generates the degradation products that can be studied to determine the stability of the drug molecule. The ICH guideline explains the forced degradation testing is used to identify the degradation products which further helps in the estimation of the intrinsic stability of the drug molecule and establish the degradation pathways and to validate the stability indicating procedures used. [33, 34]
Following are some stress conditions mainly apply to drug and drug products during forced degradation study.
a. Acid Degradation
The hydrolytic degradation of a new drug in acidic conditions can be studied by refluxing the drug in 1N HCl for 1 hrs. If reasonable degradation is perceived, testing can be stopped at that point. However, in case no degradation is seen under these conditions, the drug should be refluxed in the acid of higher strengths and for longer a duration. Alternatively, if total degradation is seen after subjecting the drug to initial conditions, acid strength can be decreased along with a decrease in reaction temperature.
b. Base degradation
The hydrolytic degradation of a new drug in Basic conditions can be studied by refluxing the drug in 1N NaOH for 1 hrs. If reasonable degradation is perceived, testing can be stopped at that point. However, in case no degradation is seen under these conditions, the drug should be refluxed in Base of higher strengths and for a longer duration. Alternatively, if total degradation is seen after subjecting the drug to initial conditions, Base strength can be decreased along with a decrease in reaction temperature.
c. Oxidative degradation
To test for oxidation, it is suggested to use H2O2 in the concentration range 3-30% and duration can be from 2-24 hrs. As a hydrolytic degradation, the reaction temperature can be changed according to the requirement for degradation.
d. Photolytic degradation
It should be carried out by exposure to light using either a combination of cool white and ultraviolet fluorescent lamps or one among the xenon and metal halide lamps. Exposure energy should be a minimum of 1.2 million Lux h fluorescent light and 200 W h/m2 UV and if decomposition is not see the intensity should be increased by five times. In case no decomposition still takes place, the drug can be declaring photostable.
e. Thermal degradation
Stress testing for thermal degradation can be carried out by heating drug powder at 60oC in a hot air oven or on a water bath. The heating time can be increased if more sufficient degradation is not seen in the initial study as well as the heating temperature also increased to achieve sufficient degradation under thermal stress condition. [35, 36, 37]
II. LITERATURE SURVEY
- Chilukuri Jyothi et., al. - have reported a simple, accurate, precise, and economical method for the estimation of Methoxsalen in tablet dosage form. An Inertsil ODS C18, column (250×4.6 mm×5 μ) in isocratic mode with a mobile phase containing Acetonitrile: Tetra hydro furon: 0.01M NaH2PO4 in the ratio of 65:15:25 (v/v/v) was used. The mobile phase flow rate was maintained at 1.0 mL/min and effluents were monitored at 220 nm wavelength. The retention time for Methoxsalen was 4.447 min. The method was validated for parameters give as per ICH guideline. The LOD and LOQ of the developed method were found to be between 0.04 ppm and 0.13 ppm and recovery was about 98.23% from Methoxsalen tablet. This developed method was used for the quantitative estimation of Methoxsalen in tablet formulation.[38]
- Meena Harsahay et., al. - have reported a reliable, accurate and reproducible HPLC method for the simultaneously estimation of four furanocaumarins (Psoralen, isopsoralen, xanthotoxin and bergapten) in Psoralea corylifoia and Ammi majus plants. The furocoumarins were separated simultaneously on a reverse phase Symmetry C8 (150 × 4.6 mm, 5 μ ) column in isocratic method of methanol, acetonitrile and water solution as mobile phase having flow rate at 0.8 mL/min and detected with UV detector. Maximum psoralen and isopsoralen (Angelicin) were recorded in P. corylifolia, whereas maximum 8-methoxypsoralen (xanthotoxin) and 5-methoxypsoralen (bergapten) were found in A. majus. P. corylifolia is a good source of furanocoumarins psoralen and angelicin, whereas A. majus is the good source for 5-Methoxypsoralen and 8- Methoxypsoralen. Hence, both plants can be used in the treatment of Vitiligo and Psoriasis. The isocratic HPLC method was found more suitable, accurate, less time consuming and reproducible method for the estimation of above cited four furanocumarins simultaneously from the P. corylifolia, and A. majus plants.[39]
- Catherine H. Ketchum et., al. – have reported a simple and rapid procedure for assaying 8-Methoxypsoralen (8-MOP) in plasma by High Performance Liquid Chromatography. A C18 10 cm, Spheri-5 Applied Biosystem column with a mobile phase containing Glass distilled Deionized Water: Methanol: Acetonitrile in ratio 65:25:10 (v/v/v) was used. The mobile phase flow rate was maintained at 0.7 mL/min and effluents were monitored at 300 nm wavelength at 250C. Absorption maxima also occur at 254 nm and 215 nm in addition to 300 nm. Although sensitivity is greater at 215 nm or 254 nm, we choose 300 nm as our detection wavelength to reduce interference from plasma. The standard curve for the assay is linear for 8-MOP from 15 to 500 μg/L and extraction recovery of 8-MOP was 98%.[40]
- Nagasarapu Rao et., al. - have reported rapid, specific, and economical stability indicating RP-HPLC method for the estimation of pristinamycin in tablet formulation. Pristinamycin was eluted on the ACE-5, C18 HL (250×4.6 mm, 5μ) column with a mobile phase containing 0.2% orthophosphoric acid and acetonitrile 63.37 v/v. The flow rate maintained at 1.5 mL/min. The column was maintained at 40°C and 10 μl of the solutions were injected. The effluent monitored at 206 nm the overall degradation time for eluting the pristinamycin was found to be less than 10 min for its degraded product. The method was then validated according to the ICH guidelines. The forced degradation studies were performed for pristinamycin bulk to demonstrate the stability-indicating HPLC method. The % RSD of system precision and method precision was found to be 0.64% and 1.49% respectively. The procedure provided a linear response over the concentration range of 25–150 μg/ml (r2 = 0.9998). [41]
- Raghabaendra Singh et., al. - have reported a stability indicating high performance liquid chromatographic method has been developed for the determination of norfloxacin. Optimum separation was achieved by using Phenomenex ODS C18 (250× 4.6 mm packed with 5μ) column. The analyte was resolved by using a mobile phase 20 mmol L-1 ammonium formate and acetonitrile (70:30), pH adjusted to 4.0 with formic acid at flow rate 1 mL/min on an isocratic high performance liquid chromatographic system at a wavelength of 280 nm. The method was shown following parameters according to ICH guidelines as specificity, linearity, accuracy, precision, ruggedness, and robustness and can be successfully applied for the determination of this drug in commercial tablets. For stress studies the drug was subjected to acid, alkali and neutral hydrolysis, oxidation, dry heat and photolytic degradation. The degradation studies indicated the drug to be susceptible to acid, alkali hydrolysis and oxidative degradation. The proposed method not required highly sophisticated and expensive instrumentation.[42]
III. AIM AND OBJECTIVES
A. Aim
The aim of present research work was to develop stability indicating RP-HPLC assay method for estimation of the Methoxsalen.
B. Objectives
The objectives of the research work were-
- To develop a new, simple, precise, accurate and economical RP-HPLC method for estimation of the Methoxsalen in the formulation.
- To perform the forced degradation study for the Methoxsalen.
- To estimate the percentage of degraded product from the Methoxsalen.
- To validate stability indicating RP-HPLC assay method as per ICH guidelines.
IV. PLAN OF WORK
- Literature survey
- Selection of Drug
- Procurement of Drug and Marketed formulation
- Method Development
- Solubility study
- Selection of wavelength
- Selection of Mobile phase
- Trials
- Optimization of chromatographic condition
- Estimation of methoxsalen in marketed formulation
- Method validation
- Linearity
- Precision
- Accuracy
- Specificity
- Robustness
- Ruggedness
- Limit of Detection (LOD)
- Limit of Quantification (LOQ)
8. Forced Degradation Study
- Acid Degradation
- Base Degradation
- Oxidative Degradation
- Thermal Degradation
V. DRUG PROFILE
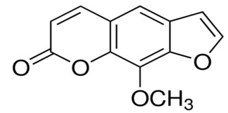
Methoxsalen [43]
|
Chemical structure |
|
|
IUPAC name |
9-methoxyfuro[3,2-g]chromen-7-one |
|
Description |
Solid |
|
Molecular Weight |
216.192 g/mol |
|
Molecular Formula |
C12H8O4 |
|
Melting Point |
1430C-1480C |
|
Category |
Antipsoriatic |
|
Mode of Action |
The exact mechanism of action of methoxsalen is not known. The best-known biochemical reaction of methoxsalen is with DNA. Then the formation of photo adducts results in inhibition of DNA synthesis, cell division and epidermal turnover. |
|
Solubility |
Soluble in chloroform, acetone, hot ethanol Insoluble in water. |
|
Use |
To treat Psoriasis and vitiligo |
|
Adverse Effects |
Reddened skin, swelling of the skin followed by peeling, skin discomfort. |
VI. MATERIALS AND INSTRUMENTS
A. Reference Standard
The following reference standard was used during the project work and is enlisted in Table No.6.1
Table 6.1: Details of Reference Standard Used
|
Sr. No. |
Name of Standard |
Gift sample supplier |
Purity |
|
1 |
Methoxsalen USP |
Inga laboratories Pvt. Ltd. Mumbai |
99.98% |
B. Marketed Formulation
The following marketed formulation was used during the project work and is enlisted in Table No.6.2.
Table 6.2: Details of Marketed Formulation Used
|
Sr. No |
Particulars |
Details |
|
1 |
Brand Name |
Melanocyl 10 mg Tab |
|
2 |
Manufactured by |
Franco Indian Pharmaceuticals Pvt. Ltd. Mumbai |
|
3 |
Content |
Each tablet contains: Methoxsalen USP…. 10mg Excipients…….q.s. |
|
4 |
Colour |
White |
|
5 |
Average Weight |
0.2013gm |
C. Instruments
The following instruments were used and are enlisted in Table No. 6.3
Table 6.3: Details of Instrument Used
|
Sr. No |
Name of Instrument |
Make |
Model |
|
1 |
UV-Visible Spectrophotometer |
Shimadzu |
UV-2450 UV probe v 2.3.3 |
|
2 |
HPLC System |
Water’s Corp |
Waters 1525 (by binary pump) Waters 2489 (UV Visible Detector) |
|
3 |
Analytical Balance |
Shimadzu |
AUX 220 |
|
4 |
Ultrasonicator |
Citizen pvt. Ltd. |
Digital ultrasonic cleaner |
D. Chemicals and Reagents
The following chemicals and reagents were used and are enlisted in Table No 6.4.
Table 6.4: Details of Chemicals and Reagents used
|
Sr. No |
Reagent |
Grade |
|
1 |
Methanol |
HPLC Grade |
|
2 |
Water |
HPLC Grade |
|
3 |
Hydrochloric acid |
Laboratory Grade |
|
4 |
Sodium hydroxide |
Laboratory Grade |
|
5 |
Hydrogen peroxide |
Laboratory Grade |
VII. EXPERIMENTAL WORK AND RESULTS
A. Solubility studies
The solubility of a Methoxsalen was carried out in different solvents such as water, methanol and acetonitrile. An accurately weighed quantity of 0.5 gm Methoxsalen was dissolved in water, methanol, and acetonitrile respectively and the resultant solutions were sonicated for 10 min to dissolve the drug. The results were visually observed. It was found that the Methoxsalen was soluble in methanol, water and acetonitrile.
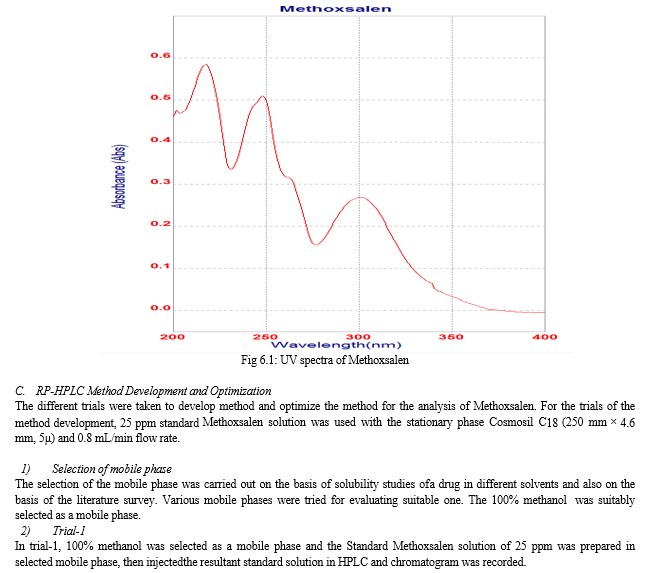
B. Selection of wavelength
For the selection of wavelength, the 5 ppm of standard Methoxsalen solution was prepared in a mixture of methanol : water (80:20 v/v). It was scanned over the wavelength range of 400-200 nm using double beam UV spectrophotometer with methanol : water (80:20 v/v) as blank. The absorption maxima for Methoxsalen in methanol : water was found to be 218 nm. The spectrum of Methoxsalen is shown in figure 6.1.
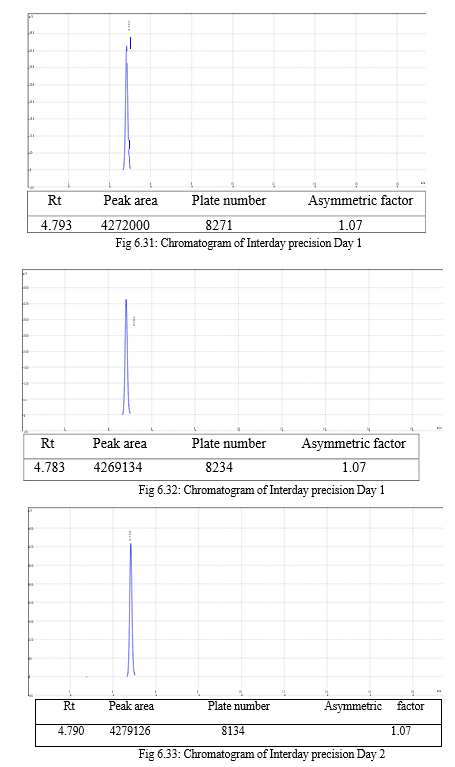
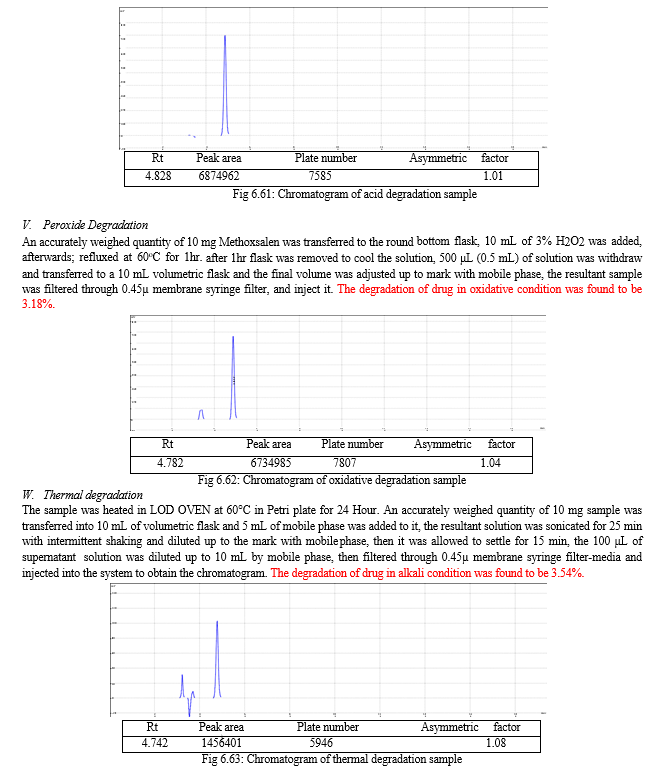
The result of forced degradation study is shown in Table 6.26.
Table 6.25: Result of forced degradation study
|
Sr. No. |
Stress Condition |
% degradation |
|
1 |
Alkaline condition |
6.21% |
|
2 |
Acidic condition |
1.17% |
|
3 |
Oxidative condition |
3.18% |
|
4 |
Thermal condition |
3.54% |
VIII. DISCUSSION
The present study included development of stability indicating RP-HPLC method for estimation of Methoxsalen and the results obtained were found to be satisfactory. The work was started with solubility testing; the Methoxsalen was soluble in water, methanol and acetonitrile. Then the wavelength was selected by UV spectrophotometric method in methanol : water (80:20 v/v), the Methoxsalen was shown ?max at 218 nm, and this 218 nm was selected as the detector wavelength in a HPLC.
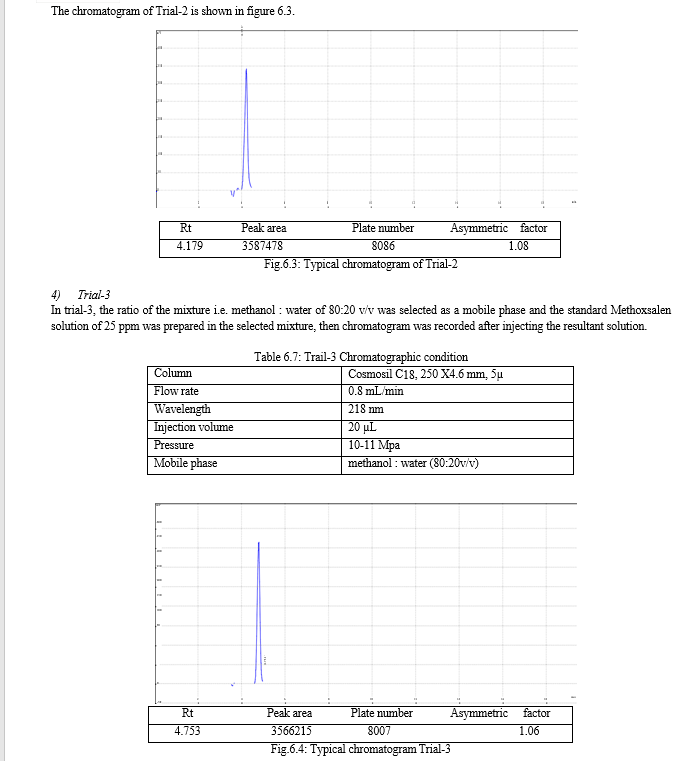
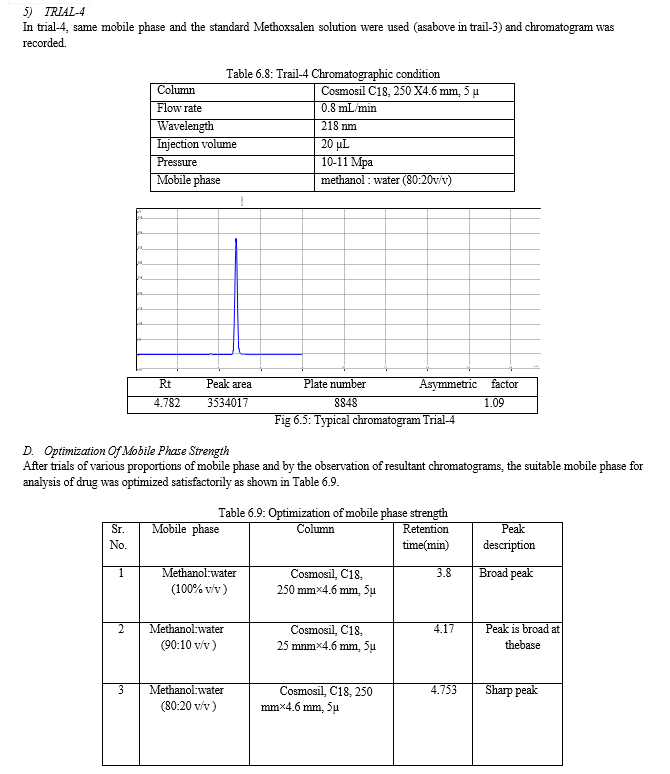
For the selection of mobile phase the different trials were taken, the trail -1 was not selected due to the broad peak observed with 100 % methanol in the recorded chromatogram. By reducing the methanol: water ratio in (90:10 v/v) in trail-2, the recorded chromatogram was shown the solvent peak too close to the principal peak of Methoxsalen, In trial-3 the methanol : water (80:20 v/v) was selected as mobile phase due to sharp peak obtained in chromatogram, which fulfilled the acceptance criteria, therefore trial-3 chromatographic condition was optimized for the analysis of Methoxsalen.
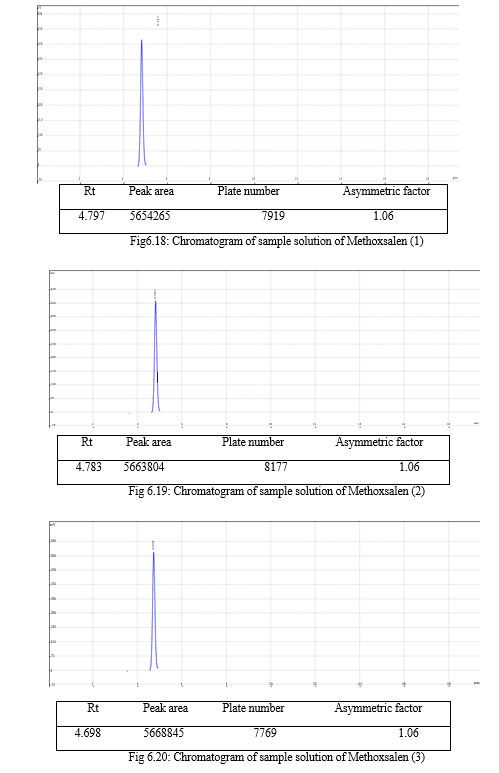
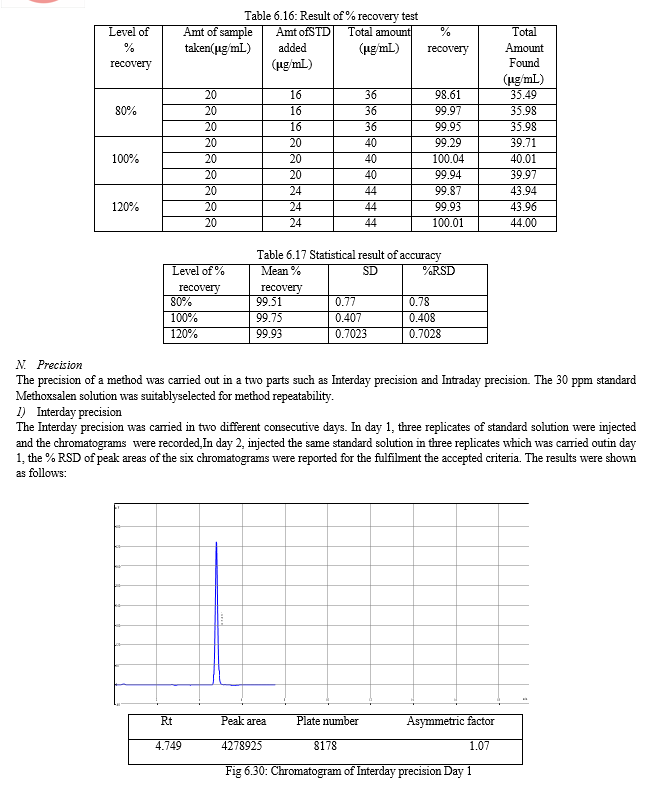
For estimation of drug in marketed formulation, drug solution equivalent to -----
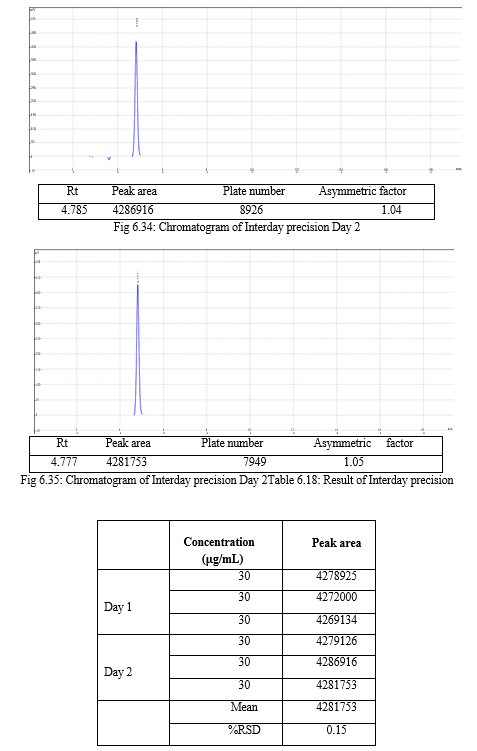
The validation of the developed method was carried out as per ICH guidelines and the results were found to be complying with the acceptable limit. The compiled validation results are shown in Table 7.1
Table 7.1: Results of validation
|
Sr. No. |
Parameter |
Result |
Acceptance criteria |
|
1 |
Linearity |
10-50μg/mL, R2 = 0.999 |
R2 ≥0.999 |
|
2 |
System suitability test |
T.plates=8089, A. factor= |
T.Plates≥2000, A. factor<1.75 |
|
3 |
Accuracy |
99.74 |
98-102% |
|
4 |
Interday precision |
0.15% |
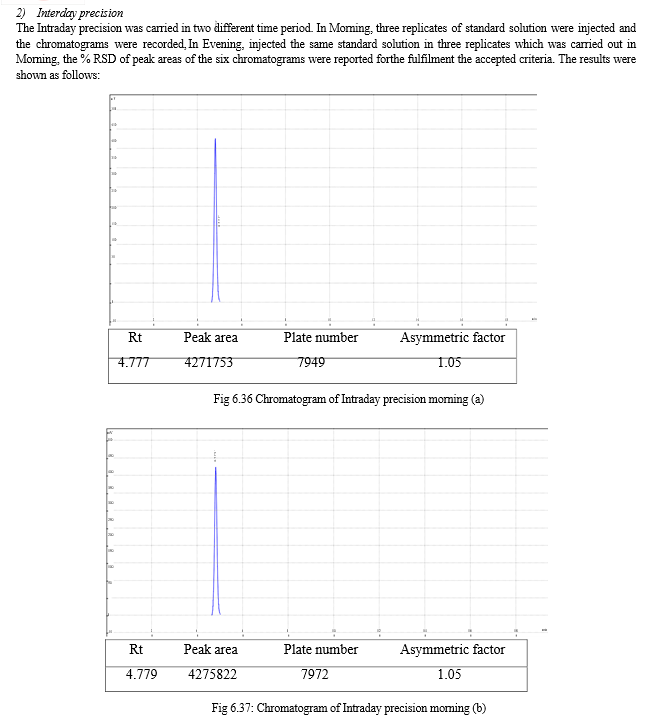
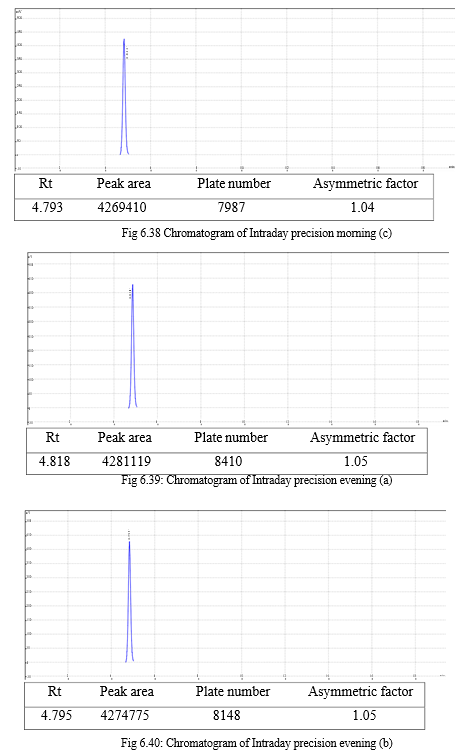
%RSD < 2% |
|
5 |
Intraday precision |
0.10% |
%RSD < 2% |
|
6 |
Specificity |
No Interference |
No Interference |
|
7 |
Robustness |
Change in wavelength: 0.28%, Change in flow rate:0.10%, Change in composition: 0.13% |
%RSD < 2% |
|
8 |
Ruggedness |
0.070 |
%RSD < 2% |
|
9 |
LOD and LOQ |
0.14 and 0.45 |
LOQ is three times of LOD |
The forced degradation study was carried out in acid, base, peroxide and thermal stress condition. In alkaline condition 6.21% drug was degraded may be due to the breakdown of coumarin ring. In acidic condition 1.17% drug was degraded may be due to the double bond break in furocoumarin ring and in oxidative drug was 3.18% degraded may be due to the oxidation of lactone ring. In thermal degradation, 3.54% of drug was degraded at 600C.
IX. FUTURE SCOPE
There may be several scopes in future for further studies are given as follows:
- The developed RP-HPLC method can be further optimized for the estimation of Methoxsalen in biological fluids.
- Stability indicating UPLC and UHPLC methods can be developed for much faster results.
- Degradation pathway of the drug can be established by identifying the possible structure of degraded product through hyphenated techniques like LC-MS, LC-NMR.
Conclusion
The present research work based on development of stability indicating RP-HPLC method for estimation of Methoxsalen, was successfully completed. The parent drug and degradation products were well resolved under optimized chromatographic condition indicating the selective nature of developed method. Based on the test results, it was concluded that the method is simple, accurate, sensitive, precise, rapid, and free from any kind of interference of the excipients from the formulation; therefore the proposed method can be used for routine analysis of estimation of Methoxsalen in its tablet formulation.
References
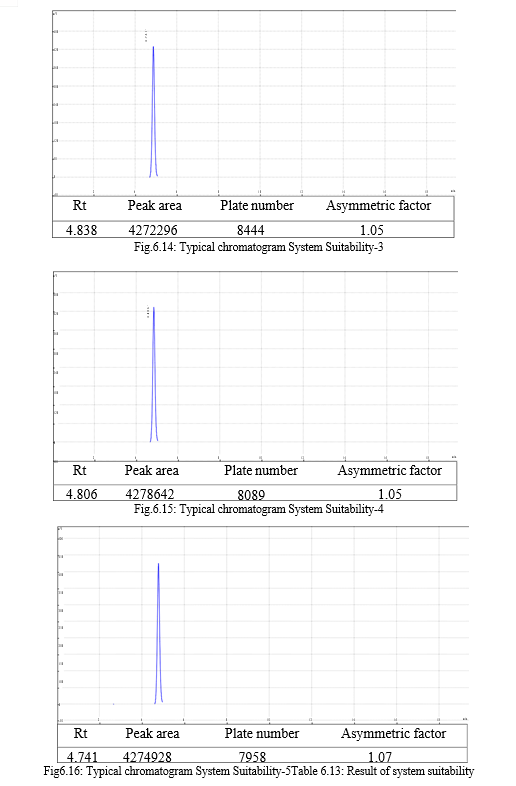
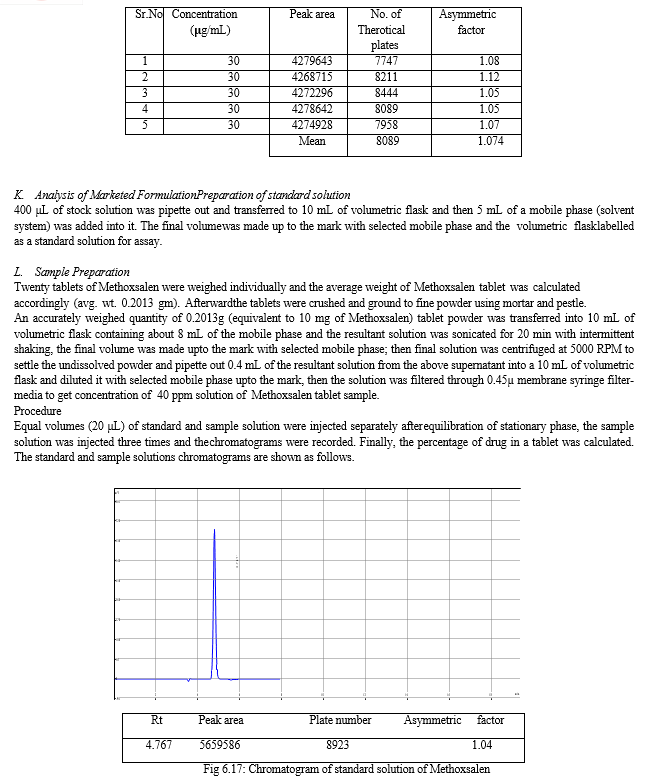
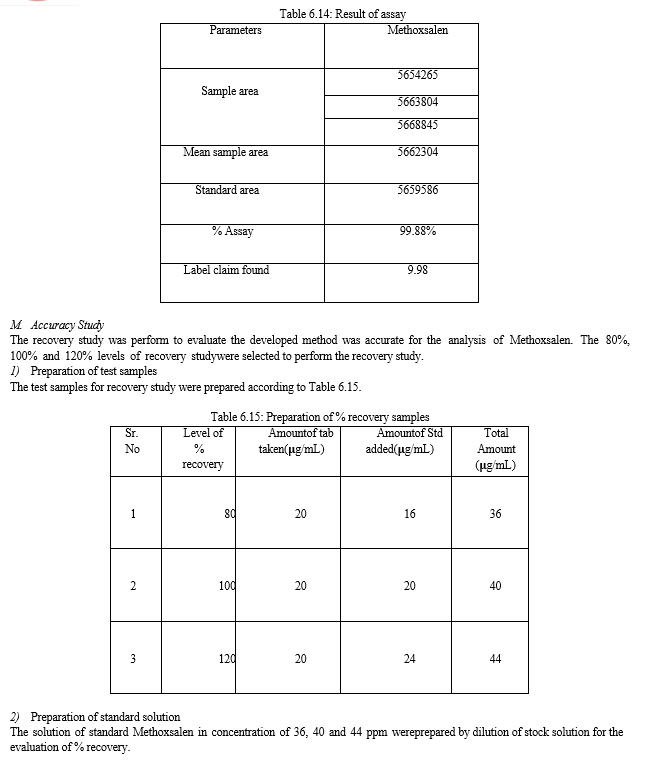
[1] A. Chauhan, B. Mittu and P. Chauhan, “Analytical Method Development and Validation: A Concise Review,” Journal of Analytical and Bio-analytical Techniques, Vol. 6, No. 1, P. No. 1–5, 2015. [2] D. A. Skoog, F. J. Holler and T. A. Nieman, “Principles of Instrumental Analysis,” Saunders College Publishing, 5th edition, P. No. 1-5, 1995. [3] D. Harvey, “Modern Analytical Chemistry”, Mc Graw-Hill Companies, P. No. 26-30, 2008. [4] H. Gunzler and A. Williams, “Handbook of Analytical Techniques,” The Wiley-VCH Publisher, First edition-2001, Second reprint-2002, P. No. 1-5, 8. [5] A. V. Kasture, K. R. Mahadik, S. G. Wadodkar and H. N. More, “Pharmaceutical Analysis Instrumental Methods,” Nirali Prakashan, 23rd edition-Jan 2016, Vol. 2, P. No.2.1-2.2. [6] L. R. Snyder, J. J. Kirkland and J. W. Dolan, “Introduction to Modern Liquid Chromatography,” John Wiley and Sons, 3rd edition, P. No. 6-9., 1997. [7] P. D. Madane, P. M. Sapkal and M. N. Palshikar, “An Overview on Different Chromatographic Techniques,” International Journal of Pharmacy and Pharmaceutical Research, Vol. 8, No. 2, P. No.149-161, 2017. [8] GE Healthcare Bio-Science AB, “Ion Exchange Chromatography Principles and Methods” Uppsala, Sweden, 1st edition, Vol. 1, P. No. 11-25, 2004. [9] C. O. Fagain, P. M. Cummins and B. F. Connor, “Chapter-2 Gel Filtration Chromatography”, Protein Chromatography Methods and Protocols, Springer, Vol. 681, P. No. 25-30, 2011. [10] A. M. Sabir, M. Moloy and P. S. Bhasin, “HPLC Method Development and Validation- A Review’, International Research Journal of Pharmacy, Vol. 4, P. No. 39-46, 2013. [11] M. Thammana, “A Review on High Performance Liquid Chromatography (HPLC),” Research and Reviews: Journal of Pharmaceutical Analysis, Vol. 5, No. 2, P. No. 22–28, 2016. [12] P. N. Patil, “HPLC Method Development –A Review”, Journal of Pharmaceutical Research and Education, Vol. 2, P. No. 243-260, 2017. [13] https://www.google.co.in/search?q=schematic+diagram+of+hplc. [14] A. Younus and G. S. Yahuna, “High Performance Liquid Chromatography (HPLC) in Pharmaceutical Industry: A Short Review”, European Academic Research, Vol. 6, P. No.5875-5889, 2019. [15] P. D. Sethi, “HPLC Quantitative Analysis of Pharmaceutical Formulation”, CBS Publishers and Distributors, New Delhi, P. No. 1-19, 2001. [16] B. K. Sharma, “Instrumental Methods of Chemical Analysis, Goel Publishing House, Meerut, P. No. 56-84, 2000. [17] M. Swartz, “HPLC Detectors: A Brief Review,” Journal of Liquid Chromatography and Related Technologies, Tayler and Francis, Vol. 33 P. No. 1131-1142. 2010. [18] G. Rao and A. Goyal, “An Overview On Method Development and Validation by using HPLC”, The Pharmaceutical and Chemical Journal, 2016, Vol. 3 No.2, P. No. 280-289, 2016. [19] V. D. Thorat, V. V. Patil, A. S. Dange and J. T. Naikwade, “A Review On: HPLC Trouble Shooting and Preventive Measures”, An Intenational Journal of Advances in Pharmaceutical Sciences, Vol. 4, No. 5, P. No. 793-801, 2013. [20] A. V. Burghate, J. S. Sisodia, H. B. Patil and S. N. Misar, “A Review on HPLC-Trouble Shooting Guide”, International Journal of Pharmaceutical Science Review and Research, Vol. 27, No. 32, P. No. 200-209. [21] A. Sailaja, S. Ghosh, T. P. Reddy, P. N. Deepthi and D. Banji, “A Review On Trouble Shooting in HPLC and It’s Solutions”, International Journal of Pharmaceutical and Chemical Sciences, Vol. 3, No. 3, P. No. 625-635, 2014. [22] Y. R. Sharma, “Elementary Organic Spectroscopy Principles and Chemical Applications”, S. Chand and Company Publisher, Multicolour Edition, P. No. 21, 22, 2009. [23] https://www.google.co.in/search?q=diagram+of+uv+absorption+shifts. [24] R. S. Shah, R. B. Pawar and P. P. Gayakar, “UV-Visible Spectroscopy – A Review”, International Journal of Institutional Pharmacy and Life Sceinces, Vol. 5, P. No. 490- 505,2015. [25] https://www.google.co.in/search?q=diagram+of+uv&source. [26] G. R. Chatwal and S. K. Anand, “Instrumental Methods of Chemical Analysis”, Himalaya Publishing House, First Edition-1979, Reprint On- 2010, P. No.2.149-2.177. [27] R. Patil, T. Deshmukh, V. Patil and K. Khandelwal, “Review on Analytical Method Development and Validation,” Reseach And Reviews: Journal of Pharmaceutical Analysis, Vol. 3, No. 3, P. No. 1–10, 2014. [28] S. L. Patwekar, R. S. Sakhre and N. N. Nabalwar, “HPLC Method Development and Validation- A General Concept”, Vol. 6, No. 1, P. No. 8-14, 2015. [29] ICH Harmonized Tripartite Guideline, “Validation of Analytical Procedures: Text and Methodology”, Q2 (R1); Current Step 4 version; Parent Guideline Dated 27 October 1994. [30] U.S. Department of health and human services, food and drug administration, center for drug evaluation and research (CDER), guidance for industry, Bioanalytical method validation, 2001. http://www.fda.gov. (January 2013). [31] S. K Bhardwaj, K. Dwivedi and D. D. Agarwal, “A Review: HPLC Method Development and Validation” International Journal of Analytical and Bioanalytical Chemistry, Vol. 5, No.4, P. No. 76-81, 2015. [32] S. Sharma, S. Goyal and K. Chauhan, “A Review on Analytical Method Development and Validation”, International Journal of Applied Pharmaceutics, Vol. 10, No. 6, P. No. 8-15, 2018. [33] LM. Patel, J. Surati and D. Chaudhari, “Review : Force Degradation Studies”, An International Journal of Pharmaceutical Sceinces, Vol. 7, No. 2, P. No. 148-161, 2016. [34] S. Venkataraman and M. Manasa, “Forced Degradation Sudies : Regulatory Guidance, Characterization of Drugs and Their Degradation Products – A Review”, Drug Invention Today, Vol. 10, No. 2, P. No. 137-146, 2018. [35] P. Ravishankar, V. swathi, P. S. Babu, S. Sulthana and S. K. Gousepeer, “Current Trends in Performance of Forced Degradation Studies and Stability Indicating Studies of Drugs”, Journal of Pharmacy and Biological Sciences, Vol. 12, No. 6, P. No. 17-36, 2017. [36] T. Rawat and I. Pandey, “Forced Degradation Studies For Drug Substances And Drug Products- Scientific And Regulatory Considerations,” Journal of Pharmaceutical Science and Research, Vol. 7, No. 5, P. No. 238–241, 2015. [37] M. Hossain, S. Bhadra, U. Kumar and A. Rouf, “The ICH Guidance in practice:Stress degradation studies on Aceclofenac and Development of a validated stability-indicating RP-HPLC assay in tablet dosage form,” Der Pharma Chem., Vol. 5, No. 4, P. No. 131–146, 2013. [38] C. D. Jyothi, K. L. Naryana, M. M. Latha, B. Madhavi and K. Rambabu, “Development and Validation of LC Method for the Estimation of Methoxsalen in Pharmaceutical Dosage Form and Serum”, An International Journal of Advances in Pharmaceutical Sciences, Vol. 2, P. No. 199-203, 2011. [39] M. Harsahay, P. Hemant, M. Aarti, and M. Nasim, “Development of HPLC Method for Estimation of Furonocumarins in Psoralea corylifolia and Ammi majus”, International Journal of Pharmacognosy and Phytochemical Research, Vol. 6, No. 2, P. No. 290-294, 2014. [40] C. H. Ketchum, C. A. Robinson, and S. T. Huang, “Analysis of 8-Methoxypsoralen by High Perforamance Liquid Chromatography”, Journal of Clinical Chemistry, Vol. 36, No. 11, P. No. 1956-1957,1990. [41] N. M. Rao, and D. Gowrisankar, “Development and validation of a stability-indicating RP-HPLC method for the assay of Pristinamycin in bulk and tablet dosage form,” Scientia Pharmaceutia, Vol. 84, No. 2, P. No. 279–287, 2016. [42] R. Singh, S. Sahoo, U. Mishra, B. Garnaik, S. K. Sahoo and D. Hati, “Stability Indicating RP-HPLC Method Development and Validation of Norfloxacin,” American Journal of Advanced Drug Delivery, Vol.1, No.5, P. No. 743-758, 2013. [43] https://pubchem.ncbi.nlm.nih.gov/compound/methoxsalen. List Of Abbreviations Sr. No CHEMICALS 1 H2O2 Hydrogen Peroxide 2 HCl Hydrochloric acid 3 H2O Water 4 C3H6O Acetone 5 MeOH Methanol 6 ACN Acetonitrile 7 NaOH Sodium hydroxide SYMBOLS 8 % Percentage 9 ? Max Wavelength of maximum absorption 10 < Less than 11 > Greater than 12 µg Microgram (S) 13 µL Micro liter (S) 15 Cm Centimeter (S) 16 i.d. Internal diameter 19 Mg Milligram (S) 20 Min Minute (S) 21 mL Milliliter (S) 25 r2 Correlation coefficient 26 Sec Second (S) 27 Temp Temperature 28 °C Degree centigrade 29 No. Number 30 Sr. No. Serial number 32 v/v Volume by volume 34 Conc. Concentration 35 ppm Parts per million OTHERS 36 RSD Relative standard deviation 37 SD Standard deviation 38 UV Ultraviolet 39 Rt Retention Time 42 API Active Pharmaceutical Ingredient 43 RP-HPLC Reversed Phase High Performance Liquid Chromatograph 44 ICH International Conference on Harmonization 46 LOD Limit of detection 47 LOQ Limit of Quantitation 50 SIAM Stability indicating assay method List Of Figures Sr. No Fig No. Figure Name Page No. 01 1.1 Adsorption of solutes over stationary phase 3 02 1.2 Ion Exchange chromatography 4 03 1.3 Size Exclusion chromatography 5 04 1.4 Schematic diagram of HPLC system 7 05 1.5 Fundamental parameters of Chromatography 13 06 1.6 Negative peaks 17 07 1.7 Peak Fronting 18 08 1.8 Peak Tailing 18 09 1.9 Broad Peak 18 10 1.10 Absorption and Intensity shifts 20 11 1.11 Schematic diagram of UV-Visible spectrophotometer 21 12 1.12 Prerequisites for Method development and Validation 23 13 6.1 UV spectra of Methoxsalen 14 6.2 Typical chromatogram of Trial-1 15 6.3 Typical chromatogram of Trial-2 16 6.4 Typical chromatogram of Trial-3 17 6.5 Typical chromatogram of Trial-4 18 6.6 Standard calibration curve of Methoxsalen 19 6.7 Linearity Chromatogram (10?g/mL) 20 6.8 Linearity Chromatogram (20?g/mL) 21 6.9 Linearity Chromatogram (30?g/mL) 22 6.10 Linearity Chromatogram (40?g/mL) 23 6.11 Linearity Chromatogram (50?g/mL) 24 6.12 Typical chromatogram System Suitability-1 25 6.13 Typical chromatogram System Suitability-2 26 6.14 Typical chromatogram System Suitability-3 27 6.15 Typical chromatogram System Suitability-4 28 6.16 Typical chromatogram System Suitability-5 29 6.17 Chromatogram of standard solution of Methoxsalen 30 6.18 Chromatogram of sample solution of Methoxsalen 31 6.19 Chromatogram of sample solution of Methoxsalen 32 6.20 Chromatogram of sample solution of Methoxsalen 33 6.21 Chromatogram of Accuracy 80% Level 1 34 6.22 Chromatogram of Accuracy 80% Level 2 35 6.23 Chromatogram of Accuracy 80% Level 3 36 6.24 Chromatogram of Accuracy 100% Level 1 37 6.25 Chromatogram of Accuracy 100% Level 2 38 6.26 Chromatogram of Accuracy 100% Level 3 39 6.27 Chromatogram of Accuracy 120% Level 1 40 6.28 Chromatogram of Accuracy 120% Level 2 41 6.29 Chromatogram of Accuracy 120% Level 3 42 6.30 Chromatogram of Interday precision Day 1 43 6.31 Chromatogram of Interday precision Day 1 44 6.32 Chromatogram of Interday precision Day 1 45 6.33 Chromatogram of Interday precision Day 2 46 6.34 Chromatogram of Interday precision Day 2 47 6.35 Chromatogram of Interday precision Day 2 48 6.36 Chromatogram of Intraday precision morning (a) 49 6.37 Chromatogram of Intraday precision morning (b) 50 6.38 Chromatogram of Intraday precision morning (c) 51 6.39 Chromatogram of Intraday precision evening (a) 52 6.40 Chromatogram of Intraday precision evening (b) 53 6.41 Chromatogram of Intraday precision evening (c) 54 6.42 Chromatogram of blank preparation 55 6.43 Chromatogram of standard preparation 56 6.44 Chromatogram of sample preparation 57 6.45 Chromatogram of robustness (0.6 mL/min) 58 6.46 Chromatogram of robustness (0.8 mL/min) 59 6.47 Chromatogram of robustness (1.0 mL/min) 60 6.48 Chromatogram of robustness (216 nm) 61 6.49 Chromatogram of robustness (218 nm) 62 6.50 Chromatogram of robustness (220 nm) 63 6.51 Chromatogram of robustness (75:25 v/v) 64 6.52 Chromatogram of robustness (80:20 v/v) 65 6.53 Chromatogram of robustness (85:15 v/v) 66 6.54 Chromatogram of analyst-2 linearity (10 ?g/mL) 67 6.55 Chromatogram of analyst-2 linearity (20 ?g/mL) 68 6.56 Chromatogram of analyst-2 linearity (30 ?g/mL) 69 6.57 Chromatogram of analyst-2 linearity (40 ?g/mL) 70 6.58 Chromatogram of analyst-2 linearity (50 ?g/mL) 71 6.59 Standard calibration curve by analyst-2 72 6.60 Chromatogram of base degradation sample 73 6.61 Chromatogram of acid degradation sample 74 6.62 Chromatogram of oxidative degradation sample 75 6.63 Chromatogram of thermal degradation sample List Of Tables Sr. No Table No. Name of Table Page No. 1 1.1 Modes of Chromatography 6 2 1.2 Pump’s advantages and Disadvantages 10 3 1.3 Commonly used Columns and their manufacturer 12 4 1.4 Characteristics to be Validated in HPLC 29 5 6.1 Details of Reference Standard Used 36 6 6.2 Details of Marketed Formulation Used 36 7 6.3 Details of Instrument Used 37 8 6.4 Details of Chemicals and Reagents used 37 9 6.5 Trial-1 Chromatographic condition 39 10 6.6 Trail-2 Chromatographic condition 40 11 6.7 Trail-3 Chromatographic condition 41 12 6.8 Trail-4 Chromatographic condition 41 13 6.9 Optimization of mobile phase strength 43 14 6.10 Optimized Chromatographic Conditions 43 15 6.11 Preparation of linearity samples 16 6.12 Results of linearity 19 6.13 Result of system suitability 20 6.14 Result of assay 21 6.15 Preparation of % recovery samples 22 6.16 Result of accuracy (% recovery) 6.17 Statistical result of accuracy 23 6.18 Result of Interday precision 24 6.19 Result of Intraday precision 25 6.20 Result of robustness (change in flow rate) 26 6.21 Result of robustness (change in wavelength) 27 6.22 Result of robustness (change in composition) 28 6.23 Result of ruggedness 29 6.24 Result of LOD and LOQ 30 6.25 Result of forced degradation study
Copyright
Copyright © 2023 Bhagyashri Gayke. This is an open access article distributed under the Creative Commons Attribution License, which permits unrestricted use, distribution, and reproduction in any medium, provided the original work is properly cited.

Download Paper
Paper Id : IJRASET50978
Publish Date : 2023-04-25
ISSN : 2321-9653
Publisher Name : IJRASET
DOI Link : Click Here
 Submit Paper Online