

Ijraset Journal For Research in Applied Science and Engineering Technology
Machine Learning based Approach for Brake Pad Pressure Distribution
Authors: Maddipati Rakesh Kumar, Rashmi Agarwal
DOI Link: https://doi.org/10.22214/ijraset.2022.46611
Certificate: View Certificate
Abstract
The Brake system in automobiles plays a vital role in customer safety. Brake pads are crucial components that experience huge pressure while slowing down the vehicle’s movement. Designing a brake pad requires sound knowledge of structural design, manufacturing ability, and material properties. Further, an optimized model is chosen based on the size of the brake pad and the brake power requirement. Brake pad pressure distribution is one of the main studies in designing automobile brake pads. Numerical solvers are used to validating the experimental results, which is a repetitive process for every new design under the study. Computer-aided engineering tools are costly and time-consuming for design iterations. The present paper provides a new approach for estimating brake pad pressure distribution using machine learning techniques. The accuracy of the machine learning models for various designs shows promising outcomes.
Introduction
I. INTRODUCTION
In automobiles, the brake system plays a crucial role in terms of the safety and performance of the vehicle. Brake manufacturers take care of various aspects in designing a brake system such as brake power, noise generated during braking, manufacturability, and choosing the correct size of the brake pad in compliance with other systems’ designs. In automobiles, the interaction between the brake pads and disc slows down the vehicle. The interaction builds high pressure and increases the temperature of the brake pads and the surface of the disc. In industrial terms, the study of understanding the distribution of the pressure on the brake pads during the braking operation is called pad pressure distribution analysis. The product design life cycle consists of many design iterations involving Computer-Aided Design (CAD), Computer-Aided Engineering (CAE), and benchmarking tests. The benchmarking test results need to be validated for correlating the results. The conventional validation technique used is CAE. The CAE process involves Finite Element (FE) modeling, Finite Element Analysis (FEA), and post-processing of results.
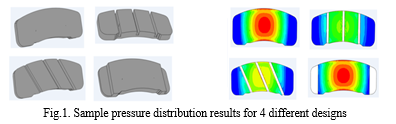
FE modeling is a mathematical representation of any geometry in terms of simple shapes called elements such as rectangles, triangles, cubes, etc. The corners of each element are called Nodes. In other words, a node is a coordinate location in space where the Degree Of Freedom (DOF) is defined. Numerical solvers are most commonly used to perform finite element modeling, analysis, and post-processing of results. Solver time can range from minutes to weeks depending on the node count, element count, and complexity of the assembly model, increasing the overall design time. In Fig.1, some of the brake pad geometry designs and their respective pressure distribution during braking operation are shown.
II. LITERATURE REVIEW
Recent studies on applying artificial intelligence in the field of product design have shown promising results. A deep learning (DL) approach is suggested in [1] for predicting the stress distribution of aorta values. The geometry is modeled with a fixed number of elements for all geometrical shapes. The geometry shapes can also be stored in a structured format with automatic feature extraction [2], which helps in classifying the geometry based on the features. Prediction of the brake squeal using deep learning techniques is discussed in [3].
Convolution neural networks (CNN) are trained in the study to classify the brake squeal noise and also the concept of transfer learning is used to build brake noise detectors. Three deep learning models are built based on faster R-CNN inception architecture, faster R-CNN Resnet architecture, and R-FCN Resnet architecture. Based on the comparison, the faster R-CNN Resnet architecture outperforms the brake squeal classification. A similar approach for predicting the brake pad wear is estimated based on machine learning (ML) models in the study [4]. Neural networks are developed to estimate the brake pad wear, and disc wear based on several input parameters such as car inertia, rolling radius, disc parameters, braking instances, etc.
The neural network model predicts the results with an accuracy of 85% compared to the wear measured using the dynamometer. To predict the pad wear and temperature in the pad-disc interface a two-layered artificial neural network is built in one of the studies [5]. Two different networks are built based on steel and aluminum disc models. The artificial neural network models showed a reasonable agreement with experimental results. The Finite element analysis setup and modeling are discussed in various research papers [6,7,8] mentioning the element type, element size, and model setup. The FEA approach to finding the contact pressure distribution of brake pad linings is similar in terms of model setup. The coefficient of friction is an important factor in determining brake system performance and a suitable FEA approach is discussed in recent years [9]. Commercial software such as Altair DesignAI, and Knowledge base provide AI-powered product design and learning from design data in recent years [14,15]. Apart from machine learning models application in product design, several deep learning applications are discussed in the various articles [10,11], that showcased new possibilities in the product development cycle.
In sections 3 and 4, the research methodology and data generation setup are discussed in detail. In sections 5 and 6, the data preparation and model building are discussed. In sections 7 and 8, the testing and results are discussed more in detail.
III. RESEARCH METHODOLOGY
As an alternate approach to the conventional method, a new workflow is designed that can benefit both time and computational power. With advancements in machine learning and deep learning techniques, an interdisciplinary study helps in understanding the underlying patterns of the data. This helps in predicting the future model results without running the analysis setup for the anticipated design iterations. The proposed methodology applies to most of the CAE problems, where the finite element mesh can be made as a global to capture the geometry shape in a more structured and more adaptive way. Creating a global finite element model helps in studying more designs and an easy analysis setup.
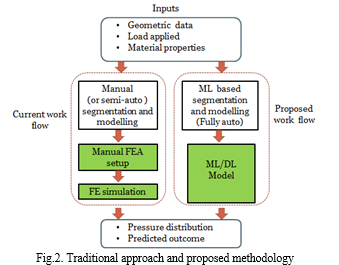
In the new approach, ML is used in place of the conventional CAE setup as shown in Fig.2. ML-based segmentation and modeling is a one-time process to capture the variation of different designs in a single base FE model to reduce the model setup time. Variations in geometry, material, and loading conditions are planned and captured in the data generation step, allowing the analytical model in understanding the more hidden patterns in the data. The proposed workflow can be stated as a data-driven analytical approach rather than an engineering approach to solving real-world problems.
As part of this research, 4 pad design models are simulated at various load conditions, material properties, and geometry properties. Geometry properties of brake pad include thickness, width, and length of the pad. Piston radius is also considered as an input parameter since the contact area between piston and backplate increases with the increase in piston size. Material properties of pad and loading conditions are taken as inputs to observe the results.
IV. DATA GENERATION AND UNDERSTANDING
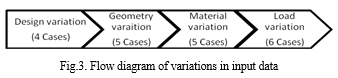
Open-source brake corner module geometry is considered in the present study. To study the pad pressure distribution, all components of the Brake Corner Module (BCM) are not considered as the outer pad pressure distribution mainly depends on the disc, piston, and pad geometry. Pressure distribution data were generated through CAE analysis using the open-source software for all the anticipated designs. Variation in data generated is represented in the flow diagram in Fig.3.
Table 1. The technical name of designs
|
Design |
Technical name |
|
Design 1 |
Base model/ Full model |
|
Design 2 |
Dual straight slot model |
|
Design 3 |
Dual cross slot model |
|
Design 4 |
Two-sided J- cut model |
A base FE model is created using hexahedral and pentahedral elements with different element sizes. This pad parametric mesh can be modified to generate other 3 design FE models. Technical names of the designs are mentioned in Table 1.
V. DATA PREPARATION
As mentioned in the previous section, data generated using the commercial CAE software is stored separately for each design. 4 brake pad designs are considered in this study. One of the 4 models is the base model using which all other designs are generated. Machine learning algorithms are built to establish the relationship between various input properties and pressure distribution. Parameters of “Geometry”, “Material”, and “Load applied” as shown in Table 2 are taken as input parameters to predict the variation in pressure distribution patterns.
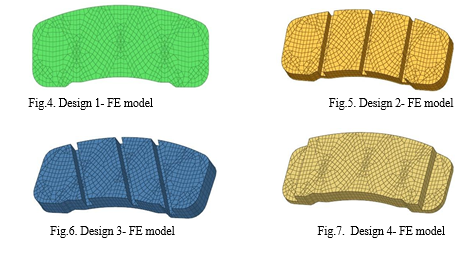
Table 2. Input variables for model building
|
Properties |
Input variables |
|
Geometry properties |
Piston Radius |
|
Brake pad width |
|
|
Brake pad length |
|
|
Brake pad thickness |
|
|
Loading conditions |
Applied pressure |
|
Material properties |
Young's modulus |
Table 3. Target variables count for each design
|
Brake pad design |
Node count |
|
Design 1 |
883 |
|
Design 2 |
756 |
|
Design 3 |
793 |
|
Design 4 |
803 |
Variables to predict are taken as nodes generated in the FE modeling process. The base design is modeled using 883 nodes and 200 elements as shown in Fig.4. All the 883 nodes are taken as target variables for the base design. Design 2, Design 3, and Design 4 are modified from base Design 1 by the subtractive method of elements. The node count in each design is mentioned in Table 3.
VI. MODEL BUILDING
For each design, various ML models are built. As the target variables are more than one, "Multi-output Regressor" is used to predict the output pressure values. Data is split into train and test for model training and model validation. For each design, the following ML algorithms are built, and results are compared.
A. Linear Regression
A multi-output Linear Regressor (LR) algorithm is used to identify the linear relationship between the input features and multiple numerical output variables. In this algorithm, outputs are dependent on inputs and upon each other.
B. Decision Tree
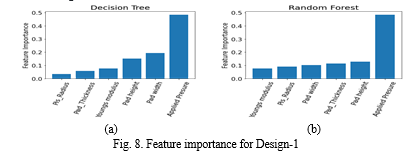
This supervised learning algorithm is used to predict the class or value of the target variable by learning simple decision rules inferred from the training data. Multiple Decision Tree (DT) models with a maximum depth of tree as 2, 5, 8, and 20 are implemented. Mean Square Error (MSE) is used to measure the quality of a split. Feature importance values of design 1 from the DT are shown in Fig.8(a).
C. Random Forest
It is an Ensemble of decision trees. It is a classifier that contains many decision trees on various subsets of the given dataset and takes the average to improve the predictive accuracy of the model. It creates many decision trees based on the random subset of the data. The Random Forest (RF) model is built with a maximum depth of the tree of 30. Different random forest models are built with the number of trees as 10, 50, and 100. MSE is used to measure the quality of a split. Feature importance values of design 1 from the random forest model are shown in Fig.8(b).
D. Support Vector Machines
Support vector machines (SVM) are different from other classification and regression algorithms because of the way they choose the decision boundary that maximizes the distance from the nearest data points of all the classes. SVM is mostly used when the relationship between the training and target variables is complex. Support vector regressor with 'linear', 'rbf', and 'poly' kernels are built by using a regressor chain algorithm for predicting multiple target variables. 'Epsilon insensitive' is chosen as a loss function for model building. The maximum number of iterations is chosen as 1000.
E. XGBoost
It is also called the Extreme Gradient Boosting (XGBoost) algorithm. It is an optimized version of the Gradient Boosting algorithm (GBM) designed to be highly efficient and flexible. XGBoost regressor algorithm with learning objective "squared error" is chosen and the learning rate is chosen as 0.05, 0.1, and 0.15.
VII. TESTING
R-squared value is taken as a statistical measure that represents the goodness of the model fit, the value ranges from a minimum of 0 to a maximum of 1.
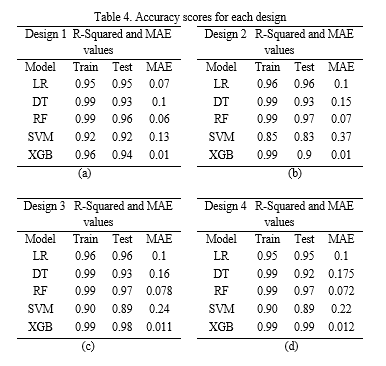
MSE is the average squared difference between the estimated value and the actual value. For all the models, R- squared values and MSE values are taken into consideration for comparing the model performance. For all 4 designs, the training accuracy, testing accuracy, and MSE values of several ML models are mentioned in Table 4.
VIII. ANALYSIS AND RESULTS
Application of different ML models to all 4 designs are performed and the accuracy of the models is noted to understand the best fit model for a particular design.
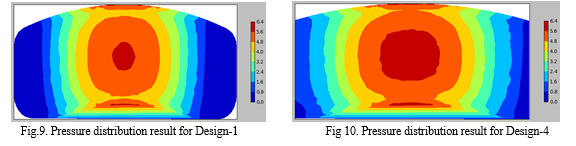
Results from the previous section show that the XGB model outperforms the brake pad designs 1, 3, and 4. The random forest model outperforms the brake pad design 2. For design 1 and 2, the predicted pressure values from the best fit model are visualized on the geometry as shown in Fig.9-10. Best fit ML model for each design is shown in Table 5.
Table 5. Best model and accuracy scores for each design
|
Design type |
ML model |
Train accuracy (%) |
Test Accuracy (%) |
|
Design 1 |
RF |
99.4 |
96.6 |
|
Design 2 |
RF |
99.4 |
96.7 |
|
Design 3 |
XGB |
98.8 |
97.6 |
|
Design 4 |
XGB |
99.8 |
99.1 |
Conclusion
The results from the previous section justified a single ML model is not the right choice for predicting the brake pressure distribution for all the brake pad designs based on the accuracy scores. As the accuracy scores are consistent and promising, the pressure distribution on the brake pad can be estimated with good accuracy levels, with less computational time and resources. These results help the design engineer to estimate the output pressure values for all designs and choose the best design based on the application. This study helps as a proof of concept in understanding the application of ML models as an alternative to CAE validation techniques. The proposed data-driven approach showed promising results and helps in forming a base for solving system-level validation using ML and deep learning models.
References
[1] Liang, L., Liu, M., Martin, C., & Sun, W. (2018). A deep learning approach to estimate stress distribution: a fast and accurate surrogate of finite-element analysis. Journal of the Royal Society Interface, 15(138). https://doi.org/10.1098/rsif.2017.0844 [2] Krahe, C., Iberl, M., Jacob, A., & Lanza, G. (2020). AI-based Computer Aided Engineering for automated product design - A first approach with a Multi-View based classification. Procedia CIRP, 86. https://doi.org/10.1016/j.procir.2020.01.038 [3] Stender, M., Tiedemann, M., Spieler, D., Schoepflin, D., Hoffmann, N., &Oberst, S. (2021). Deep learning for brake squeal: Brake noise detection, characterization and prediction. Mechanical Systems and Signal Processing, 149. https://doi.org/10.1016/j.ymssp.2020.107181 [4] Choudhuri, K., & Shekhar, A. (2020). Predicting Brake Pad Wear Using Machine Learning. https://doi.org/10.46720/eb2020-stp-015 [5] Hassan, A. K. F., & Mohammed, S. (2016). Artificial Neural Network Model for Estimation of Wear and Temperature in Pin-disc Contact. Universal Journal of Mechanical Engineering, 4(2). https://doi.org/10.13189/ujme.2016.040204 [6] Abu Bakar, Abd. R., &Quyang, H. (2005). Prediction of Disc Brake Contact Pressure Distributions by Finite Element Analysis. JurnalTeknologi, 43(1). https://doi.org/10.11113/jt.v43.755 [7] Goo, B. C. (2018). A study on the contact pressure and thermo-elastic behavior of a brake disc-pad by infrared images and finite element analysis. Applied Sciences (Switzerland), 8(9). https://doi.org/10.3390/app8091639 [8] Belhocine, A., & Abdullah, O. I. (2020). Finite element analysis (FEA) of frictional contact phenomenon on vehicle braking system. Mechanics Based Design of Structures and Machines. https://doi.org/10.1080/15397734.2020.1787843 [9] Riva, G., Varriale, F., &Wahlström, J. (2021). A finite element analysis (FEA) approach to simulate the coefficient of friction of a brake system starting from material friction characterization. Friction, 9(1). https://doi.org/10.1007/s40544-020-0397-9 [10] Lu, H., & Wang, T. (2019). An automobile noise prediction model based on extension data mining algorithm. Revue d’IntelligenceArtificielle, 33(5). https://doi.org/10.18280/ria.330503 [11] Yoo, S., Lee, S., Kim, S., Hwang, K. H., Park, J. H., & Kang, N. (2021). Integrating deep learning into CAD/CAE system: generative design and evaluation of 3D conceptual wheel. Structural and Multidisciplinary Optimization. https://doi.org/10.1007/s00158-021-02953-9 [12] Yang, Z., Yu, C. H., & Buehler, M. J. (2021). Deep learning model to predict complex stress and strain fields in hierarchical composites. Science Advances, 7(15). https://doi.org/10.1126/SCIADV.ABD7416 [13] Oh, S. J., Lim, C. O., Park, B. C., Lee, J. C., & Shin, S. C. (2019). Deep neural networks for maximum stress prediction in piping design. International Journal of Fuzzy Logic and Intelligent Systems, 19(3). https://doi.org/10.5391/IJFIS.2019.19.3.140 [14] Altair technical conference (2021) Presentations- AI Powered product design https://www.altair.com/resource/en/ai-powered-product-design [15] Altair technical conference (2021) Presentations- Machine learning in Engineering
Copyright
Copyright © 2022 Maddipati Rakesh Kumar, Rashmi Agarwal. This is an open access article distributed under the Creative Commons Attribution License, which permits unrestricted use, distribution, and reproduction in any medium, provided the original work is properly cited.

Download Paper
Paper Id : IJRASET46611
Publish Date : 2022-09-04
ISSN : 2321-9653
Publisher Name : IJRASET
DOI Link : Click Here
 Submit Paper Online