

Ijraset Journal For Research in Applied Science and Engineering Technology
Monitoring Social Distancing Violation
Authors: Bokka Revanth Kumar, C. Sruthi, J Divya Vagdevi, D Sai Teja
DOI Link: https://doi.org/10.22214/ijraset.2022.44350
Certificate: View Certificate
Abstract
At the end of December 2019, Wuhan city in China was hit by the coronavirus illness 2019 (COVID-19). At this point, the infection has spread all over. The majority of governments have adopted a variety of steps to halt the spread of the disease. To prevent the transmission of COVID-19, people should keep a safe distance from one another. SD is one of the most effective treatments. Monitor social separation using a model that incorporates the data from YOLOv4. Starting with a video or photo, the model generates warnings for SD violations. At universities, malls, railway stations, and other public places, we deployed a deep learning system called YOLOv4 to better analyse pedestrian behaviour. A warning sub-system is activated as soon as the SD threshold (SDTH) or violation index (VI) are breached, resulting in an immediate awareness action. In addition, the current literature on SD, object recognition methods, and SD monitoring is thoroughly investigated and discussed in this work. While COVID-19 is still a threat, the model offered is designed to keep track of people in the areas where it is most prevalent.
Introduction
I. INTRODUCTION
Coronavirus-caused infections like COVID-19 were detected in Wuhan during the end of December 2020. On January 11, a 61-year-old man died of the illness in China. A total of 4000 people have died and more than 118000 people have been infected as of March 11, when the World Health Organization (WHO) declared it a pandemic. Coronavirus was proven in more than seven million people, with at least 406,900 deaths, according to data from John Hopkins University. No vaccine has been developed despite several attempts by health groups, scientists, and medical professionals across the country. This issue necessitates an alternative strategy to avert catastrophic consequences. There was a global lockdown in response to this crisis, and keeping a safe distance from friends and family has been suggested as a possible alternative. Distancing yourself from social situations is one of the most effective strategies for reducing the transmission of COVID-19. Reduce physical contact between sick and healthy persons is the primary objective. In order to prevent the spread of this disease, WHO recommends that people keep at least a one-meter (m) distance from one another.
Coronavirus disease has had a devastating effect on the world economy, and this study tries to reduce its impacts while minimising the loss of resources. A secondary objective was to develop a very reliable detection method for night time social isolation. People in overcrowded homes, especially in the height of summer's heat, look for opportunities to leave their homes with their family at night to get some fresh air. The urgency of the situation necessitates rapid response. Eksin et al. tested the SIR model and added social distancing to it. They found that the propagation of sickness is impacted by the social behaviour of those who are affected. SIR models with and without a behaviour change factor were compared, and they discovered that the SIR model with a behaviour change component performed better than a simple SIR model even after a large number of repeated observations. It has been reported that a startup business called Landing AI is developing an AI tool for gauging social distance in an office environment. [8] The company claims in a brief paper [8] that the future technology would be able to study people and determine if they are keeping a safe distance from the camera in real time.
To keep workers secure, they affirmed that this equipment may be simply integrated with existing security cameras in different work places. Gartner, the world's leading research firm, has identified landing AI as a cool provider in AI core technologies to recognise their timely determination to support the fight against the tragic situation of COVID-19.
All sectors were ordered to halt and wear face masks as a priority because of the devastating impact of the coronavirus. Fig 1 shows how Covid-19 has impacted several industries.
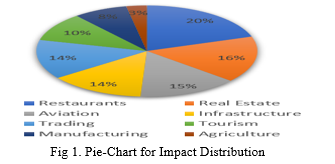
Restaurants had the greatest influence, accounting for 20% of the total impact, followed by Real Estate (16%) and other industries, according to the data. Similar results may be seen in the Agriculture sector, where Covid-19 had the lowest influence (3 percent). Fig 2 illustrates the total number of people who have been infected with Covid over time, based on the time stamp.
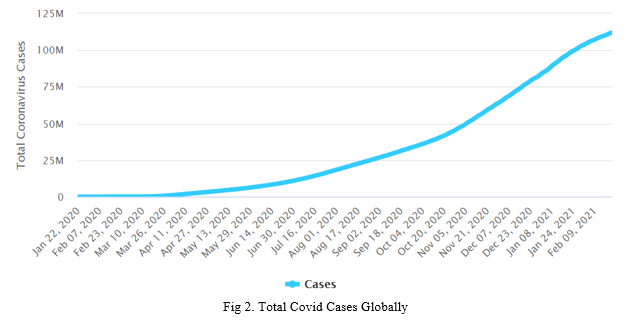
There was a noticeable increase in the number of instances from 0 to about 111 million by 9th February 2021, as can be seen by looking at the graph. These massive numbers were devastating and drove this epidemic to become a pandemic, affecting all countries with variable numbers on an individual basis.
II. LITERATURE REVIEW
Research by Prem et al. studied the impact of social isolation on the spread of the COVID-19 outbreak in Wuhan, China. Several social distance metrics were simulated by applying synthetic, location-specific contact patterns based on age structure susceptible-exposed-infected removed (SEIR) models to mimic an ongoing outbreak trajectory. Interventions are expected to grow sharply at first, but then level out as time goes on, leading to a secondary peak. To deal with the current scenario, social isolation is essential, but it is a costly strategy to reduce the spread of dangerous diseases.
For example, Adolph et al. examined the condition of social distancing in the United States and found that the lack of consensus among politicians and policymakers delays implementation of social distancing measures. This in turn causes long-term harm to the public's health. Though it has been beneficial in limiting the spread of disease, social isolation has had a negative impact on economic output.
Similarly, Kylie et al. discovered that the link between social distancing and transmissibility declines as transmissibility decreases among Chinese regions. The study found that a moderate level of exertion may be tolerated without causing an enormous epidemic.
With this in mind, Narinder and co-workers presented a deep learning-based structure that could be used to automate the process of monitoring social distance in surveillance videos. Bounding boxes were employed to separate humans from the backdrop using the YOLO v3 algorithm and a deep-sort approach.
An American study by Cob et al. looked at the correlation between COVID-19 growth rates and the number of orders for shelter in place in the United States (SIP). Forecasts were made using Random Forest Machine Learning, with SIP orders coming out on top. SIP orders will not only benefit the United States, but they will also benefit countries with a high COVID-19 population density. There is a growing interest in object detection using deep learning in the present research sector.
Machine learning algorithms such as ResNet-50 are integrated into the model developed by Mohamed Loey et al. The final layer of ResNet-50 was deleted and replaced with three typical machine learning classifiers (SVM, decision tree, and ensemble) in order to increase model performance. It took more time to train on this dataset than on any of the other datasets because it featured the biggest number of photos, which included both genuine and fake face masks. For this type of dataset, there is also no reported accuracy based on relevant publications. Using a dataset of actual face masks, the decision trees classifier was only able to achieve 68 percent classification accuracy on fake face masks.
SocialdistancingNet-19 by Rinkal Keniya is another method for determining if a person is safe or unsafe when the distance between them and the camera is less than a certain value. Using a webcam necessitates that people move constantly, or the detection will be inaccurate. This is possible as a result of the network's detection technology, which detects the full frame and calculates the distance between users using centroids (brute force approach).
III. METHODOLOGY
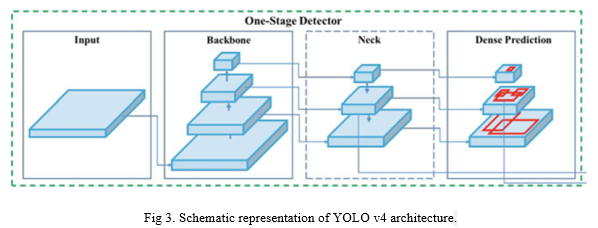
A. YOLO v4 Architecture
YOLO v4 is the subject of this section. The YOLO v4 architecture is depicted in Fig. 3.
- Backbone: This feature extractor uses CSPDarknet53, a graphics processing unit (GPU). For classification, few backbones are better than others. When it comes to picture classification, CSPResNext50 outperforms CSPDarknet53, although CSPDarknet53 has been shown to be better at object detection. A larger input network and more layers are necessary for the backbone model in order to improve detection of small objects.
- Neck: Path Aggregation Network (PAN) and Spatial Pyramid Pooling are used to extract feature maps (SPP). Concatenation has been substituted by addition in the PAN utilised in YOLO v4 compared to the original PAN. After reducing the size of N4 to achieve the same spatial size as P5, the original version summed this new depleted N4 with P5. Ni+1 is created by repeating this process at every level of Pi+1. Instead of adding Ni to Pi+1, they concatenated it in YOLO v4. As a general rule, the SPP performs max-pooling over the feature map with kernel sizes k = 5, 9, 13 with the same padding to maintain a consistent spatial dimension. A 19 x 19 x 2048 magnitude is created by merging four feature maps. This improves the model's accuracy while increasing inference time to a minimum, increasing the neck receptive field.
- Head: Ahead of YOLO v4, the anchor-based detection processes of YOLO v3 are still used.
B. YOLO v4 Performance Optimization
There are two kinds of strategies utilised to improve the accuracy of the object detector by the authors of YOLO v4. They looked at both ways to see if they could achieve the best of both worlds. Both of these types are:
- Bag of Freebies (BoF): Improved object detection without increasing the cost of inference is the goal of this procedure. This is an example of data augmentation because the model's generalisation capacity is weak when trained on little datasets. Overfitting is a common problem when a deep neural network tries to learn the most prevalent pattern. For overfitting, a variety of solutions have been offered. One of these strategies is data augmentation, and it can help us reduce model overfitting. For instance, we can vary the dispersion between pixels to alter the brightness of a picture, or we can crop and rotate a picture geometrically. Regularization methods can also be used to prevent overfitting. As demonstrated in Eq. 1, the mean squared difference between the observed and true values is a regularly used regression strategy.
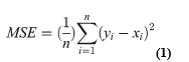
2. For example, MSE views variables as independent rather than integrated. IoU loss is a solution that takes into account both the actual and predicted areas of the ground truth bounding box (BBox). GIoU loss enhances this idea by include the object's orientation and form in the region. As an alternative method of measuring area, aspect ratio and distance between centre points, CIoU can be used. YOLO v4 uses CIoU loss to define bounding boxes because to its higher performance and faster convergence.
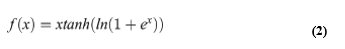
3. Bag of Specials (BoS): Preprocessing approaches and elements that only add a little amount of inference cost but have a significant impact on the accuracy of the detection of the target item. The new Spatial Attention Module is taken into account by YOLO v4 (SAM). SAM uses a convolutional layer with a sigmoid activation function and then multiplies the feature map with the original feature map, rather than using max and average pooling.. YoLO v4 backbone is activated by Mish activation function, as defined in Eq. ( (2). For example, using the CIFAR100 dataset, Mish and the Squeeze Excite Network improve accuracy by 0.494 percent and 1.671 percent over ReLU and Swish-based networks.
C. SD Monitoring Model
YOLOv4 object detection is used to build a model for monitoring social distance (SD). There are various stages to this model's operation. Once the picture/video is received or captured, the SD violation warnings and alerts are generated and displayed. There are several advantages to the YOLOv4 detector over the YOLOv3, as stated above. YOLOv4's functionalities are configured so that only individuals are detected in every frame of video, hence excluding the possibility of other things being detected. People and pedestrians are to be tracked and monitored in public venues including train stations, markets, and institutions. The model creates a green box around each detected object, indicating its location in space. Measurement of the distance between the centroids of distinct objects is used to discover SD violations in this model. The violation indicator (VI), based on the SD threshold (SDTH), is what determines the safety of the people. According to general rule, VI returns a value of 0 when the measured distance between persons falls below a particular threshold (SDTH) and delivers a value of 1 when the measured distance exceeds SDTH.
Continuous observation of persons and the calculation of their VI should be the goal of the algorithm. People who break the social distancing laws will be placed in solitary confinement if their VI value is more than one. Additionally, red-colored boxes are shown surrounding the object's centroid. Finally, the alarming subsystem will make a swift decision on how to send information about this undesirable circumstance. As a result, we have created a customizable option in which the system can either notify violators by sending an alert to the same location as the violation, or it can send an SMS/Email/WhatsApp message to notify them. In addition, a message with the specific location of the infringing group will be sent to the nearest police car/station/office around the spot. The system administrator or the person in charge of running the model is frequently the one to decide on the waning kind. An image or video of the offender(s), their location, time and date, and the exact distance driven will be displayed on a screen in all cases.
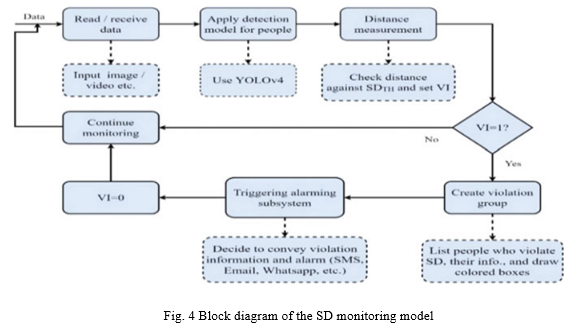
We improved the speed and accuracy of people recognition in the SD monitoring model by including a cutting-edge object detection model (YOLOv4). SD violations can be detected more quickly and correctly with this method, which helps to reduce the spread of COVID-19. Figure 4 depicts the SD monitoring model's block diagram. After that, we'll explain how we feel about the new model.
IV. EXPERIMENTAL RESULT
Strolling office people video, pedestrian overpass, the Virat dataset and the mall dataset have all been used to try out the SD monitoring model. Data gathered from the internet is used for all of these datasets. In each dataset, we used three distinct SDTH settings in the experiments. YOLOv4 relies on the SDTH it receives from the model algorithm to decide how far away humans displayed in the video should be. It immediately identifies any violation as soon as the VI value becomes one using the SDTH previously stated. Social distancing protocols define how far people should remain from one another, yet we have utilized SDTH values of [0.5, 1.5] metres to highlight how detection occurs when this distance changes.../. However, alternative SDTH values can also be tried in the model introduced. There will be a variety of outcomes and violations depending on the dataset utilized in SDTH's current version. Detailed details about each pedestrian dataset may be found in Table1.
Data from datasets 1 through 6 were subjected to the SD monitoring model and the results are shown in Figures 5, 6, and 7. Table 2 shows the number of people who broke the law as a result of various SDTH settings. There are no issues with YOLOv4's SD monitoring model using the datasets given, based on the results shown above. Higher SDTH values lead to more violations, while lower SDTH values lead to fewer. The SDTH may have a different value depending on the location, institution, country, etc. where it is declared by the authorities. This, however, is not in conflict with the experimental setups and outcomes that we've discussed thus far. An alternative view is that different SDTH layouts can produce varying levels of violation. Because of this, the SD monitoring model is able to perform well in a variety of situations where authorities/management/etc. have enforced varying values of SDTH.
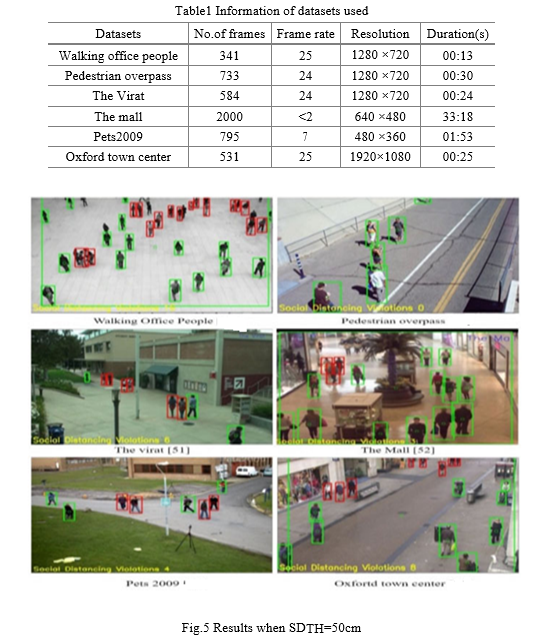
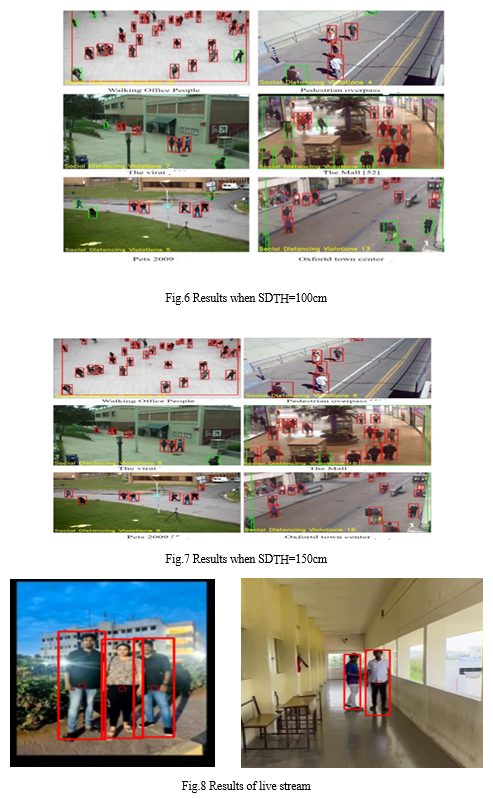
Table2 Number of people violating the SD at different values of SDTH
|
Dataset used |
No.of violating people with a different configuration of SDTH applied on a single frame |
||
|
SDTH=50cm |
SDTH=100cm |
SDTH=150 cm |
|
|
Walking office people |
16 |
29 |
33 |
|
Pedestrian overpass |
0 |
4 |
6 |
|
The Virat |
6 |
7 |
8 |
|
The mall |
3 |
10 |
15 |
|
Pets2009 |
4 |
5 |
8 |
|
Oxford town center |
8 |
13 |
16 |
Conclusion
As infectious diseases like COVID-19 proliferate, social isolation is a crucial tool in the fight against them. Use it to see if people are following to public health rules, humanitarian and law enforcement personnel. Here, we show an SD monitoring model using YOLOv4. Any breach of social separation at designated locations is constantly monitored by the model and reported to an alarming subsystem. SD, object detection, and previous literature have been extensively studied and examined. To demonstrate and verify the newly proposed model, we employed six different datasets and three different SDTH configurations. The outcomes of the implementation have been shown in order to demonstrate how the model works when people are close to one another. The alarming sub-system will be implemented in the near future so that individuals will be alerted right away if a violation is discovered.
References
[1] Prem K, Liu Y, Russell TW, Kucharski AJ, Eggo RM, Davies N, et al. The effect of control strategies to reduce social mixing on outcomes of the COVID-19 epidemic in Wuhan, China: a modelling study. The Lancet Public Health. 2020;. pmid:32220655 [2] Adolph C, Amano K, Bang-Jensen B, Fullman N, Wilkerson J. Pandemic politics: Timing state-level social distancing responses to COVID-19. medRxiv. 2020. [3] Ainslie KE, Walters CE, Fu H, Bhatia S, Wang H, Xi X, et al. Evidence of initial success for China exiting COVID-19 social distancing policy after achieving containment. Wellcome Open Research. 2020;5. pmid:32500100 [4] Punn NS, Sonbhadra SK, Agarwal S. Monitoring COVID-19 social distancing with person detection and tracking via fine-tuned YOLO v3 and Deepsort techniques. arXiv preprint arXiv:200501385. 2020. [5] Sulman N, Sanocki T, Goldgof D, Kasturi R. How effective is human video surveillance performance? In: 2008 19th International Conference on Pattern Recognition. IEEE; 2008. p. 1–3. [6] Redmon J, Farhadi A. Yolov3: An incremental improvement. arXiv preprint arXiv:180402767. 2018. [7] Cobb J, Seale M. Examining the effect of social distancing on the compound growth rate of SARS-CoV-2 at the county level (United States) using statistical analyses and a random forest machine learning model. Public Health. 2020;. pmid:32526559 [8] Mohamed Loey , Gunasekaran Manogaran, Mohamed Hamed N. Taha , Nour Eldeen M. Khalifa;A hybrid deep transfer learning model with machine learning methods for face mask detection in the era of the COVID-19 pandemic (2020) [9] Shashi Yadav,Goel Institute of Technology and Management, Dr. A.P.J. Abdul Kalam Technical University ,Deep Learning based Safe Social Distancing and Face Mask Detection in Public Areas for COVID-19 Safety Guidelines Adherence (2020) [10] 2D Object Recognition Techniques State-of-the-Art Work.pdf. [11] Waykole, R.N., Thakare, A.D.: A review of feature extraction methods for text classification. Int. J. Adv. Eng. Res. Dev. 5(04), 351–354 (2018) [12] Chamola, V., Hassija, V., Gupta, V., Guizani, M.: A comprehensive review of the COVID-19 pandemic and the role of IoT, Drones, AI, Blockchain, and 5G in managing its impact. IEEE Access. 8(April), 90225–90265 (2020) [13] Abdelhafiz, A.S., Mohammed, Z., Ibrahim, M.E., Ziady, H.H., Alorabi, M., Ayyad, M., et al.: Knowledge, perceptions, and attitude of Egyptians towards the novel coronavirus disease (COVID-19). J. Commun. Health 45(5), 881–890 (2020). https://doi.org/10.1007/s10 900-020-00827-7 [14] Social distancing is out, physical distancing is in—here’s how to do it—National | Globalnews.ca [Internet]. [cited 2020 Dec 12]. https://globalnews.ca/news/6717166/what-is-phy sical-distancing/ [15] Bikson, M., Hanlon, C.A., Woods, A.J., Gillick, B.T., Charvet, L., Lamm, C., et al.: Guidelines for TMS/tES clinical services and research through the COVID-19 pandemic. Brain Stimul. 13(4), 1124–1149 (2020). https://doi.org/10.1016/j.brs.2020.05.010 [16] Newbold, S.C., Finnoff, D., Thunström, L., Ashworth, M., Shogren, J.F.: Effects of physical distancing to control COVID-19 on public health, the economy, and the environment. Environ. Res. Econ. 76(4), 705–729 (2020) [17] Punn, N.S., Sonbhadra, S.K., Agarwal, S.: Monitoring COVID-19 social distancing with person detection and tracking via fine-tuned YOLO v3 and Deepsort techniques, pp 1–10 (2020) [18] Garg, C., Bansal, A., Padappayil, R.P.: COVID-19: Prolonged social distancing implementation strategy using blockchain-based movement passes. J. Med. Syst. 44(9), 165 (2020) [19] Qian, M., Jiang, J.: COVID-19 and social distancing. J. Public Heal. (2020) (Mikulska 2019) [20] Coronavirus: What is “flattening the curve,” and will it work? | Live science
Copyright
Copyright © 2022 Bokka Revanth Kumar, C. Sruthi, J Divya Vagdevi, D Sai Teja. This is an open access article distributed under the Creative Commons Attribution License, which permits unrestricted use, distribution, and reproduction in any medium, provided the original work is properly cited.

Download Paper
Paper Id : IJRASET44350
Publish Date : 2022-06-16
ISSN : 2321-9653
Publisher Name : IJRASET
DOI Link : Click Here
 Submit Paper Online