

Ijraset Journal For Research in Applied Science and Engineering Technology
Estimation of Parameters of Lomax Distribution by Using Maximum Product Spacings Method
Authors: Ch. V. Aruna, O. V. Raja Sekharam, G. V. S. R. Anjaneyulu
DOI Link: https://doi.org/10.22214/ijraset.2022.39900
Certificate: View Certificate
Abstract
The objective of this paper is to estimate the parameters of Lomax distribution with shape parameter(?) and scale parameter(?). In this heuristic algorithm, the Maximum Product Spacings Method is used to Estimates the parameters of Lomax Distribution. We also computed Average Estimate (AE), Variance (VAR), Mean Absolute Deviation (MAD), Mean Square Error (MSE), Relative Error (RE) and Relative Absolute Bias (RAB) for both the parameters under grouped sample based on 1000 simulations to assess the performance of the estimators. And also compare Maximum Product Spacings Method with Least Squares Regression Method and Median Rank Regression Method.
Introduction
I. INTRODUCTION
Torabi (2008) proposed a general method of Minimum Spacings Distance Estimators and a related 53 method of hypothesis testing based on Spacings. Consider different parameter estimation methods in Generalized Half Log Logistic distribution based on Complete and Censored Data by Torabi and Bagheri (2010). Ramamohan et al. (2011) studied using Minimum Spaceing Square Distance Estimation Method from an optimally constructed grouped sample for Estimation of Scale parameter (σ) when Shape parameter (β) is known in Log Logistic Distribution. We know that the Maximum Likelihood Method of estimation and the Moments Method of estimation are most general methods of estimation. Although Maximum Likelihood Estimation method is advantageous in the good judgment of its efficiency and has good theoretical properties, there is confirmation that it does not execute well, in particular in the case of small samples. The method of moments is simply applicable and often gives precise forms for estimators of unknown parameters. There are several cases where the method of moments does not give explicit estimators (e.g., for the parameters of the Gompertz and Weibull distributions). This spacings-based estimation process provides an alternative to the fixed parametric estimation methods like the Method of Moments, Minimum Two, Maximum Likelihood (ML), and so on. Cheng and Amin (1979, 1983) studied the estimation method that generalizes the initiative contained in the Maximum Spacings Estimator (MSE) and separately discussed by Ranneby (1984) and enjoys similar compensations. Cheng and Amin (1983) communicate that in such situations as a threeparameter Lognormal Gamma, Weibull distribution where the ML method breaks down due to unboundedness of the likelihood, the Maximum Spacings Estimation (MSPE) method produces reliable and asymptotically resourceful estimators. In some situations like mixtures of normals where the MLE is known to turn out inconsistent estimators, the MPS estimators are consistent (see Ranneby, 1984). Kaushik Ghosh (2001) considered a general estimation method using spacings it is shown that the Maximum Spacing Estimator is asymptotically most efficient within the subclass of spacings based estimators. Ehab Mohamed Almetwally et al (2019) calculated the Maximum Product Spacings and Bayesian Method for Parameter Estimation for Generalized Power Weibull Distribution under Censoring Scheme. Yongzhao Shao (2001) deliberated the Consistency of the Maximum Product of Spacings Method and Estimation of a unimodal distribution. Recently many of authors studied some of the different estimation procedures like Vijaya lakshmi, Raja Sekharam and Anjaneyulu (2018) studied Estimation of Scale (λ) and Location (µ) of two-parameter Rayleigh distribution by using Median Ranks estimated method. Vijaya lakshmi, Raja Sekharam and Anjaneyulu (2019) studied Estimation of Scale (q) and Shape (α) parameters of Power Function Distribution by Least Squares Method using Optimally Constructed Grouped data. Vijaya lakshmi and Anjaneyulu (2019) studied estimation of Location (μ) and Scale (λ) for two-parameter Half Logistic Pareto Distribution (HLPD) by Least Square Regression Method. Vijaya lakshmi and Anjaneyulu (2019) studied Estimation of Location (μ) and Scale (λ) for Two-Parameter Half Logistic Pareto Distribution (HLPD) by Median Rank Regression Method.
In this chapter, we discuss about the estimation procedure for the unknown parameters for Lomax distribution. The idea behind the Maximum Product Spacings parameter estimation is to determine the parameters for the given sample data. We present MPS of the unknown scale and shape parameters of Lomax distribution using Newton-Raphson iterative procedure.
We also compute Average Estimate (AE), Variance (VAR), Standard Deviation (SD), Mean Absolute Deviation (MAD), Mean Square Error (MSE) and Relative Absolute Bias (RAB) for both the parameters under sample based on 10,000 simulations to assess the performance of the estimators. Finally, the proposed estimation method be examined with applied on real and generalized data sets.
II. ESTIMATION OF PARAMETERS OF LOMAX DISTRIBUTION MAXIMUM PRODUCT SPACINGS(MPS) METHOD
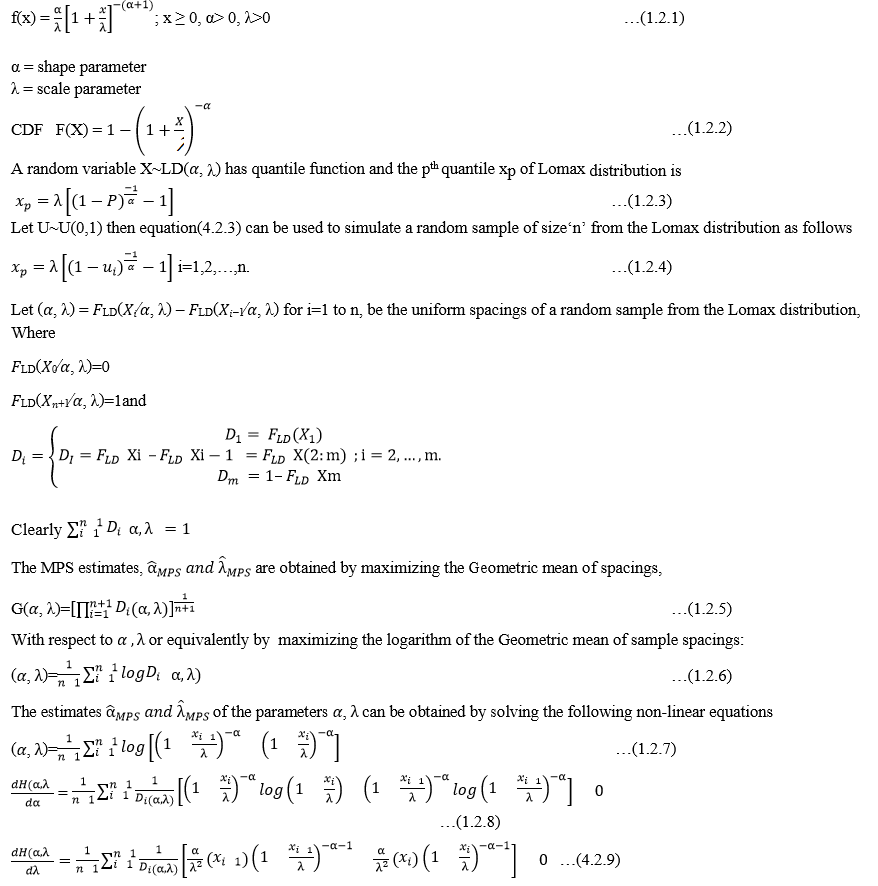
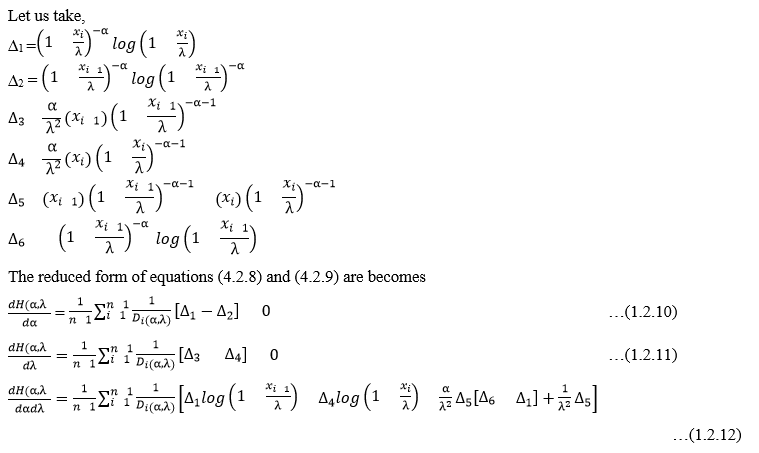
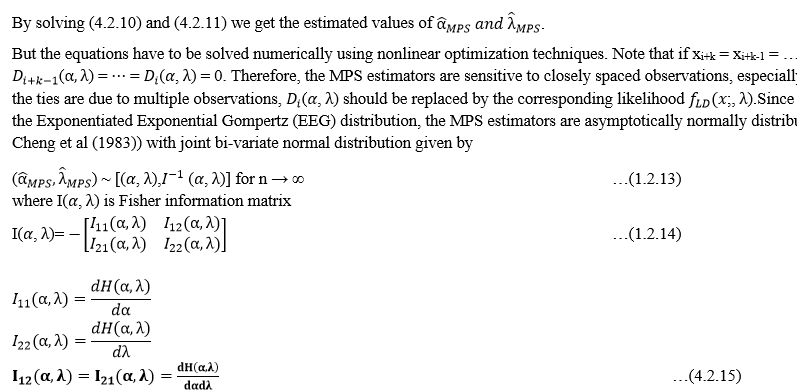
Let x1, x2,..., xn be a random sample of size n from LD(α, λ), its probability density function (pdf) and Cumulative Distribution Function(CDF) are given by
III. SIMULATION STUDY
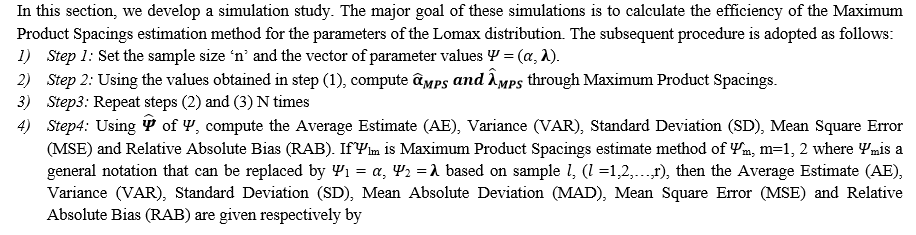
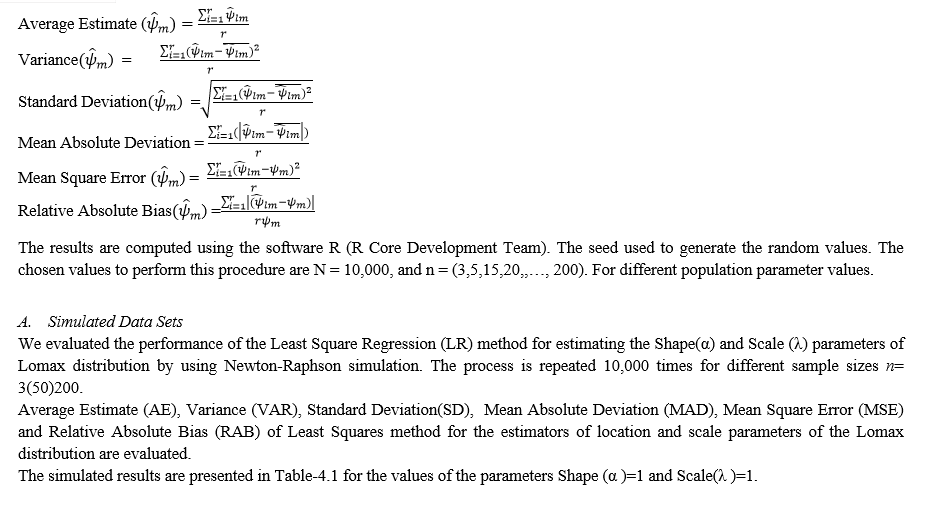
Table-1.1
Maximum product Spacings Method- Lomax Distribution
|
Sample size |
Parameter |
AE |
VAR |
SD |
MAD |
MSE |
RAB |
|
3 |
α |
-1.2887 |
0.73748 |
0.8588 |
0.4401 |
5.9758 |
2.2887 |
|
λ |
0.35326 |
0.43256 |
0.6577 |
0.3252 |
0.8508 |
0.7884 |
|
|
5 |
α |
-1.0597 |
0.03201 |
0.1789 |
0.1198 |
4.2742 |
2.0597 |
|
λ |
0.14462 |
0.02312 |
0.1521 |
0.1027 |
0.7548 |
0.8569 |
|
|
15 |
α |
-1.0057 |
0.00048 |
0.0219 |
0.0153 |
4.0231 |
2.0057 |
|
λ |
0.03108 |
0.00043 |
0.0207 |
0.0163 |
0.9392 |
0.9689 |
|
|
20 |
α |
-1.0032 |
0.00017 |
0.013 |
0.0091 |
4.0129 |
2.0032 |
|
λ |
0.02125 |
0.00018 |
0.0134 |
0.0106 |
0.9581 |
0.9788 |
|
|
25 |
α |
-1.0021 |
0.00008 |
0.0089 |
0.0062 |
4.0083 |
2.0021 |
|
λ |
0.01593 |
0.00009 |
0.0095 |
0.0076 |
0.9685 |
0.9841 |
|
|
50 |
α |
-1.0005 |
0.00001 |
0.0032 |
0.0019 |
4.0021 |
2.0005 |
|
λ |
0.00653 |
0.00001 |
0.0032 |
0.0028 |
0.987 |
0.9935 |
|
|
100 |
α |
-1.0001 |
0 |
0 |
0.0006 |
4.0005 |
2.0001 |
|
λ |
0.00275 |
0 |
0 |
0.0011 |
0.9945 |
0.9973 |
|
|
200 |
α |
-1 |
0 |
0 |
0.0002 |
4.0001 |
2 |
|
λ |
0.0012 |
0 |
0 |
0.0004 |
0.9976 |
0.9988 |
We evaluated the performance of the Least Square Regression (LR) method for estimating the Shape(α)and Scale (λ) parameters of Lomax distribution by using Newton-Raphson simulation the process is repeated 10,000 times for different sample sizes n=3(50)200.
Average Estimate (AE), Variance (VAR), Standard Deviation (SD), Mean Absolute Deviation (MAD), Mean Square Error (MSE) and Relative Absolute Bias (RAB) of Least Squares method for the estimators of location and scale parameters of the Lomax distribution are evaluated.
The simulated results are presented in Table-4.2 for the values of the parameters Shape (α )=3 and Scale(λ) =1.5.
Table-1.2
Maximum Product Spacings Method- Lomax Distribution
|
Sample size |
Parameter |
AE |
VAR |
SD |
MAD |
MSE |
RAB |
|
3 |
α |
-1.2832 |
0.81474 |
0.90263 |
0.43747 |
19.1605 |
4.28319 |
|
λ |
0.47188 |
0.68624 |
0.8284 |
0.43298 |
1.74328 |
1.1971 |
|
|
5 |
α |
-1.0625 |
0.03102 |
0.17612 |
0.11845 |
16.5353 |
4.06254 |
|
λ |
0.21596 |
0.05215 |
0.22836 |
0.15266 |
1.7009 |
1.28714 |
|
|
15 |
α |
-1.0058 |
0.00046 |
0.02145 |
0.01501 |
16.0466 |
4.00576 |
|
λ |
0.05163 |
0.00126 |
0.0355 |
0.02757 |
2.09903 |
1.44837 |
|
|
20 |
α |
-1.0031 |
0.00017 |
0.01304 |
0.00917 |
16.0249 |
4.00309 |
|
λ |
0.03604 |
0.00054 |
0.02324 |
0.01814 |
2.14372 |
1.46396 |
|
|
25 |
α |
-1.0021 |
0.00008 |
0.00894 |
0.00624 |
16.0172 |
4.00213 |
|
λ |
0.02705 |
0.00028 |
0.01673 |
0.01317 |
2.16987 |
1.47295 |
|
|
50 |
α |
-1.0005 |
0.00001 |
0.00316 |
0.00185 |
16.0039 |
4.00049 |
|
λ |
0.01129 |
0.00004 |
0.00632 |
0.00497 |
2.2163 |
1.48871 |
|
|
100 |
α |
-1.0001 |
0 |
0 |
0.00056 |
16.001 |
4.00012 |
|
λ |
0.0048 |
0.00001 |
0.00316 |
0.00194 |
2.23563 |
1.4952 |
|
|
200 |
α |
-1 |
0 |
0 |
0.00018 |
16.0003 |
4.00003 |
|
λ |
0.00208 |
0 |
0 |
0.00077 |
2.24376 |
1.49792 |
We evaluated the performance of the Least Square Regression (LR) method for estimating the Shape(α)and Scale (λ) parameters of Lomax distribution by using Newton-Raphson simulation. The process is repeated 10,000 times for different sample sizes n=3(50)200.
Average Estimate (AE), Variance (VAR), Standard Deviation(SD), Mean Absolute Deviation (MAD), Mean Square Error (MSE) and Relative Absolute Bias (RAB) of Least Squares method for the estimators of location and scale parameters of the Lomax distribution are evaluated.
The simulated results are presented in Table-4.3 for the values of the parameters Shape(α )=1.5 and Scale (λ )=3.
Table-1.3
Maximum Product Spacings Method- Lomax Distribution
|
Sample size |
Parameter |
AE |
VAR |
SD |
MAD |
MSE |
RAB |
|
3 |
α |
-1.2926 |
1.42072 |
1.1919 |
0.447 |
9.2194 |
2.7926 |
|
λ |
1.00787 |
4.13341 |
2.0331 |
0.9239 |
8.102 |
2.3618 |
|
|
5 |
α |
-1.0623 |
0.03136 |
0.1771 |
0.1192 |
6.5968 |
2.5623 |
|
λ |
0.42674 |
0.19282 |
0.4391 |
0.302 |
6.8145 |
2.577 |
|
|
15 |
α |
-1.006 |
0.00051 |
0.0226 |
0.0156 |
6.2806 |
2.506 |
|
λ |
0.09866 |
0.00457 |
0.0676 |
0.0526 |
8.4224 |
2.9013 |
|
|
20 |
α |
-1.0033 |
0.00017 |
0.013 |
0.009 |
6.2668 |
2.5033 |
|
λ |
0.0673 |
0.00182 |
0.0427 |
0.0339 |
8.6025 |
2.9327 |
|
|
25 |
α |
-1.0019 |
0.00008 |
0.0089 |
0.0061 |
6.2597 |
2.5019 |
|
λ |
0.05029 |
0.00094 |
0.0307 |
0.0243 |
8.7018 |
2.9497 |
|
|
50 |
α |
-1.0005 |
0.00001 |
0.0032 |
0.0019 |
6.2527 |
2.5005 |
|
λ |
0.02075 |
0.00013 |
0.0114 |
0.009 |
8.876 |
2.9793 |
|
|
100 |
α |
-1.0001 |
0 |
0 |
0.0006 |
6.2507 |
2.5001 |
|
λ |
0.00879 |
0.00002 |
0.0045 |
0.0035 |
8.9474 |
2.9912 |
|
|
200 |
α |
-1 |
0 |
0 |
0.0002 |
6.2502 |
2.5 |
|
λ |
0.00384 |
0 |
0 |
0.0014 |
8.977 |
2.9962 |
IV. OBSERVATIONS FOR THE SIMULATION RESULT
- When we increase the sample size the AE value of shape parameter (α) increased, scale parameter (λ ) decreased.
- In all the tables when we increase the sample size VAR, SD, MAD and MSE are decreased.
- In some of the tables when we increase the sample size RAB of scale parameter (λ ) increased.
V. COMPARISON OF MAXIMUM PRODUCT SPACINGS METHOD WITH LEAST SQURES AND MEDIAN RANK REGRESSION METHOD ESTIMATORS FOR DIFFERENT VALUES OF SHAPE PARAMETER (α) = 2 AND SCALE PARAMETER (λ ) = 1.5
- SCALE PARAMETER (λ ) = 1.5
|
MRR |
LSR |
MPS |
|||||
|
Sample Size |
Para meters |
AE |
VAR |
AE |
VAR |
AE |
VAR |
|
3 |
α |
0.13355 |
0.000007 |
0.126487 |
0.000006 |
-1.31249 |
4.61748 |
|
λ |
0.758815 |
0.006755 |
0.796278 |
0.005506 |
0.4928 |
3.696 |
|
|
5 |
α |
0.1423 |
0.000011 |
0.1348 |
0.000009 |
-1.0596 |
0.03107 |
|
λ |
0.730828 |
0.002009 |
0.758069 |
0.001774 |
0.21675 |
0.05124 |
|
|
15 |
α |
0.154193 |
0.000009 |
0.148818 |
0.000008 |
-1.00568 |
0.00048 |
|
λ |
0.613205 |
0.002408 |
0.628311 |
0.002271 |
0.04998 |
0.0012 |
|
|
20 |
α |
0.153081 |
0.000013 |
0.148839 |
0.000012 |
-1.00305 |
0.00017 |
|
λ |
0.631949 |
0.004402 |
0.644091 |
0.00426 |
0.03471 |
0.0005 |
|
|
25 |
α |
0.157278 |
0.000013 |
0.15316 |
0.000011 |
-1.00204 |
0.00008 |
|
λ |
0.587024 |
0.004466 |
0.597643 |
0.004363 |
0.02589 |
0.00026 |
|
|
50 |
α |
0.162812 |
0.000005 |
0.16004 |
0.000005 |
-1.00051 |
0.00001 |
|
λ |
0.754326 |
0.00547 |
0.760134 |
0.005269 |
0.01086 |
0.00003 |
|
|
100 |
α |
0.168612 |
0.000002 |
0.166655 |
0.000002 |
-1.00014 |
0 |
|
λ |
1.101465 |
0.000189 |
1.101546 |
0.0002 |
0.00461 |
0.00001 |
|
|
200 |
α |
0.168919 |
0.000008 |
0.167749 |
0.000008 |
-1.00003 |
0 |
|
λ |
1.180636 |
0.002108 |
1.181462 |
0.002148 |
0.00199 |
0 |
|
- Observations
- When comparing MPS with MRR and LSR , in MPS the AE is decreasing for the both shape and scale parameters when the sample size is increasing.
- In MRR and in LSR the AE is increasing for the both shape and scale parameters when the sample size is increasing.
- When comparing MPS with MRR and LSR , in MPS the VAR is decreasing for the both shape and scale parameters when the sample size is increasing.
|
MRR |
LSR |
MPS |
|||||
|
Sample Size |
Para meters |
SD |
MAD |
SD |
MAD |
SD |
MAD |
|
3 |
α |
0.000002 |
0.002415 |
0 |
0.002115 |
2.14883 |
0.47254 |
|
λ |
0.000046 |
0.05694 |
0.00003 |
0.051332 |
1.9225 |
0.45431 |
|
|
5 |
α |
0.000001 |
0.002799 |
0 |
0.002561 |
0.17627 |
0.11911 |
|
λ |
0.000004 |
0.026562 |
0.000003 |
0.025024 |
0.22636 |
0.15487 |
|
|
15 |
α |
0.000003 |
0.002421 |
0 |
0.002259 |
0.02191 |
0.01525 |
|
λ |
0.000006 |
0.032053 |
0.000005 |
0.031124 |
0.03464 |
0.02691 |
|
|
20 |
α |
0.000001 |
0.003376 |
0 |
0.003143 |
0.01304 |
0.00908 |
|
λ |
0.000019 |
0.03914 |
0.000018 |
0.038492 |
0.02236 |
0.01745 |
|
|
25 |
α |
0.000001 |
0.002873 |
0 |
0.002738 |
0.00894 |
0.00619 |
|
λ |
0.00002 |
0.048829 |
0.000019 |
0.048335 |
0.01612 |
0.01269 |
|
|
50 |
α |
0.000001 |
0.001752 |
0 |
0.001644 |
0.00316 |
0.00189 |
|
λ |
0.00003 |
0.05703 |
0.000028 |
0.056071 |
0.00548 |
0.00474 |
|
|
100 |
α |
0.000001 |
0.001121 |
0 |
0.001073 |
0 |
0.00057 |
|
λ |
0.000001 |
0.010745 |
0 |
0.01104 |
0.00316 |
0.00186 |
|
|
200 |
α |
0.000002 |
0.002439 |
0 |
0.002369 |
0 |
0.00018 |
|
λ |
0.000004 |
0.033769 |
0.000005 |
0.034022 |
0 |
0.00074 |
|
- Observations
- When comparing MPS with MRR and LSR , in MPS the SD and MAD are decreasing for the both shape and scale parameters when the sample size is increasing.
- In MRR and LSR methods SD is decreasing and MAD is increasing when the sample size is increasing.
|
MRR |
LSR |
MPS |
|||||
|
Sample Size |
Para meters |
MSE |
RAB |
MSE |
RAB |
MSE |
RAB |
|
3 |
α |
0.026353 |
0.001682 |
0.021976 |
0.002258 |
15.5901 |
3.31249 |
|
λ |
0.064925 |
0.013274 |
0.047009 |
0.012459 |
4.71046 |
1.20432 |
|
|
5 |
α |
0.034908 |
0.003806 |
0.029543 |
0.003144 |
9.39225 |
3.0596 |
|
λ |
0.074463 |
0.012622 |
0.060305 |
0.011841 |
1.69796 |
1.2853 |
|
|
15 |
α |
0.050104 |
0.005136 |
0.045207 |
0.004927 |
9.03457 |
3.00568 |
|
λ |
0.152019 |
0.00877 |
0.140424 |
0.008606 |
2.10374 |
1.45002 |
|
|
20 |
α |
0.050016 |
0.006878 |
0.046032 |
0.006068 |
9.01847 |
3.00305 |
|
λ |
0.139863 |
0.025271 |
0.130931 |
0.024954 |
2.14758 |
1.46529 |
|
|
25 |
α |
0.051838 |
0.012577 |
0.048083 |
0.012698 |
9.01232 |
3.00204 |
|
λ |
0.175016 |
0.011681 |
0.166253 |
0.011475 |
2.17326 |
1.47411 |
|
|
50 |
α |
0.0391 |
0.022202 |
0.037441 |
0.022058 |
9.00308 |
3.00051 |
|
λ |
0.065825 |
0.000604 |
0.062804 |
0.000734 |
2.21757 |
1.48914 |
|
|
100 |
α |
0.023341 |
9.644795 |
0.022829 |
9.70607 |
9.00083 |
3.00014 |
|
λ |
0.010484 |
0.101466 |
0.010511 |
0.101546 |
2.2362 |
1.49539 |
|
|
200 |
α |
0.020424 |
5.488071 |
0.020117 |
5.466375 |
9.0002 |
3.00003 |
|
λ |
0.034738 |
0.180636 |
0.035076 |
0.181462 |
2.24403 |
1.49801 |
|
- Observations
- In MPS the MSE is decreasing and RAB is decreasing for shape parameter and increasing for scale parameter when the sample size is increasing.
- In MRR and LSR, the RAB is increasing when sample size is increasing.
Conclusion
A. MPS estimator is the best one for estimating the parameters of the Lomax distribution in comparison with MRR and LSR. B. The MPS estimator has the smallest MSE, Variance (VAR), Standard deviation (SD), Mean absolute deviation (MAD), Mean Square Error (MSE), Relative Absolute Bias(RAB) for both parameters, proving to be the slightly most efficient method compared to MRR and LSR for estimating the unknown parameters.
References
[1] Torabi, H. (2008): A general method for Estimating and Hypotheses Testing Using Spacings, Journal of Statistical Theory and Applications Vol.8 (2), pp. 163-168. [2] Ramamohan, Ch. and Anjaneyulu, G. V. S. R. (2013) : Estimation of Scale (?) when Shape (?) parameter is known using least squares method from an optimally constructed grouped sample, Frontiers of statistics and its applications, Bonfring publication. pp. 205-209. [3] Yongzhao Shao, (2001): Consistency of the Maximum Product of Spacings Method and Estimation of a Unimodal Distribution, Statistica Sinica, Vol. 11, pp. 1125-1140 [4] Vijaya Lakshmi, M. and Anjaneyulu, G. V. S. R. (2019): Estimation of Location (?) and Scale (?) for Two-Parameter Half Logistic Pareto Distribution (HLPD) by Median Rank Regression Method, International Journal of Research and Analytical Reviews, Vol. 6(2), PP. 558-56. [5] Ramamohan, Ch. and Anjaneyulu, G. V. S. R. (2013) : Comparison of least square estimators with rank regression estimators of Weibull distribution, International Journal for Research in Applied Science & Engineering Technology (IJRASET), Vol. 20, pp.1-10. [6] K. Srinivasa Rao , N. Viswam, G.V.S.R. Anjaneyulu, Estimation of parameters of PERT distribution by using maximum product of spacings method, © 2021 IJCRT | Volume 9, Issue 9 September 2021 | ISSN: 2320-2882
Copyright
Copyright © 2022 Ch. V. Aruna, O. V. Raja Sekharam, G. V. S. R. Anjaneyulu. This is an open access article distributed under the Creative Commons Attribution License, which permits unrestricted use, distribution, and reproduction in any medium, provided the original work is properly cited.

Download Paper
Paper Id : IJRASET39900
Publish Date : 2022-01-12
ISSN : 2321-9653
Publisher Name : IJRASET
DOI Link : Click Here
 Submit Paper Online