

Ijraset Journal For Research in Applied Science and Engineering Technology
Prediction of House Prices Using Machine Learning
Authors: Sumanth Mysore, Abhinay Muthineni, Vaishnavi Nandikandi, Sudersan Behera
DOI Link: https://doi.org/10.22214/ijraset.2022.44033
Certificate: View Certificate
Abstract
Economy of the country is greatly driven by the prices of houses in that country. Both buyers and sellers depend on the pricing strategies. Ask an emptor to explain the factors they think are considered for pricing the house at that price and that they probably start with railways and end with various attributes. Over here it proves that more factors will be applied on the pricing strategies of the house. The aim of the project is to predict the house prices with various regression models. Nowadays Machine Learning is a booming technology. Data is the heart of Machine Learning. AI and Machine Learning holds the key position in the technological market. All industries are moving towards automation. So we have considered ML as a main predicting subject in our project and worked using it. These days everything fluctuates. Starting with crypto and various business models varies day by day which includes real estate as well so in this project house prediction depends on real estate data and ML techniques. Many people want to buy a good house within the budget. But the disadvantage is that the present system doesn’t calculate the house predictions so well and end up in loss of money. So, the goal of our project is to reduce money loss and buy good house. Many factors are there to be considered in order to predict the house price which includes budget factors and fewer house modifications according to the buyer. So, we are considering all of those factors and predicted using various machine learning techniques like SVR, KNN, SGB regression, CatBoost regression, Random forest regression
Introduction
I. INTRODUCTION
As Artificial Intelligence is involving everywhere in the world there is stupendous amount of increase in technology in our day-to-day life and implementation of various advanced machines has been increased. As growth of innovations to business is going upward computer sciences tend to increase technological transformations. This can put out the vulnerability of security and increase protection of the data. By considering various machine learning models and using the data of real estate forms in Boston we predict the house prices in entire Boston. This project is all about predicting the house prices by considering the datasets of Boston real estate by using different class labels. As we need the data to predict house price, the supervised data is produced which plays key role in predicting the house price and help in dealing with the real estate entities. As we are using machine learning it is easier to achieve the target like higher intelligent predictions which are a benefit factor for futuristic projects and intelligent systems which are linked to robotics as well. Now a days, smartphones are super-advanced and handy devices which could be used for almost every daily tasks instead of laptops. Smartphones applications are widely available, popular and are easily adopted. And so, we developed an Android app which displays the real-time COVID19 data across the globe, through which every user will know about the situation going around the world regarding the COVID19 and thereby they will be able to stay updated and safe.
Main methodology of machine learning is constructing the models using past data as a source to predict the new data. As population is increasing rapidly the market demand is also increasing at the same pace. Most of the public are vacating the rural areas because of scarcity of jobs and increment of unemployment. This ultimately results in increment of houses in cities. If they don’t have enough idea about prices then it results in loss of money.
II. METHODOLOGY
In this project, we have used many algorithms of machine learning such as Linear Regression, Random Forest Regressor, CatBoost Regressor, SVR, KNN, XGB Regressor, AdaBoost Regressor to predict house prices. 80% of information from the known datasets is employed for training purposes and remaining 20% of the information is utilized for testing purposes. This work involves several techniques such as transformation techniques, reduction techniques and searching for new correlations.
We have lot to research in house price prediction and knowledge of machine learning is required. In general house prices are made considering various variables. They call these factors to be concept, strength and placement. Even we consider physical conditions that includes no. of rooms, dimensions of the property, age of the property, garage and kitchen scaling.
During this project, we have used many machine learning regression algorithms such as Linear regression, Decision Tree, K-Means, and Random Forest. Various factors are there to affect house prices which consists of physical attributes, location, and economic factors. We take RMSE under consideration because the performance matrix for various datasets and these algorithms are applied and determine the most accurate model which predicts better results.
III. PROPOSED SYSTEM
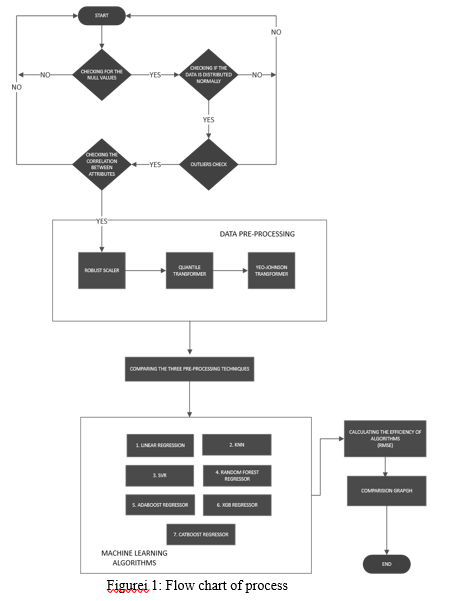
In the proposed system data is passed through three data pre-processing stages and later working on machine learning algorithms. Cleaning the dataset is the first step where data it removes all outliers in the system and other false data nodes like checking for the null values, checking if the data-id distributed normally, checking the correlation between attributes and the three data pre-processing methods are Robust Scaler, Quantile Transformer, Yeo-Johnson Transformer, and the next steps involve working of models like Linear Regression, KNN, SVR, Random Forest Regressor, AdaBoost Regressor, XGB Regressor, Cat-Boost Regressor where we perform different operations to achieve accuracy. Then the Root Mean Square Error (RMSE) is calculated while working with each of the machine learning models explored and this RMSE is used as a performance evaluation metric.
IV. IMPLEMENTATION
A. Exploring the Data
All the tuples of the dataset defines of the Boston suburb or city. That data was collected from Boston SMSA ( Standard Metropolitan Statistical Area) at the time of 1970s.
Those attributes are described below which were taken from UCI MLR1.CRIM: per capita crime rate by town
- CRIM: Town’s per capita crime rate.
- ZN: Residential land proportion zoned for lots more than 25 thousand square ft.
- INDUS: Non-retail business acres proportion per capita.
- CHAS: Known as Charle’s river dummy variable. It’s value is 1 if tract bounds the river or 0 otherwise)
- NOX: Concentration of toxic gas, Nitrogen monoxide in that area. Measured in parts per 10 million.
- RM: Dwelling comprising the number of rooms on average.
- AGE: Owner-occupied units proportion which were built before 1940.
- DIS: How close it is to 5 nearest employment center.
- RAD: Accessibility index of radial highways.
- TAX: Property-tax total value rate per 10 thousand dollars.
- PTRATIO: Ratio of teachers to people over the town.
- B: Calculated using formula : 1000(Bk−0.63)2 where Bk is Blacks proportion by town.
- LSTAT: Percentage population of lower status people.
- PRICE: Median price of owner-occupied homes in thousand dollars
We can clearly notice that our attributes are having a fusion of many units.
B. Data Pre-Processing
- Checking for null-values: Missing item or null value is defined as the data that is not stored or is absent for a variables within the dataset provided. There are multiple reasons why certain values are missing from the info. Some of the explanations are past data might get corrupted because of improper maintenance, observations aren't recorded in sure enough fields because of some reasons, there can be a failure in recording the values because of human error and the user has not provided the values intentionally.
- Checking if the data is distributed normally or not: Normal Distribution is one of the crucial concepts in statistics and therefore also considered the backbone of Machine Learning data distribution. A knowledgeable Mathematician has to fathom distribute after they work with Linear Models and has to perform well if the information is normally distributed and if the central limit theorem and exploratory data analysis are considered. The Distribution if it is normal does carry its assumptions and maybe completely could be specified by 2 parameters those are the mean and therefore the variance. If the mean value and variance value are known, we will be able to access every datum on the data curve.
- Checking for Outliers: In the machine learning perspective, an outlier is defined as a point that is farther from all other points. The above statement tells to us that if an outlier is there like some odd one out or the one that is farther from the gang. Few statistics define the outliers as having a distinct underlying distinct conduct than the remaining portion of the data. Alternatively, The outlier can be some information that is distant from all the other points. There is no need to confuse this statement there upon an imbalanced dataset, though there may be few similarities within the definitions. We will not dig into much details
- Checking the correlation between attributes: Data Correlation: this could be thanks to understanding the link or dependency between many variables or attributes of the dataset. With the help of correlation, we can obtain some insights.1 or more attributes depend upon another attribute or a reason behind an additional attribute. 1 or more attributes how they are related to the remaining attributes.
a. Positive Correlation: That means if a feature X decreases, then the feature Y also decreases or if feature Y increases, then feature X also increases. Both features move in correspondence and there is a linear relationship between them.
b. Negative Correlation: implies that if feature X decreases, then feature Y must increase and the vice versa.
c. No Correlation: There is no link between those 2 attributes.
C. Pre-processing Methods
- Robust Scaler: Features are scaled using mathematical statistics that the outliers feel robust. The robust scaler technique removes the median value and shifts the data consistent to the quantile range. The IQR stands for inter quantile range is the range between the 1st quartile and the third quartile. Scaling and centering will happen independent of each other on each feature by computing the stats on the sample data within the training set. The median and inter quartile range are stored to be utilized in future data using this transformation technique.
- Quantile Transformer: Transform features using quantiles information. Quantile transformation technique transforms the attributes to act in according to a similar distribution. So, for a given feature, this transformer tends to show up the foremost and recent values. It also minimises the effect of the outliers: and so can be therefore a steady preprocessing method. Independently, for each feature the transformation is to be applied. At first, some approximated value of the function distributed cumulatively of a feature is selected to map the first values to some similar distribution. Then the values obtained are mapped to the output required distribution by the associated quantile method.
- Yeo - Johnson Transformer: Apply an influence transform feature wise makes the information more like Gaussian. The group of parametric, monotonic transformations only include the power transformer techniques which are put together to form data more like Gaussian. This is more kind of useful while modeling the issues and problems associated with hetero-sceda elasticity or other situations where desired output should be distributed normally. At present, The power transformation techniques assists the box cox transformation and hence the Yeo-Johnson transformer. The parameter which is optimal for making the variance steady and skewness has to be reduced is estimated through likelihood in most of the cases.
D. Comparison of 3 transformation techniques
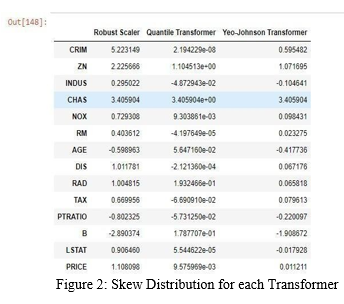
After comparison of 3 transformation techniques skew distribution data. We see that the Yeo-Johnson transformer yields skew distribution is close to 0. With this we can confirm that the Yeo-Johnson transformer optimal solution amongst the three transformation techniques and the data transformed through this transformer drives to better predictions.
E. Exploring various ML models:
- Linear Regression :Supervised type of machine learning is supported by Linear Regression algorithm . It accomplishes the regression tasks. The regression technique models the target/output prediction to the independent variables. It is the mostly used algorithm for locating the connection between various attributes and the forecasting. Many regression models are different in supporting the sort of relationship between dependent variables and the independent variable they want, and therefore a good amount of independent variables are being used. This regression algorithm accomplishes the task of predicting a variable value (v2) supported the given variables (v*). So, this model finds out the linear relationship between v* (input) and v(output). Hence, it is also known as statistical regression.
- K-Nearest Neighbors (KNN): The K-Nearest Neighbors algorithm is one in every of the many popular Machine Learning algorithms that support Supervised Learning category. This algorithm presumes the homogeneity between the newest data and available data and put the newest data into the category that is most alike one of all the available categories. This algorithm stores all the pre-fetched data and segregates the fresh information supported by the homogeneity. This helps when the fresh data appears then it is often easily label into the compatible class.
- Support Vector Regressor (SVR) : The Support vector regression is one of the supervised learning algorithms that has accustomed prediction of discrete values. This model use the identical principle because the SVM principle. The essential idea behind this SVR is to seek out the most effective fitted line. In SVR, the most effective fit line is that the hyper plane that has the utmost number of points. The regression models of machine learning tries to decrease the error between predicted and important value, this model tries to suit the simplest line near to the threshold value. Edge value is that the distance from the hyper plane to the boundary line. The fitting time complexity of this model is quite quadratic to the quantity of samples taken which makes it hard to scale to available datasets with over pair of 10 thousand samples.
- Random Forest Regressor (RFR) : Decision Trees can be utilized for both the regression and classification tasks. They visually flow like trees, hence the name, and within the regression case, they begin with the foundation of the tree and follow splits supported variable outcomes until a leaf node is reached and also the results are given. The forest can be an estimator that matches a variety of labeling decision trees on many sub-samples of given data and makes the use by averaging to boost the prediction accuracy and controls the overfitting. Maximum samples parameter controls the size of every sub-sample if the bootstrap is True (by default), otherwise the entire data is employed to create every tree
- AdaBoost Regressor (ABR) : The AdaBoost regression algorithm may be an estimator which begins by proper fitting of a regressor based on the initial data and so fits additional copies of the regressor on the identical dataset but the weight of every instance is then adjusted in step with the error of this prediction. As such consequence, subsequent regression models focus more with the tougher cases. The decision tree is then boosted* using the ada boost algorithm. This algorithm on the 1D sinusoidal dataset with some quantity of the gaussian noise. 299 boosts on 300 decision trees are analyzed.
- XGBoost Regressor (XGBR) : The XG of the XGBoost stands for Extreme Gradient which is a free and open source library that produces an effective implementation of the gradient boosting algorithm. Soon after the development and its first release, This algorithm became the go to technique and infrequently the important aspect to win the solutions for a variety of tasks in machine learning contests. Prediction based regression modeling tasks involve the prediction a numeric value like an amount or a distance. This algorithm is often used very directly for prediction-based regression modelling. The gradient boosting points to a class of ML algorithms related to ensemble learning which can be used for either of classification or regression tasks.
- CatBoost Regressor (CBR) : The Cat Boost is built upon the speculation of decision trees algorithm and the gradient boosting algorithm. The idea of boosting is to add many weak built models and so by the greedy search technique, we can build a robust competitive model for prediction. As the gradient boosting fits the choice trees one after the other, the learned trees will learn from its mistakes and so, that’s how it reduce the errors. So, this way of adding a new functionality to the existing methodology is sustainable until the chosen loss method isn't any longer reduced.
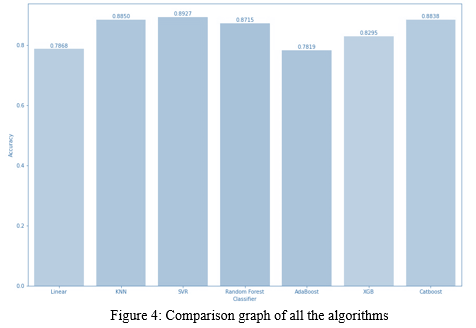
V. RESULTS
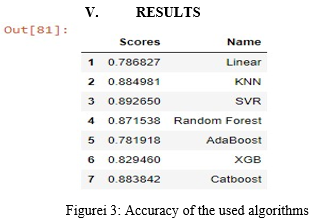
We observe that Support vector Regression technique gives us highest accuracy of more than 89% whereas CatBoost algorithm yields accuracy more than 88% which gives almost same accuracy as Support Vector Regression.
VI. ACKNOWLEDGEMENTS
We convey our sincere thanks to all the faculties of ECM department, Sreenidhi Institute of Science and Technology, for their continuous help, co-operation, and support to complete this project.
We are very thankful to Dr. D. Mohan, Head of ECM Department, Sreenidhi Institute of Science and Technology, Ghatkesar for providing an initiative to this project and giving valuable timely suggestions over our project and for their kind cooperation in the completion of the project.
We convey our sincere thanks to Dr.T.Ch. Siva Reddy, Principal, and Chakkalakal Tommy, Executive Director, Sreenidhi Institute of Science and Technology, Ghatkesar for providing resources to complete this project. Finally, we extend our sense of gratitude to almighty, our parents, all our friends, teaching and non- teaching staff, who directly or indirectly helped us in this endeavor
Conclusion
We convey our sincere thanks to all the faculties of ECM department, Sreenidhi Institute of Science and Technology, for their continuous help, co-operation, and support to complete this project. We are very thankful to Dr. D. Mohan, Head of ECM Department, Sreenidhi Institute of Science and Technology, Ghatkesar for providing an initiative to this project and giving valuable timely suggestions over our project and for their kind cooperation in the completion of the project. We convey our sincere thanks to Dr.T.Ch. Siva Reddy, Principal, and Chakkalakal Tommy, Executive Director, Sreenidhi Institute of Science and Technology, Ghatkesar for providing resources to complete this project. Finally, we extend our sense of gratitude to almighty, our parents, all our friends, teaching and non- teaching staff, who directly or indirectly helped us in this endeavor
References
[1] Garriga C., Hedlund A., Tang Y., Wang P, “Regional Science and Urban Economics Rural-urban migration and house prices in China”, Regional Science and Urban Economics (2020), p. 103613, March 2020. [2] Wang X., Li K., Wu J. “House price index based on online listing information?: The case of China” Journal of Housing Economics, 50 (2020), p. 101715, May 2018. [3] G.Naga Satish, Ch.V.Raghavendran, M.D.Sugnana Rao, Ch.Srinivasulu “House Price Prediction Using Machine Learning”. IJITEE, 2019. [4] Bharatiya, Dinesh, et al. “Stock market prediction using linear regression.” Electronics, Communication, and Aerospace Technology (ICECA), 2017 International conference of. Vol. 2. IEEE, 2017. [5] Anand G. Rawool1 , Dattatray V. Rogye , Sainath G. Rane , Dr. Vinayk A. Bharadi, “House price predition using Machine Learning, IRE Journals, May 2021. [6] E.Laxmi Lydia, Gogineni Hima Bindu, Aswadhati Sirisham, Pasam Prudhvi Kiran, “Electronic Governance of Housing Price using Boston Dataset Implementing through Deep Learning Mechanism”, IJRTE, Volume-7 Issue-682, April-2019. [7] Li Yu, Chenlu Jiao, Hongrun Xin, Yan Wang, Kaiyang Wang, “ Prediction on Housing Price Based on Deep Learning”, World Academy of Science, Engineering and Technology International Journal of Computer and Information Engineering Vol.12, No.:2, 2018.
Copyright
Copyright © 2022 Sumanth Mysore, Abhinay Muthineni, Vaishnavi Nandikandi, Sudersan Behera. This is an open access article distributed under the Creative Commons Attribution License, which permits unrestricted use, distribution, and reproduction in any medium, provided the original work is properly cited.

Download Paper
Paper Id : IJRASET44033
Publish Date : 2022-06-09
ISSN : 2321-9653
Publisher Name : IJRASET
DOI Link : Click Here
 Submit Paper Online