

Ijraset Journal For Research in Applied Science and Engineering Technology
Quality Assessment of Different Types of Marketised Milk and Raw Milk
Authors: Geetha G, Greeshma K
DOI Link: https://doi.org/10.22214/ijraset.2024.65061
Certificate: View Certificate
Abstract
This study aimed to assess the quality analysis of milk, Sensory evaluation, chemical Evaluation, chemical test, nutritional evaluation, microbiological evaluation, MBRT and antibiotics methods for marketised milk and raw milk samples were assessed. Data were obtained for fat, solid not fat, protein, Acidity content of milk. In addition, possible microbial contamination was also determined. A total 4 marketised milk and 2 Raw milk samples. Some milk samples have an abnormal colour (White). Abnormal smell (good) and total solid below normal (11.76) Acidity normal value (1.135). All the milk samples had mineral contents within the recommended range microbiological results of this study imply heavy contamination of milk. The MBRT is a qualitative test for milk, it is used to check the quality of raw milk and pasteurised milk . The milk containing antibiotic residues is not used for human consumption.
Introduction
I. INTRODUCTION
Milking, being a product of biological origin, is extremely vulnerable to attack by microbes. Microorganisms enter milk from a variety of sources can be beneficial or harmful, for example Lactococcus, Lactobacillus, streptococcus, propionibacterium and fungal population facilitate dairy fermentation, lactobacilli and bifidobacteria promote health while Pseudomonas, Clostridium, Bacillus and other spore forming or thermoduric microorganisms cause spoilage and Listeria monocytogenes, Salmonella, Shiga toxin producing Escherichia Coli, Campylobacter and mycotoxin producing fungi cause disease.it is also a good vehicle for additives and adulterants without any apparent changes in its appearance.
Studies done on selected farms show that raw milk may be contaminated by a wide range of bacteria, including Staphylococcus aureus, Escherichia coli, Bacillus spp, Brucellosis spp, Listeria monocytogenes, Salmonella spp . And Corynebacterium spp. Therefore, this study aimed at assessing the microbial quality of milk collected presence and number of total bacterial count were evaluated on Plate Count Agar (PCA). The plate was incubated at 30°C for 48 hours. Enumeration of total coliform was carried out at 37°C for 24 hours on Violet Red Bile Lactose (VRBL) Agar. Mannitol Salt Agar was carried out at 37°C for 24 hours (MSA). Most dairy plants usually follow chemical quality control with the processing of milk and meeting mandatory requirements for end products.
II. MATERIALS AND METHOD
A. Quality Control
Sampling of milk: Collecting milk samples directly from the cow's teats for culturing. Samples are taken from cows Accurate sampling is the first step for a fair and quality control system. Before taking in the milk sample for biochemical tests we should add liquid milks cans and bulk tanks for adding the milk fat. Then take the samples from packed products for observing the quality plungers and dipper used in sampling of milk from milk cans, sampling of milk are collected from tanks, filling machines and road tanks.
B. Labelling And Records Of The Sample
The sample should be labelled clearly with the name of farmers, code numbers, dates and the place of collection. All these data should be recorded in clear standard sheets. Note down all the observations done from the sample collection onwards. The milk producers should have the records of their milk being tested at any cost of time.
C. Quality Analysis Of Milk
1) Sensory Evaluation
Sensory analysis of fluid milks of varying fat percentages demonstrated that opacity, thickness, mouth coating, viscosity, milk fat flavor, and yellow color increased with fat content
2) Chemical Evaluation
Acidity Test
Bacteria produce lactic acid in normal raw milk. This test is done for knowing the lactic acid content of milk, quality of milk, measurement of alkali and for knowing the buffering capacity of milk. Natural Acidity test is also done through this method. Through this test the storing quality and heat stability of milk can be determined. The Alkaline measurement is done for changing the pH of milk by adding phenolphthalein solution. In this Acidity test the acid can be neutralized by adding 0.1 N NaOH. Thus the amount of Alkaline and percentage of lactic acid measured. The natural Acidity of a milk is 0.16 to 0.18 %. If the percentage is higher than this, it denotes the increased Acidity due to the bacterial action on milk sugar. This can also be done in pasteurized or processed milk to know the condition of milk.
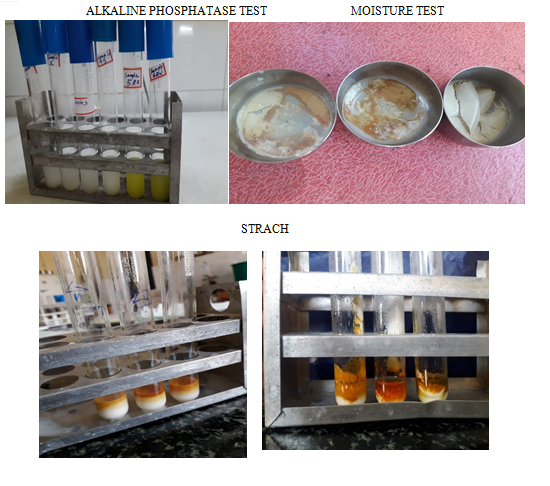
Alkaline Phosphatase Test
This test is used to judge the efficiency of the pasteurization of milk, that is to know whether the heat treatment to milk is properly carried out. The pasteurized milk is subjected to an Alkaline phosphatase test, which is tested for the detection of phosphatase enzymes. Phosphatase enzymes should be inactivated by the pasteurization method. The result should be negative. If the test results for a yellow color, it denotes the presence of phosphatase enzyme. So we should consider the milk as " raw milk “and pasteurized the milk once more.
3) Chemical Test
The principal constituents of milk are water, fat, proteins, lactose (milk sugar) and minerals (salts). Milk also contains trace amounts of other substances such as starch, urea, Alizarin, sodium chloride, glucose, sucrose. The residue left when water and gases are removed is called the dry matter (DM) or total solids content of the milk. Milk is a very complex product. In order to describe the various constituents of milk and how they are affected by the various stages of treatment in the dairy, it is necessary to resort to chemical terminology. This chapter on the chemistry of milk therefore begins with a brief review of some basic chemical concepts.
D. Nutritional Evaluation
1) Gerber Butterfat Test (Fat Test)
The Gerber method is done to estimate the fat % in milk, be it raw milk or processed milk. This test is done for knowing the fat content of the cream that is separated from the milk. So that we can know the exact amount of feed ration for a high yielding dairy cow. And also to fix the price for milk supplied by the farmers.
2) Total Solids
By exposing the sample to a high temperature the complete moisture content in the sample will go out. Through this method the solid content in the sample can be determined.
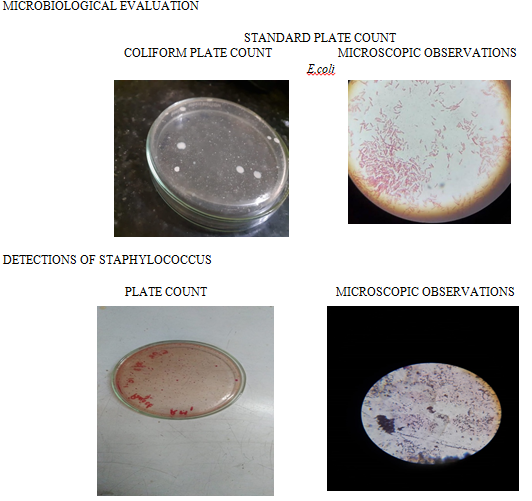
E. Microbiological Evaluations
1) Standard Plate Count ( SPC)
It is important to know the amount of bacteria included in a specimen for consuming foods. To evaluate the products, it is necessary to enumerate the microbial population. The standard plate count is a good method for the enumeration of viable microbes. Through this method we will get a visual indicator for every cell in the specimen. The advantage of this method is it doesn't require previously prepared plates. Each colony represents a colony forming unit (CFU). For optimum accuracy of a count, the preferred range for total CFU/plate is between 30 to 300 colonies/plate.
Materials
- Sterile test tubes containing 9ml phosphate buffer solution.
- Sterile petri plates.
- Plate Count Agar
Standard plate count ( spc)
It is important to know the amount of bacteria included in a specimen for consuming foods. To evaluate the products, it is necessary to enumerate the microbial population. The standard plate count is a good method for the enumeration of viable microbes. Through this method we will get a visual indicator for every cell in the specimen. The advantage of this method is it doesn't require previously prepared plates. Each colony represents a colony forming unit (CFU). For optimum accuracy of a count, the preferred range for total CFU/plate is between 30 to 300 colonies/plate.
Materials
- Sterile test tubes containing 9ml phosphate buffer solution.
- Sterile petri plates.
- Plate Count Agar
2) Coliform Plate Count (CPC)
The number of colonies present in the sample is called the coliform count. This will grow and form distinctive countable colonies on Violet Red Bile Agar (VRBA) after being held at 32°C (90°F) for 24 hours. Generally, coliforms are destroyed during the pasteurization process. If the test results for the presence of coliform means that contamination occurs after pasteurization. This coliform presence indicates that it is unhygienic during production. It is hazardous to health.
Materials
- Sterilized test tubes containing 9 ml phosphate buffer solution.
- Sterilized petri plates.
- Violet Red Bile Agar (VRBA)
3) Detection Of Staphylococcus
Mannitol Salt Agar is a selective or differential medium for the isolation and identification of Staphylococcus aureus. It encourages the growth of a group of certain bacteria while inhibiting the growth of others.
Mannitol Salt Agar contains peptides and beef extract, which supplies nitrogen, vitamins, minerals and amino acids essential for growth. The 7.5 concentration of sodium chloride results in the partial or complete inhibition of bacterial inhibition 9ther than Staphylococci. sodium chloride also supplies essential electrolytes for transport and osmotic balance. Mannitol is the fermentable carbohydrate, fermentation of which leads to acid production, detected by phenol Red indicator, aids in the differentiation of staphylococcal species.
Materials
- MSA media
- Sterilized test tubes containing 9 ml phosphate buffer solution
- Sterilized petri plates
- Micropipette
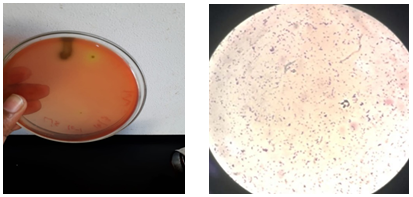
Detection Of Listeria
Listeria is an important food borne pathogen and is widely tested for in food. They are gram positive, opportunistic pathogens. Most human Listeriosis cases appear to be linked to consumption of ready-to-eat (RTE) food products that have undergone listericidal heat treatments but have been contaminated post processing from environmental sources.
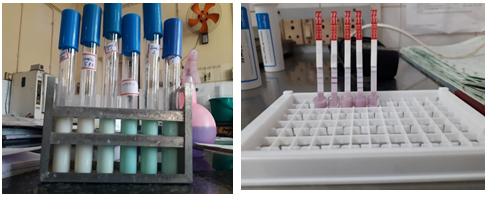
4) Methylene Blue Reduction Test (MBRT)
Principle
This test is based on the principles of Methylene blue, which is boiled. Oxidized state.is reduced to a colorless compound as a result of the metabolic activities of bacteria in milk. When a solution of Methylene blue is added, the organism presents in milk consume the dissolved oxygen and lower the O-R potential to a level when blue is decolorized (reduced). The time taken for the reduction of the dye (MBRT) is influenced by the number of bacteria in the milk. The greater the number of organisms present in milk and greater their activity the more rapidly is the dye reduced. The MBR Test is therefore used for judging the hygienic quality of milk for assessing the probable keeping quality of milk for detecting post pasteurization contamination.
5) Antibiotic Method
This test is used to check whether the milk is Antibiotic free or not. This is a standard diffusion test for the detection of antibiotic residues in milk.
III. RESULT AND OBSERVATIONS
A. Sensory Evaluation
|
Sl. No |
Taste |
Smell |
Colour |
Texture |
Body |
|
Sample 1 |
Awful (sour) |
Great (pleasant) |
Good (White) |
Great (Too soft ) |
Good (Thick) |
|
Sample 2 |
Good (Sour) |
Bad (Fair) |
Good (White) |
Too soft |
Good (fairly smooth) |
|
Sample 3 |
Great ( sweet) |
Good (Pleasant) |
Okay (Slightly yellowish) |
Good |
Good (Smoot thick) |
|
Sample 4 |
Great (Sweet and sour) |
Good (Pleasant) |
Good (White) |
Good |
Good (Fairly smooth) |
|
Sample 5 |
Great (Sweet and sour) |
Awful |
Good ( slightly yellowish) |
Okay |
Bad (Fairly smooth) |
|
Sample 6 |
Great (Sweet and sour) |
Great
|
Good (Creamy white) |
Good
|
Good ( smooth thick) |
Table 1: Sensory evaluation
B. Acidity Test
1) Sample 1
|
Day 1 |
O.135 |
|
Day 2 |
0.136 |
|
Day 3 |
0.126 |
Table 2: Sample 1 Acidity test
2) Sample 2
|
Day 1 |
1.41 |
|
Day 2 |
1.51 |
|
Day 3 |
1.51 |
Table 3: Sample 2 Acidity test
3) Sample 3
|
Day 1 |
1.31 |
|
Day 2 |
1.51 |
|
Day 3 |
0.189 |
Table 4: Sample 3 Acidity test
4) Sample 4
|
Day 1 |
1.31 |
|
Day 2 |
1.61 |
|
Day 3 |
2.01 |
Table 5: Sample 4 Acidity test
5) Sample 5
|
Day 1 |
1.71 |
|
Day 2 |
1.91 |
|
Day 3 |
1.81 |
Table 6: Sample 5 Acidity test
6) Sample 6
|
Day 1 |
1.01 |
|
Day 2 |
1.31 |
|
Day 3 |
1.21 |
Table 7: Sample 6 Acidity test
C. Alkaline Phosphatase Test
|
Samples |
½ hour time |
|
Sample 1 |
No colour change |
|
Sample 2 |
No colour change |
|
Sample 3 |
No colour change |
|
Sample 4 |
No colour change |
|
Sample 5 |
Yellow Colour change |
|
Sample 6 |
Yellow Colour change |
Table 8: Alkaline phosphatase test
D. Chemical evaluation
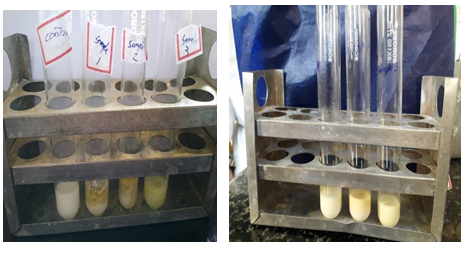
1) Starch
|
Sample 1 |
Absence of starch |
|
Sample 2 |
Absence of starch |
|
Sample 3 |
Absence of starch |
|
Sample 4 |
Absence of starch |
|
Sample.5 |
Absence of starch |
|
Sample 6 |
Absence of starch |
Table 9: Chemical evaluation of starch Alkaline phosphatase test
2) Urea
|
Sample 1 |
Absence of urea |
|
Sample 2 |
Absence of urea |
|
Sample 3 |
Absence of urea |
|
Sample 4 |
Absence of urea |
|
Sample.5 |
Absence of urea |
|
Sample 6 |
Absence of urea |
Table 10: Chemical evaluation of urea
3) Alizarine
|
Sample 1 |
Absence of alizarin |
|
Sample 2 |
Absence of alizarin |
|
Sample 3 |
Absence of alizarin |
|
Sample 4 |
Absence of alizarin |
|
Sample 5 |
Absence of alizarin |
|
Sample 6 |
Absence of alizarin |
Table 11: Chemical evaluation of Alizarine
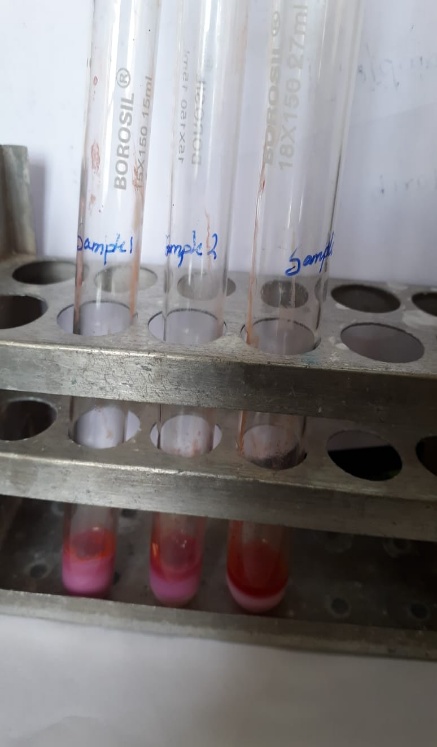
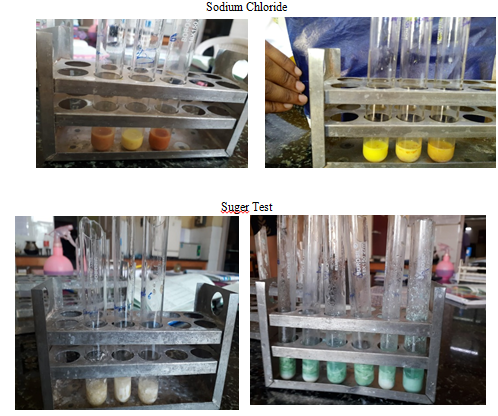
4) Sodium chloride
|
Sample 1 |
Absence of sodium chloride |
|
Sample 2 |
Presence of sodium chloride |
|
Sample 3 |
Absence of sodium chloride |
|
Sample 4 |
Presence of sodium chloride |
|
Sample 5 |
Presence of sodium chloride |
|
Sample 6 |
Presence of sodium chloride |
Table 12: Chemical evaluation of sodium chloride
5) Sugar
|
Sample 1 |
Absence of sugar |
|
Sample 2 |
Absence of sugar |
|
Sample 3 |
Absence of sugar |
|
Sample 4 |
Absence of sugar |
|
Sample 5 |
Absence of sugar |
|
Sample 6 |
Absence of sugar |
Table 13: Chemical evaluation of sugar
6) Glucose
|
Sample 1 |
Absence of glucose |
|
Sample 2 |
Absence of glucose |
|
Sample 3 |
Absence of glucose |
|
Sample 4 |
Absence of glucose |
|
Sample 5 |
Absence of glucose |
|
Sample 6 |
Absence of glucose |
Table 14: Chemical evaluation of glucose
E. Nutritional Evaluation Result
1) Gerber Butterfat Test
|
Samples |
Fat |
|
Sample 1 |
3.0 |
|
Sample 2 |
3.5 |
|
Sample 3 |
3.5 |
|
Sample 4 |
4.5 |
|
Sample 5 |
4.5 |
|
Sample 6 |
4.0 |
Table 15: Nutritional evaluation of Gerber butterfat test
2) Coliform plate count (CPC)
|
Samples |
Coliform count |
|
Sample 1 |
Nil |
|
Sample 2 |
Nil |
|
Sample 3 |
300×10^-1 cfu/ml |
|
Sample 4 |
Nil |
|
Sample 5 |
540×10^-1 cfu/ml |
|
Sample 6 |
750×10^-1 cfu/ml |
Table 16: Coliform plate count
3) Biochemical Test
|
Biochemical tests |
Result |
|
Catalase |
Positive |
|
Methyl Red |
Positive |
|
Voges proskauer |
Negative |
|
Indole |
Positive |
|
H2S |
Negative |
Table 17: Biochemical test
4) Detection Of Staphylococcus
|
Samples |
Count |
|
Sample 1 |
Nil |
|
Sample 2 |
Nil |
|
Sample 375 |
Nil |
|
Sample 4 |
Nil |
|
Sample 5 |
Nil |
|
Sample 5 |
800×10^-1cfu/ml |
Table 18: Detection of Staphylococcus
5) Biochemical Test
|
Biochemical tests |
Result |
|
Catalase |
Positive |
|
Citrate |
Positive |
|
Indole |
Negative |
|
MR |
Positive |
|
VP |
Positive |
|
H2S |
Negative |
Table 19: Biochemical Test
6) Detection Of Listeria
|
Samples |
Count |
|
Sample 1 |
3×10^-1 cfu/ml |
|
Sample 2 |
Nil |
|
Sample 3 |
Nil |
|
Sample 4 |
250×10^-1 cfu/ml |
|
Sample 5 |
750×10^-1 cfu/ml |
|
Sample 6 |
1020×10^-1 cfu/ml |
Table 20: Detection of Listeria
7) Biochemical Test
|
Listeria biochemical tests |
Result |
|
Positive |
|
Negative |
|
Positive |
|
Positive |
|
Negative |
Table 21: Biochemical test
8) Methylene Blue Reduction Test
|
Samples |
Time
|
|||
|
|
9.45 hour |
10.15 hour |
10.45 hour |
11.15 hour |
|
Sample 1 |
No colour change |
No colour change |
No colour change |
No colour change |
|
Sample 2 |
No colour change |
No colour change |
No colour change |
No colour change |
|
Sample 3 |
No colour change |
No colour change |
No colour change |
No colour change |
|
Sample 4 |
No colour change |
No colour change |
No colour change |
Light colour change |
|
Sample 5 |
No colour change |
No colour change |
Pure white colour |
Pure white colour |
|
Sample 6 |
No colour change |
No colour change |
Light colour change |
Pure white colour |
Table 22: Methylene blue reduction test
IV. ANTIBIOTIC METHOD
|
No |
Sample ID |
Testing time/date |
Result |
|||
|
|
Parameter |
Result |
Peak |
Ratio |
||
|
1 |
Sample 1 |
13:43:47/03/20/2022 |
C
S
B
T
|
Valid
Pos
Neg
Neg |
257.0
174.6
429.6
633.4 |
0.679
1.672
2.465 |
|
2 |
Sample 2 |
13:42:16/03/20/2022 |
C
S
B
T |
Valid
Pos
Pos
Neg |
289.7
0.0
165.5
285.3 |
0.000
0.571
0.985 |
|
3 |
Sample 3 |
13:39:25/ 03/20/2022
|
C
S
B
T |
Valid
Pos
Neg
Neg |
247.4
6.5
287.5
482.0 |
0.026
1.162
1.948
|
|
4 |
Sample 4 |
13:40:56/03/20/2022 |
C
S
B
T |
Valid
Pos
Neg
Neg |
302.3
45.3
800.3
896.8 |
0.150
2.150
2.967
|
|
5 |
Sample 5 |
13:42:57/03/20/2022 |
C
S
B
T
|
Valid
Pos
Pos
Neg |
755.9
46.2
655.0
790.9 |
0.061
0.867
1.046 |
|
6 |
Sample 6 |
13:43:58/03/20/2022t |
C
S
B
T
|
Valid
Pos
Pos
Neg |
251.6
32.6
687.0
871.0 |
0.000
0.871
1.062 |
Table 23: Antibiotic method
UREA
ALIZARIN
DETECTION OF LISTERIA
PLATE MICROSCOPIC OBSERVATIONS
METHYLENE BLUE REDUCTION TEST ANTIBIOTICS METHOD
Conclusion
In conclusion, the present study highlighted the poor microbiological quality of raw milk collected from six samples. This was evident from the high values of aerobic mesophilic bacteria, total coliform in the samples which are not in conformity with official standards and therefore indicated serious pathogenic germ that endanger keeping quality and safety of raw milk. Furthermore, the result strongly suggests the need to improve hygienic conditions and adequate sanitary measures that should be taken from stage of production to consumption. The poor microbiological quality observed in the present study requires further investigation of the status of animal health, especially MASTITIS and the significance of the effect of containers to ascertain their contributions on microbial quality. Furthermore, and from a microbial safety point of consideration, it is recommended not to consume raw milk and pasteurization of the milk is strongly advised. More food safety education should be given to producers, handlers and consumers. The limits of this study reside to the size of samples and also the classic techniques of detection of microorganisms. This study revealed that out of six Sample, Sample 1 and sample 2 had better quality in terms of Sensory, chemical and microbiological Evaluation. No coliforms found in the four Samples indicates that all products are produced under sanitary conditions hence safe for human consumption. Some listeria found in each sample which represents Sample were contaminated so some necessary action needs to be taken in every step of processing and transportation.
References
[1] Elvira L, Sampedra L, matesanz J,Gomez-Ullate Y, Resa P, Iglesias JR, et al. Non-invasive and destructive ultrasonic technique for the detection of microbial contamination in packed UHT milk. Food research International. 2005; 38: 631-8. [2] Palmquist, DL, Beaulieu AD, Barbano DM. Feed and animal factors influencing milk fat composition. Journal of Dairy Science. 1993;76:1753-71. [3] Thomas EL .Trends in milk flavors. Journal of Dairy Science. 1981; 64:1023- [4] Allen JC, Joseph G. Deterioration of pasteurized milk on storage. Journal of Dairy Research. 1985; 52: 469-87. [5] ISO 6611E (2004) Milk and milk products-Enumeration of colony forming units of yeasts and/or moulds-Colony-count technique at 25°C, ISO, FIL/IDF, International Organization for Standardization, Geneva, Switzerland, International Dairy Federation, Brussels, Belgium. [6] Codex Alimentarius (2004) Code of hygienic practice for milk and milk products. CAC/RCP 57-2004. [7] ISO 15214 (1998) Microbiology of food horizontal Method for the enumeration of the mesophilic lactic acid bacteria Technical by counting of the colony at 30°C. [8] ISO 7937-V08-019 (2005) Microbiology of food-Horizontal method for the enumeration of Clostridium perfringens-Colony-count technique. [9] Banik SK, Das KK, Uddin MA. Microbiological quality analysis of raw, pasteurized, UHT milk samples collected from different locations in Bangladesh. Stamford J Microbiol. 2014;4(1):5–8. https://doi.org/10.3329/sjm.v4i1.22753. [Google Scholar] [10] Saha S, Ara A. Chemical and microbiological evaluation of pasteurized milk available in Sylhet city of Bangladesh. The Agriculturists. 2012;10(2):104–8. https://doi.org/10.3329/agric.v10i2.13147. [Google Scholar] [11] Hossain TJ, Alam MK, Sikdar D. Chemical and microbiological quality assessment of raw and processed liquid market milks of Bangladesh. Cont J Food Sci Technol. 2011;5(2):6–17. [Google Scholar] [12] Ranganna S. Hand book of analysis of quality control for fruit and vegetable products. 2nd. Tata McGraw Hill Publications Company Limited; New Delhi, India: 2005. pp. 594–645. [Google Scholar] [13] Das PC, Rana MS, Saifullah M, Islam MN. Development of composite biscuits supplementing with potato or corn flour. Fundam Appl Agric. 2018;3(2):453–9. https://doi.org/10.5455/faa.292438. [Google Scholar] [14] Sarker A, Islam M, Shaheb M. Kinetics of dehydration of potato and development of baked product based on dehydrated potato. J Bangladesh Agric Univ. 2012;10(2):303–12. https://doi.org/10.3329/jbau.v10i2.14923. [Google Scholar]
Copyright
Copyright © 2024 Geetha G, Greeshma K. This is an open access article distributed under the Creative Commons Attribution License, which permits unrestricted use, distribution, and reproduction in any medium, provided the original work is properly cited.

Download Paper
Paper Id : IJRASET65061
Publish Date : 2024-11-07
ISSN : 2321-9653
Publisher Name : IJRASET
DOI Link : Click Here
 Submit Paper Online