

Ijraset Journal For Research in Applied Science and Engineering Technology
Recent Use Pattern of Power Tiller, Tractor and Combine Harvester in Odisha
Authors: Dr. Satyananda Swain, Prof. Pradosh Manoranjan Sahoo, Bibhuti Bhusan Mallick, Nilima Bala, Payaswini Sahu, Subhashree Subham Mallick
DOI Link: https://doi.org/10.22214/ijraset.2023.53286
Certificate: View Certificate
Abstract
The present study was conducted to determine the use pattern of power tiller, tractor and combine harvester .The data was collected with the help of a pre-structured questionnaire and interaction with selected farmers in three districts of Odisha. Namely Cuttack, Sonepur, and Khordha for the study. From each district, were selected three districts, and from each block, two villages were randomly selected. Young operators were relatively less careful primarily due to their age and maturity. On the contrary, it was observed that farmers in the age group of more than 35 years had proper experience and could handle minor troubles in their implements more efficiently. More than 50% of the operators were found in the age group of 35-50 years in all the districts as compared to 35% for age group 25-35 years and 15% for the age group below 25 years. The operators\' educational qualification of 10\" standard and above was found to be between 49-59% for power tillers as compared to 39-51% for tractors and 31-48% for combine harvester. The operators\' educational qualification below 10th standard was found to be 53-65% for power tillers, 49-61% for tractors and 75-78% for combine harvesters. The rate of haring of power tiller amounting Rs.800.00 is noted in the districts with 5% deviation where as that of tractor was Rs 1500.00 with 15% deviation and for combine harvester was Rs 2500.00 with 10-15% deviation.
Introduction
I. INTRODUCTION
Odisha is considered as one of agriculturally dominant states of India. Nearly three-fourths of the state population is dependent on agriculture for survival. A large number of machinery equipments are necessary to be used on the farm in the process of farm mechanization. Farm power is considered to be an important input in agriculture which helps in timely operation of fields by operating different types of farm equipments and stationary machines. Mostly farming is done on small holdings. About three - fourths of farm holding belong to small and marginal farmers, one - fourths to semi, medium and large farm holding farmers. Manual farm workers and draught animals are integral sources of farm power. In almost all operations, the farming system continues to use manual labor, animal power and modern technology based machinery in almost all operations. Agricultural equipment and machinery have the capability of carrying out field operations in less time and having better quality.
II. MATERIALS ANDMETHODS
An inspection inquiry was planned in the villages of three districts of Odisha.Following points are followed:
- To select the farmer who owned tractor/power tiller/combine harvester based on sampling procedures
- Collect information on the tractors etc and implements in regards to their use, operating period, cost of operation, deterioration, and rebuild frequency and charges for the same.
- To make a probability sampling so that the result should be unbiased and appropriate statistic al tools can be applied for analysis.
Table 1 List of villages under study area
|
Sl.No. |
Select Villages choose from the studyArea |
||
|
District |
Block |
Village |
|
|
1 |
Cuttack |
Mahanga |
Adamaheshpur |
|
Adhanga |
|||
|
Salepur |
Alipur |
||
|
Govindpur |
|||
|
Niali |
Nagari |
||
|
Usuma |
|||
|
2 |
Sonepur |
Tarbha |
Menda |
|
Baladi |
|||
|
Biramaharajpur |
Khandahata |
||
|
Nuapali |
|||
|
Binika |
Rengali |
||
|
Pipilipali |
|||
|
3 |
Khordha |
Jatani |
Gramadhiha |
|
Gangapada |
|||
|
Begunia |
Abhilo |
||
|
Beleswar |
|||
|
Balipatana |
Achutpur |
||
|
Adalabad |
III. RESULTS AND DISCUSSION
A. Tractor owner shipversusland Holding
To collect information from farmers the following questionnaire has been used for personal interaction.
Information was based on ownership and use pattern of tractor implements system was analyzed from the data obtained from farmers owing tractor implement system. The land ownership patterns for the selected farmers of three selected districts namely Sonepur, Khordha, and Cuttack.
Table-3.1(OwnershipVS Land holding)
|
Category |
Landholding(In-ha) |
Percentageoftractor |
||
|
Cuttack |
Sonepur |
Khordha |
||
|
Marginal |
<2 |
2 |
3 |
2 |
|
Small |
2-4 |
12 |
7 |
10 |
|
Semi medium |
4-6 |
22 |
24 |
23 |
|
Medium |
6-12 |
24 |
27 |
21 |
|
Large |
>12 |
47 |
48 |
49 |
Inference to this analysis 40-50 percent of medium land holding(4-10ha)farmer-owned tractors.
B. Distribution of Operator's Age in the Study Area
The age-wise distribution of tractor operators in the three districts Cuttack, Sonepur, and Khordha
Table-3.2(Age-wise distribution of power tiller operators)
|
Age |
Percentage of the operator(%) |
||
|
Cuttack |
Sonepur |
Khordha |
|
|
<25 |
15.12 |
13.69 |
17.45 |
|
25-35 |
37.33 |
35.34 |
36.11 |
|
35-50 |
52.78 |
54.89 |
49.47 |
According to the questions, farmers reported young operators are relatively less careful due to their growing age . On the flip side, it was visible that farmers in the age group of greater than 35 years have proper experience in handling and can handle minor troubles in their tractors with more efficiency. It has been noticed that farmers give tractor operation in hands of young boys without considering the consequences of mishandling. These type of young boys use tractors sometimes in a fashion similar to cycle and scooter for showoff which may lead to mismanagement of tractor and tractor mishandling.
C. Education level of Operators/Farmers
Educational level-wise distribution of tractor operators/farmers in the three districts - Cuttack, Sonepur, and Khordha. The level of education of tractor operators is given in the (Table 4). In all the three districts, more than 38% of tractor operators are of 10th level. It is due to the age factor that many of the tractor operators are in the youth category. Similar results were found by Kumari and Kumari (2014) in Uttar Pradesh state of India where more than 60% of the tractor operators were educated up to high school or less.
Table-3.3(Educational level of operators)
|
Educationlevel |
Percentage of the tractor operator |
||
|
Cuttack |
Sonepur |
Khordha |
|
|
>10 |
38.89 |
48.33 |
51.22 |
|
<10 |
61.11 |
51.67 |
48.32 |
D. Distribution Patterns of Tractor age in the Study Area
Tractor age-wise distribution of tractors in the three districts-Cuttack, Sonepur, and Khordha.
Table-3.4(Distribution patterns of tractor age)
|
Year |
Percentage of tractors year wise |
||
|
Sonepur |
Khordha |
Cuttack |
|
|
0-5 |
44.67 |
46.67 |
41.67 |
|
5-10 |
43.23 |
42.33 |
47.77 |
|
11-15 |
12.33 |
11.53 |
10.56 |
Aswesee in(Table3.4)when the tractor age increases the use of that tractor decreases. These things happen because when the tractor age increase sit requiresmoremaintenanceascomparedtotheprimarystage,souserstrytobuyanewone.
E. Customer Hiring Rate of Tractors in Different Operations
The customer hiring rate of tractors, power tiller and combine harvester in different operations in the three districts Cuttack , Sonepur, and Khordha.
Table-3.5(Customer hiring ate of the tractor)
|
Operation |
Rates(Rs./h) |
||
|
Sonepur |
Khordha |
Cuttack |
|
|
Power tiller |
850 |
860 |
800 |
|
Tractor |
1300 |
1350 |
1350 |
|
Combine harvester |
2000 |
2000 |
2300 |
|
Diesel Consume -2to3.5L/hr- |
600 |
|
Operator Cost- |
200 |
|
Maintenance Cost- |
200 |
|
Operation cost per hour- |
1000 |
|
Profit(Varies from area to area)- |
400 |
|
Total- |
1400 |
The customer hiring rate difference is shown in three district is due to the availability of the implements, if in one area more equipment’s are there then the customer hiring rate of that area is less. But if in one area less equipment is there then the customer hiring rate is more.
F. Tractor fuel Consumption in Different Operations
The fuel consumption rate of the tractor in different operations in the three districts-Cuttack, Sonepur, and Khordha.
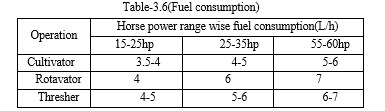
Here we see in tractor when the power is increases the fuel consumption is also increases and when the power is decreases the fuel consumption is also decreases.
G. Implements used in the Study Area
The availability of tractor drawn implements in the study areas is given in (Table-8). Tractor owners in the selected districts were having a good number of farm implements for tillage. In the three districts, all the tractor owners owned cultivators and trolleys. About30.56%,19.44%and38.89% farmers owned a leveler in Cuttack, Sonepur, and Khordha districts respectively.
Table-3.7(UseofImplements)
|
Implement |
Cuttack |
Sonepur |
Khordha |
|||
|
No |
% |
NO |
% |
NO |
% |
|
|
Cultivator |
40 |
100 |
38 |
100 |
44 |
100 |
|
Leveler |
9 |
64.33 |
11 |
70.23 |
14 |
73.23 |
|
Seed-fertilizerdrill |
40 |
100 |
39 |
100 |
43 |
100 |
|
Trailer/Trolley |
43 |
100 |
42 |
100 |
46 |
100 |
|
Tractor |
63 |
100 |
58 |
100 |
68 |
100 |
H. Use of Tractor in Agricultural and nonagricultural Study Area
Use pattern of tractors for agricultural and non-agricultural job is presented in (Table 9). Cuttack, Sonepur, and Khordha districts recorded31.97%,37.46% and 31.29% for agricultural use, respectively and 68.03%,62.54%and68.77%fornon-agricultural use. The use of tractors for non-agricultural activities was mainly limited to transportation of construction material fromone location to another. The results were synonymous to those obtained by a study in Himachal Pradesh. The tractors were used more for non-agricultural purposes (62%ofannualworkinghours)as compared to agricultural operations.
Table-3.8(Agricultural and non-agricultural use of tractor)
|
Operation |
Annual use in hours (%) |
||
|
Cuttack |
Sonepur |
Khordha |
|
|
Agriculture |
33.97 |
3746 |
38.23 |
|
Non-agriculture |
66.03 |
62.54 |
66.77 |
I. Women Worker in Different Agriculture field Operation
Table-3.9(Women workers in different operations)
|
Different field operation |
Percentage of women(%) |
||
|
Cuttack |
Sonepur |
Khordha |
|
|
Transplanting |
60 |
56 |
59 |
|
Weeding |
99 |
98 |
99 |
|
Cutting |
39 |
36 |
38 |
|
Winnowing |
20 |
23 |
21 |
80% of all economically active women in India are employed in agricultural sector. They contribute about one third of the agricultural labour force and nearly 48% of the self-employed farmers. In India, nearly 85% of rural women are engaged in agricultural activities but they own only about 13% of land.
The socio-economic profile of the farmers revealed that the average age of the head of the farm family ranges from 35 to 52 years. From the data of the sample farmers, nearly 55 % have middle school level education, 21 % in high school education, 12 % in higher secondary/college education and the remaining farmers are found to be illiterate.
The majority i.e. 46% of medium farmers (4-5 ha), 23.34 % of semi medium farmers (2-4 ha), and 21 % of small size farmers (1-2 ha) followed by 1.34 % marginal farmers category (less than 1 ha) have preference of purchasing tractor over power tiller . This scenario may be due to versatile nature of the tractor for carrying out most of the farm operations and transportation work.
Only about 15.2 % of the farmers have training for proper use and maintenance of tractors and about 55 % of them have a driving license for driving of tractor. Nearly ninety percent of farmers are facing the difficulty in maintaining draught animals, about 64 % of the farmers have problems regarding non availability of labour during peak agricultural operation season and about 61 % have problems of timely completion of farm operations. The above reasons were stated by the farmers for opting for the buying of farm tractor.
IV. ACKNOWLEDGMENT
We are highly thankful to our Principal Dr Sarat Kumar Maharana for his inspiration and support. We also sincerely thank our department faculty members and staff for their help without which it would have been difficult for us to complete the project.
Conclusion
1) Average annual use of tractor was found out to be 1,772.62 hours. However, tractor usage were of less time in actual agricultural operations. This may further increase if threshing operation is also carried out through the tractor engine. 2) Tractors are being used for the use by farmers as well as for custom work. The tractor use percentage for their own work was 29.53 % and for the rest of the time, the tractor was used for custom hiring work. 3) Average cost of operation of the tractor was initially higher and afterwards there is a decreasing trend with the increase in age. 4) Break-even point of the tractor increased with the increase in the size of the tractor. The maximum break-even point was observed as 685.20 hours in case of 26.11 kW tractors. 5) The purchase and use of a tractor was profitable in the study area since average annual use in each case was found to be higher than the break -even point. 6) All the tractor owned farmers have cultivator and trolley but no farmer have the ownership of harvesting machinery. Thus, there existed a clear gap of machinery ownership. 7) The maximum failure recorded for brake malfunctioning, gear damage and wearing of clutch plate.
References
[1] KumariA andKumariG.2014.StudyonmarketingpatternoftractorinAligarhdistrictUttarPradesh.InternationalJournalofAgriculturalEngineering7(1):27-32. [2] Mehta CR, Chandel NS, Senthil kumar Tand Singh K K.2014.Trends of agricultural mechanization in India. Economic and Social Commission for Asia and the Pacific (ESCAP) Policy Brief,(2). [3] MittalVK.1996. A study of the magnitude, causes and profile of victims of accidents with selected farm machines in Punjab: Final Report. Punjab Agricultural University, Ludhiana. [4] SinghAKandIndraM.2007.StudyofownershippatternoftractorsatfarmlevelindistrictMuzaffarnagar,U.P.InternationalJournalofAgriculturalSciences3(1):236-238. [5] SinghAK,MishraD,SharmaP,KaviaZDandPandePC.1995.Tractorvs.Power:ProjectionsofIndianAridZone.AgriculturalMechanizationinAsiaAfricaandLatinAmerica26(1):16-20. [6] SrivastavaAP,MishraIM,PanwarJSandKumarM.2000.TractorusepatterninthreeselecteddistrictsofUttarPradesh.XXXVConventionofISAEatOrissaUniversity ofAgricultureandTechnology,Bhubneshwar,Jan.22-24. [7] YadavSandLohanSK.2006.TractorandimplementownershipandutilizationofHaryana.AmaAgriculturalMechanizationinAsia,AfricaandLatinAmerica37(3):15. [8] Agrawal, B. 1983. Mechanization in Indian Agriculture and Analytical study based on the Punjab, Indian Journal of Agricultural Economics,Vol. 4(1): 145-158. [9] Dhawan,K.C.andJoginderSingh.1995.AneconomicanalysisoftractorisationofIndianagriculture:acasestudyinPunjabstate,AMA.AgriculturalMechanizationinAsia,Africaand Latin America.Vol25(4):61-64. [10] Gupta, R.S.R.1984.Tractorization helps in energy saving and reduce cost of production. Krishi Auzar Mela.19-22Sept. Souvenir.pp89. Kashyap, V.P.S.1980.Tractorization in Haryana. Agricultural Engg.Today.April.pp.9. [11] Pandey,G. S.1986.Break-evenanalysisofbullockvs.tractorpowerinHaryana. Agricultural Situation in India. Vol.3(41):143. [12] Parihar, R. S and D.S. Sindhu.1985.Tractorization,farmlabouremployment, productivity and net return. Journal of Agricultural Enng.Vol.22(4):82. [13] Sharma,A.C.1962.Tractorcultivation,itsEconomics.Touch-stone.Vol.3(4):33-35. [14] Singh,BhagwanandK.N.Singh.1991.Utilizationofdifferentmodeloftractor on large mechanizedfarm.JournalofAgril.Engg.Vol28:217-222.
Copyright
Copyright © 2023 Dr. Satyananda Swain, Prof. Pradosh Manoranjan Sahoo, Bibhuti Bhusan Mallick, Nilima Bala, Payaswini Sahu, Subhashree Subham Mallick. This is an open access article distributed under the Creative Commons Attribution License, which permits unrestricted use, distribution, and reproduction in any medium, provided the original work is properly cited.

Download Paper
Paper Id : IJRASET53286
Publish Date : 2023-05-29
ISSN : 2321-9653
Publisher Name : IJRASET
DOI Link : Click Here
 Submit Paper Online