

Ijraset Journal For Research in Applied Science and Engineering Technology
Refined Segmentation of K-Means Cluster Using Hidden-Markov Random Field (HMRF) for Leukemia Detection
Authors: Suriyagrace R, Dr. M. Devapriya
DOI Link: https://doi.org/10.22214/ijraset.2022.41097
Certificate: View Certificate
Abstract
An important part in detecting and diagnosing leukaemia involves the microscopic examination of a patient’s blood sample. The type of malignant cells called the blasts is frequently determined by morphological alterations in White Blood Cells (WBCs). Real-time procedures are time-consuming, error-prone, and expensive. In order to overcome this problem the features such as the colour, shapes and texture can be extracted from the original image. This paper deals with the segmentation techniques. The segmentation process in automated approach is developed using k-means clustering (KMC) and Hidden-Markov Random Field (HMRF). This is also termed as Refined Segmentation (Re-Se). This analysis includes Aspirate Smear Images (ASI). First cell segmentation using a KMC is performed, then a Cell Image Representing Model (CIRM) using HMRF is build, estimating prototype variables using Expectation Maximization (EM) ratio, iterating until the best value is found, and finally achieving next phase called Refined Segmentation (Re-Se). Then, features including texture, geometry, colour, and statistical information are retrieved and used to categorize leukaemia cells from WBCs, by using Fuzzy Rule-Based Decision Support System (FRDSS). By incorporating more feature extraction techniques, the suggested method improves a blast of most immature cells identification for the Acute Myeloid Leukemia (AML) detection.
Introduction
I. INTRODUCTION
Leukemia is a term used to describe a tumour development or an increase in the life cycle of immature WBCs in the bone marrow. Generally, leukaemia is classified into acute and chronic variants based on the rate at which the illness progresses[1]. Acute leukaemia develops quickly and produces a large number of leukemic cells. Chronic leukaemia progresses slowly over time, allowing more mature leukocytes to perform some of their usual tasks. Generally, it is classified as Myelogenous or lymphoid based on the kind of affected cell from which the malignancy emerges[2].
A clinical history, physical examination, total blood count, and bone marrow sample are usually used to diagnose leukaemia. The presence of malignancy can be determined qualitatively and quantitatively using a microscope screening of a peripheral blood smear. Experienced haematologists must execute this procedure, which consists of two primary analyses. The first assignment entailed a qualitative examination of the cells' morphology, and second task involved quantitative approach by performing differential counting of WBCs types[3].
Morphological criteria have been used by haematologists to identify malignant cells in the ASI sample under a light microscope. An ideal automated screening system will acts as a human expert during this procedure. There are a few processes in this procedure, such as image capturing, pre-processing, segmentation, feature extraction, and identification of data for efficient detection of leukaemia cells, to create this approach[5].
To improve the image and to detect the nuclei, image processing techniques such as Optimum Contrast Stretching (OCS) and the KMC algorithm were utilised for the nuclei segmentation process. The characteristics based on geometry, colour, shape, and statistics are then collected, and a FRDSS is used for improving the leukaemia detection outcomes. However, K values are difficult to predict in the segmentation field and are not ideal for non-convex clusters. This research work solves the problem by refining the k-clusters using the effective HMRF approach.
II. PROPOSED METHODOLOGY
The main goal of this research is
- To identify leukemia cells from the WBC’s.
- The images are pre-processed using Optimal Contrast Stretching (OCS) technique.
- During Image Segmentation, the nuclei of WBC’s are segmented based on the global and local curvature properties.
- Normal WBC’s are removed from the microscopic image.
- By combining Colour and Spatial information of Blood Cell Images (BCI), Mahalanobis Distance Vector (MDV) is employed as a similarity value of spatial clustering in lab colour space.
- This is done to increase the segmentation accuracy.
- This simplifies the work of extracting cell characteristics and properly differentiating the nucleus and cytoplasm by segmenting the BCI into backdrop, nucleus, cytoplasm and detritus.
- The extracted features are trained by using a Fuzzy Rule based Decision Support System (FRDSS) comprising of linear feature vectors of each cell for detecting the leukemia cells from WBC’s.
III. IMAGE PROCESSING USING OCS
The Blood Cell Images are collected from kaggle.com. These data include segmented portion of normal and blast cells collected from both leukaemia patients and healthy people's peripheral blood samples. The use of contrast stretching to pre-process microscopic blood images improves the global homogeneity, local sensitivity, and geometry of the blood cells. It is achieved by using morphological addition and subtraction procedures. By using this technique the contrast is extended by 50%, which allows a more precise targeting of WBC nuclei in a blood microscopic image. The lower and upper limits are de?ned as “a=0” and “b=255”. The automatic selection of these values will improve the efficiency of the CS. Deep Learning technique is used for the automatic selection of a and b value based on the ranked probability score and this algorithm is called as OCS.
A. Re-Se using KMC and HMRF Technique
A Refined Segmentation (Re-Se) method is used for analysing the Aspired Smear Images (ASI). The cell segmentation is performed with K-Means Clustering Method (KMC). A Cell Image Representing Model (CIRM) with HMRF is developed to determine the model parameters with Expectation Maximization (EM) ratio and completes convergence iteration until the optimal value is obtained.
B. Refine cell Segmentation Based on HMRF with EM
HMRF provides a conditional Markov Random Field (MRF) of a Blood Cell Image (BCI). It is tuned using the EM probability function and pixel space information to get an optimum value. External variables such as illumination and noise may be efficiently avoided by this strategy. The Markov Random Field (MRF) principle integrates probability concepts with decision/estimation principles to create a theoretical framework for understanding spatial interactions between image pixels. If the Aspired Smear Image (ASI) only contains nucleus and cytoplasm, then nucleus and cytoplasm will be the only two components in this space. For all pixels in this region, check the following conditions:
- They are identified as nucleus if all of the pixels close to them are labelled as nucleus.
- If the pixels close to them are all classified as cytoplasm, they are labelled as cytoplasm as well.
- When the neighbouring pixels have both nucleus and cytoplasm, create the Energy function (Ef ), compute the category probability of the pixels, and label the pixels as the category with the highest likelihood.
The most popular optimization strategy in Markov Random Field models is Maximum A Posterior(MAP) probability and the MAP-MRF system is the combination of these two. Maximum A Posterior is a technique for reducing pixel labelling inaccuracy. When the random variables for the observed field are provided, find the pixel with the highest probability.
C. HMRF Parameter Prediction using EM
The Gibbs energy parameters are estimated for images with simple texture and no noise. The majority of the images which are segmented contain a diversity of texture and noise. The computing complexity is enhanced because the Blood Cell Image’s include a large number of Markov Random Field’s. When there is concealed data, the Expectation Maximization method computes the maximum likelihood. The approach involves a gradient search algorithm, which can only ensure local best convergence and cannot guarantee local best convergence.
D. Feature Extraction Process
The performance of an automatic White Blood Cell classification system is dependent on feature extraction. Geometrical parameter includes area, radius, perimeter, convex area, main axis length, compactness, and orientation, textural aspects includes momentum, contrast, entropy, and Skewness, colour features includes colour distribution and histogram. Four sorts of characteristics are retrieved for categorization. Geometrical feature includes the Area, Area feature, length feature(Lengthvar ) and the compactness feature (featurecomp ). The pixel number in the segmented cell region is represented by the Area and its feature
E. Fuzzy Rule Based Decision Support System (FRDSS)
Fuzzy Rule based Decision Support System (FRDSS) is used to predict leukaemia using computer-assisted diagnostics. The process of creating a mapping from a given input to an output using fuzzy logic is known as a Fuzzy Inference System (FIS).
There are two methods in the Fuzzy Rule based Decision Support System. First, the centre of gravity method entails selecting a value that corresponds to the solution set's centre of gravity. Another approach is bisector, which produces a result that divides the area of the solution in two sets.
Defuzzification techniques are further classified into three categories. These techniques are concerned with the solution set’s maximum membership value.
- The largest value of solution set is usually expressed as a series of integers.
- "Smallest of maxima" chooses the lowest value where the greatest membership value is found.
- "Middle of maxima" chooses the middle values where the highest membership value is found.
- "Biggest of maxima" chooses the largest values where the highest membership value is discovered.
A benefit of this approach system is the automated technique for generating fuzzy rules. The feature extraction technique is used to generate fuzzy rules and decision tree rules. The feature attributes are utilised to build the fuzzy rules, which are subsequently weighted depending on the frequency of the datasets. These fuzzy and decision tree rules are useful in developing a clinical decision support system based on the fuzzy inference system.
IV. PERFORMANCE EVALUATION
A. Dataset Description
Collection of around 500 images of blood cell samples in JPEG format with cell category tags is chose for training. 50 datasets of Eosinophil, Lymphocyte, Monocyte, and Neutrophil are organised into four distinct folders based according on the cell type. The dataset is complemented by another set of dataset that includes the original 410 pictures (pre-amplification), two extra subcategory tags (WBC versus WBC), and bounding boxes for all cells in each of the 410 shots. The 'Dataset-Master' directory has 410 photographs of blood cell with subcategory tags and bounding boxes, but the 'Dataset2-Master' directory contains 2,500 amplified photos with 4 extra subcategory tags. Approximately 3,000 enhanced images for each of the four tags.
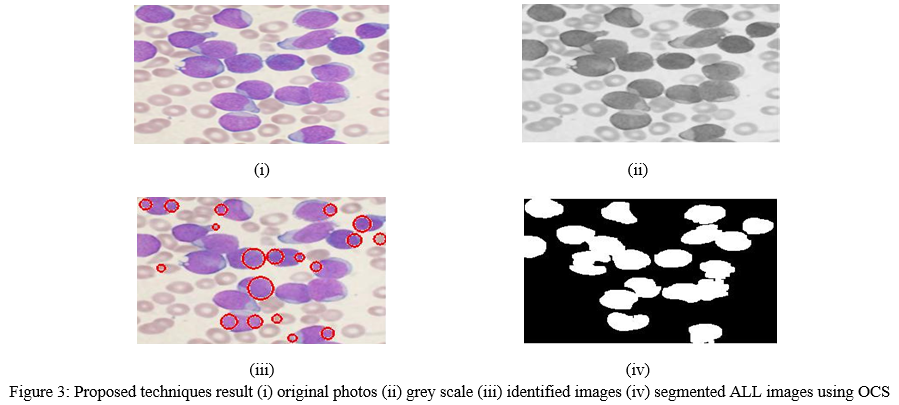
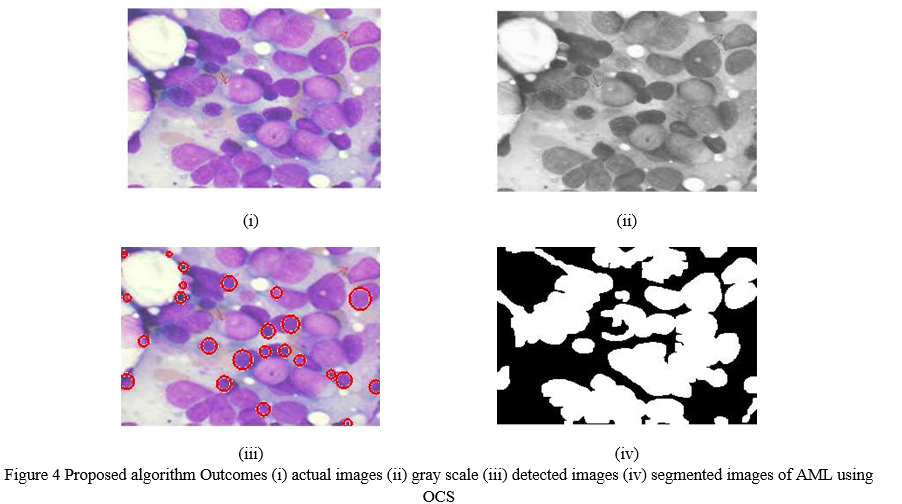
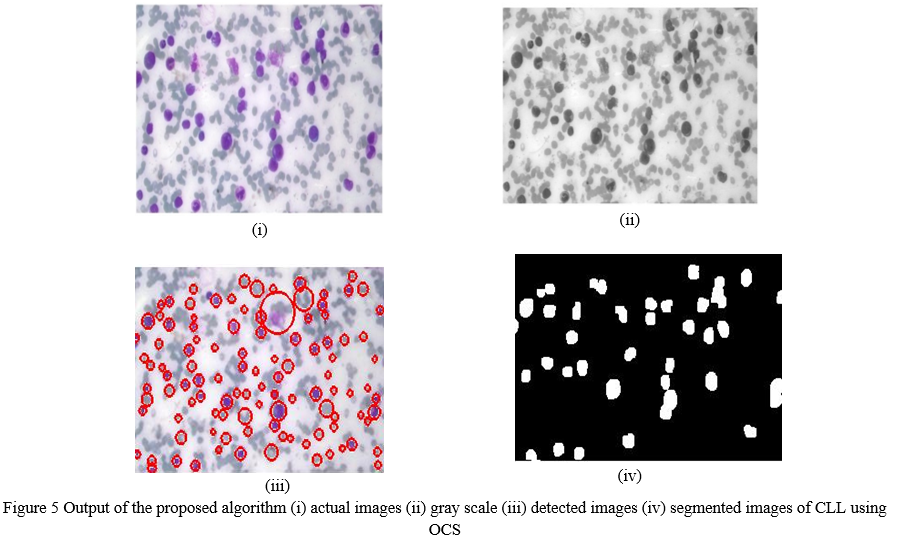
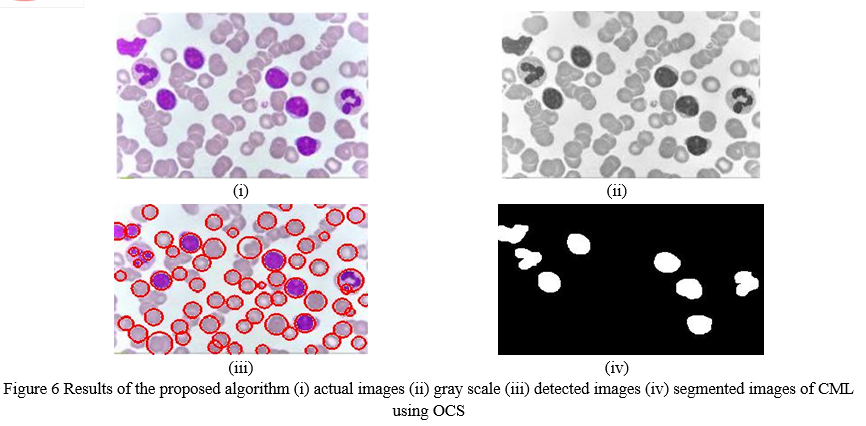
The results of using the suggested technique demonstrate good cell categorization and high values of statistical evaluation parameters. Figures 3–6 demonstrate the categorization results for four types of leukaemia images: Acute Myelogenous Leukemia (AML), Chronic Myeloid (or Myelogenous) Leukaemia (CML), Acute Lymphoblastic Leukemia (ALL), and Chronic Lymphocytic Leukaemia (CLL).
B. Experimental Results
The results after using the suggested approach reveals that the cells are classified correctly and the statistical evaluation parameters have high values. The performance of the existing classifiers like the (HMRF+KM+EM), Stepwise Averaging Method with Interval-Valued Fuzzy Sets (SWAM+IVFS), AIFS and FMM with Hue Saturation Value (AIFS+FMM+HSV), OCS+KM+FRDSS and the proposed classifiers like Re-Se with OCS+KM+FRDSS (OCS+ RS + FRDSS) is evaluated by these parameters: precision, recall, f-measure, segmentation accuracy and classification accuracy.
- Precision: It is determined as the fraction of cancerous pairs correctly put in the same class label and it is estimated as follows:
Precision=TPTP+FP
Table 1 shows that the precision comparison results of microscopic image dataset between proposed and existing methods based on number of images
Table 1 Numerical results of Precision rate
|
Number of images |
EXISTING CLASSIFIERS |
PROPOSED CLASSIFIER |
|||
|
HMRF + KM+ EM |
SWAM+ IVFS |
AIFS+FMM+HSV |
OCS+KM+ FRDSS |
OCS+ RS+ FRDSS |
|
|
10 |
78 |
80 |
82 |
85 |
87 |
|
20 |
81 |
84 |
86 |
91 |
92 |
|
30 |
83 |
85 |
87 |
93 |
94 |
|
40 |
84 |
86 |
89 |
95 |
96 |
|
50 |
85 |
88 |
91 |
96 |
97 |
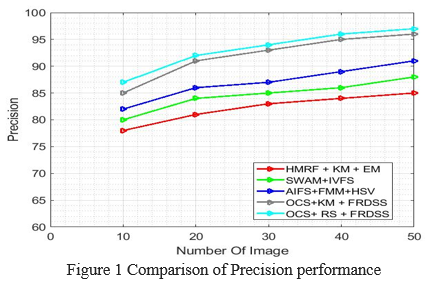
Figure 1 shows that the precision comparison results of microscopic image dataset between proposed classifier and existing classifier based on number of images. When the number of image is 50, the existing classifier methods are 14.11, 10.22, 6.59% and 1.04% which is respectively lower than the proposed classifier method. Hence, it is proved that the proposed classifier method achieve a superior precision than the other classical method.
2. F-MEASURE
It is an average mean of precision and recall as:
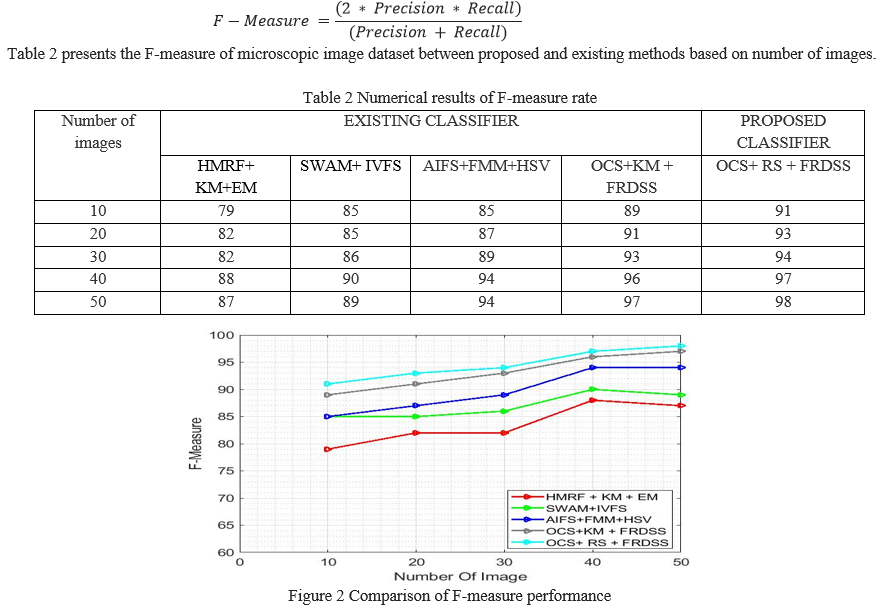
Figure 2 shows that the F-measure comparison results of microscopic image dataset between proposed classifier method and existing classifier methods are based on number of images. When the number of image is 50, the existing classifier methods are 12.64%, 10.11%, 4.25% and 1.03% respectively which are lower than the proposed classifier method. Hence, it is proved that the proposed classifier method achieves a superior F-measure value than the other classical method.
3. Recall: This metric represents the likelihood of being malignant among those who have been diagnosed with cancer.
It is defined as:
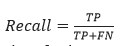
Table 3 presents the recall comparison results of microscopic image dataset between proposed and existing methods based on number of images.
The recall comparison results in a microscopic image dataset between the proposed classifier method and the existing classifier methods are based on the number of images. When the number of images is 50, the existing classifier methods are 11.49%, 8.98%, 4.30%, and 1.04% lower than the proposed classifier method.
4. Segmentation Accuracy: To measure generalization ability, two measures are employed. The first measure is the direct pixel density of the ground truth mask and the partitioned mask produced by the segmentation algorithm. Let In and IMn are the amount of non-zero pixels in the resultant nucleus and the amount of pixels in the ground truth mask. The partition accurateness is determined as:
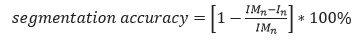
Table 4 shows the segmentation accuracy comparison results of a microscopic image dataset with regard to the number of images.
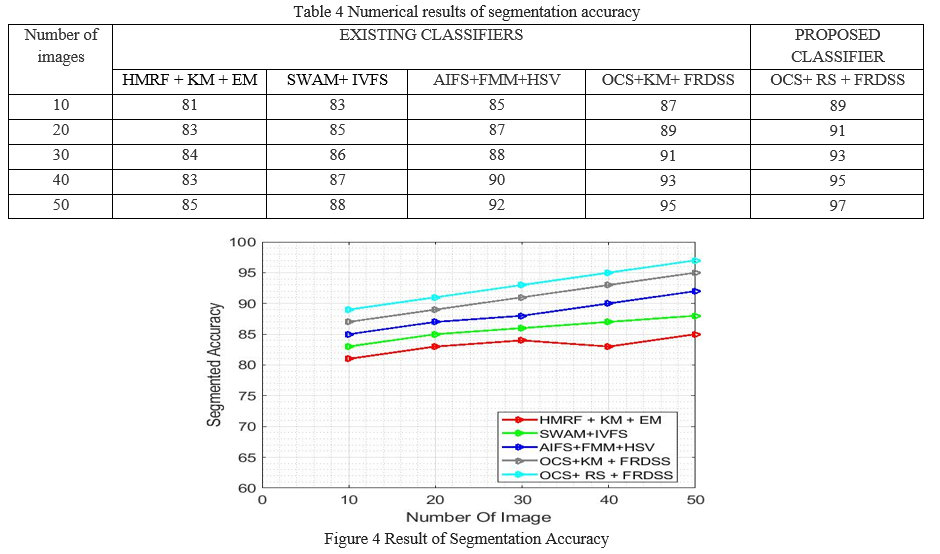
Figure 4 shows that the segmentation accuracy comparison results of microscopic image dataset between proposed classifier method and existing classifier methods are based on number of images. When the number of image is 50, the existing classifier methods are 14.11%, 10.22%, 5.43%, and 2.10% which is respectively lower than the proposed classifier method. Hence, it is proved that the proposed classifier method achieves superior segmentation accuracy than the other classical method.
5. Classification Accuracy: It is the fraction of the exactly categorized images to the overall amount of images.
Table 5 presents the classification accuracy of microscopic image dataset between proposed and existing methods based on number of images
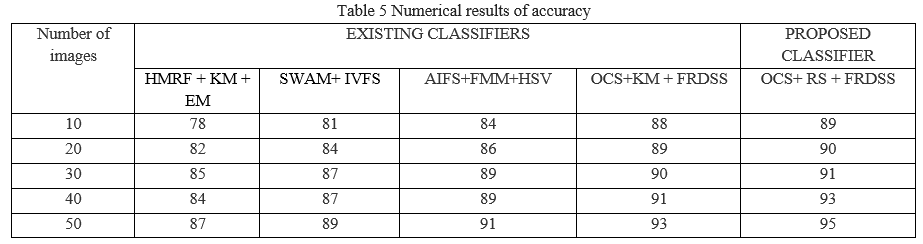
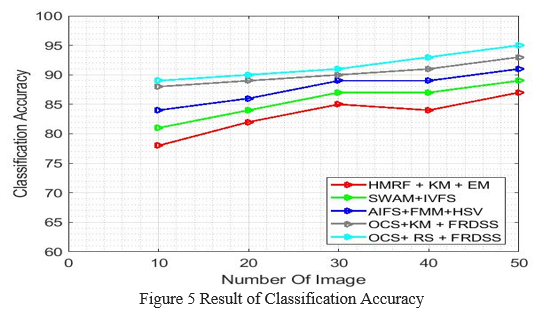
Figure 5 shows that the segmentation accuracy comparison results of microscopic image dataset between proposed classifier method and the existing classifier methods are based on number of images. When the number of image is 50, the existing classifier methods are 9.19%, 6.74%, 4.39%, and 2.15% which is respectively lower than the proposed classifier method. Hence, it is proved that the proposed classifier method achieves a superior classification accuracy than the other classical method.
Conclusion
In this part, automated approach is suggested for detecting acute mylegenous leukaemia and acute lymphatic leukaemia. This approach performs initial cell segmentation using K-Means Clustering which builds a Cell Image Representation Model with Hidden Markov Random Field. This estimates space representation constraints with Expectation Maximization probability that iterates until optimum, and finally achieves the segmentation stage (Re-Se) with 97% accuracy rate. Furthermore, a FR-DSS for computer-aided leukaemia identification is provided. These fuzzy rules and decision tree rules are utilised to construct the clinical decision support system by utilising the fuzzy inference system which results in a high accuracy rate of 93%. The accuracy of the identification of leukaemia is increased further in the feature extraction phase by adding more characteristics in the future. The experiment proves that the proposed method using the optimum contrast stretching and the fuzzy rule based decision support system is improved on the basis of precision, F1-measure, Recall, segmentation accuracy and Classification accuracy than the existing approaches for segmentation of the leukemia images.
References
[1] Bodzas, A., Kodytek, P., & Zidek, J. (2020). Automated detection of acute lymphoblastic leukemia from microscopic images based on human visual perception. Frontiers in Bioengineering and Biotechnology, 8, 1005. [2] Rasool, M., Farooq, S., Malik, A., Shaukat, A., Manan, A., Asif, M., ... & Hussain, A. (2015). Assessment of circulating biochemical markers and antioxidative status in acute lymphoblastic leukemia (ALL) and acute myeloid leukemia (AML) patients. Saudi journal of biological sciences, 22(1), 106-111. [3] Short, N. J., Konopleva, M., Kadia, T. M., Borthakur, G., Ravandi, F., DiNardo, C. D., & Daver, N. (2020). Advances in the Treatment of Acute Myeloid Leukemia: New Drugs and New Challenges. Cancer Discovery, 10(4), 506-525. [4] Putzu, L., Caocci, G., & Di Ruberto, C. (2014). Leucocyte classification for leukaemia detection using image processing techniques. Artificial intelligence in medicine, 62(3), 179-191. [5] Agaian, S., Madhukar, M., & Chronopoulos, A. T. (2014). Automated screening system for acute myelogenous leukemia detection in blood microscopic images. IEEE Systems journal, 8(3), 995-1004. [6] Haidekker, M. (2010). Advanced biomedical image analysis. John Wiley & Sons. [7] Cao, H., Liu, H., & Song, E. (2018). A novel algorithm for segmentation of leukocytes in peripheral blood. Biomedical Signal Processing and Control, 45, 10-21. [8] Su, J., Liu, S., & Song, J. (2017). A segmentation method based on HMRF for the aided diagnosis of acute myeloid leukemia. Computer methods and programs in biomedicine, 152, 115-123. [9] Kumar, S., Mishra, S., & Asthana, P. (2018). Automated detection of acute leukemia using k-mean clustering algorithm. In Advances in computer and computational sciences (pp. 655-670). Springer, Singapore. [10] Shahin, A. I., Guo, Y., Amin, K. M., & Sharawi, A. A. (2018). A novel white blood cells segmentation algorithm based on adaptive neutrosophic similarity score. Health information science and systems, 6(1), 1. [11] Bouchet, A., Montes, S., Ballarin, V., & Díaz, I. (2020). Intuitionistic fuzzy set and fuzzy mathematical morphology applied to color leukocytes segmentation. Signal, Image and Video Processing, 14(3), 557-564. [12] Daud, N. H. M., Raof, R. A. A., Osman, M. K., & Harun, N. H. (2021, February). Segmentation Technique for Nucleus Detection in Blood Images for Chronic Leukaemia. In Journal of Physics: Conference Series (Vol. 1755, No. 1, p. 012053). IOP Publishing. [13] Mathavan, S., Kumar, A., Kamal, K., Nieminen, M., Shah, H., & Rahman, M. (2016). Fast segmentation of industrial quality pavement images using Laws texture energy measures and k-means clustering. Journal of Electronic Imaging, 25(5), 053010. [14] Sun, L. Y., Han, J. W., Hu, X. T., & Guo, L. (2013). Cell Segmentation in Microscopic Images of Mice Brain Based on Markov Random Field Theory. Pattern Recognition and Artificial Intelligence, (5), 13. [15] Gelman, A., Carlin, J. B., Stern, H. S., Dunson, D. B., Vehtari, A., & Rubin, D. B. (2013). Bayesian data analysis. CRC press. [16] Selim, B., Alhussein, O., Muhaidat, S., Karagiannidis, G. K., & Liang, J. (2015). Modeling and analysis of wireless channels via the mixture of Gaussian distribution. IEEE Transactions on Vehicular technology, 65(10), 8309-8321. [17] Garriga, J., Palmer, J. R., Oltra, A., & Bartumeus, F. (2016). Expectation-maximization binary clustering for behavioural annotation. PLoS One, 11(3).
Copyright
Copyright © 2022 Suriyagrace R, Dr. M. Devapriya. This is an open access article distributed under the Creative Commons Attribution License, which permits unrestricted use, distribution, and reproduction in any medium, provided the original work is properly cited.

Download Paper
Paper Id : IJRASET41097
Publish Date : 2022-03-30
ISSN : 2321-9653
Publisher Name : IJRASET
DOI Link : Click Here
 Submit Paper Online