

Ijraset Journal For Research in Applied Science and Engineering Technology
The Role of Risk Assessment in Investment Project Risk Management
Authors: Shaislamova Nargiza Kabilovna
DOI Link: https://doi.org/10.22214/ijraset.2022.43925
Certificate: View Certificate
Abstract
The article highlights the features of risk management and presents the main stages of risk management of investment projects developed by the autor. The article also presents the content of the methods of risk analysis that are frequently used in practice. In particular, the author shows the essence of methods for assessing investment risks, such as the sensitivity analysis of the project, the method of Scenarios, the method for assessing the sustainability of the project, and others.
Introduction
I. INTRODUCTION
In defining the priorities and development programs of the Republic of Uzbekistan, of course, the main focus is on creating a more favourable investment climate in the country and attracting foreign investment in the national economy. The President of the Republic of Uzbekistan Sh. M. Mirziyoyev in his Address to the Oliy Majlis wrote that: “Investments are the driver of the economy, in Uzbek, it is the heart of the economy, this is no exaggeration. Along with investment, new technologies, advanced experience, highly qualified specialists will come to various industries and regions, and entrepreneurship will develop rapidly”[1]. This is true, because the implementation of active and effective investment policy and the achievement of a more favourable investment climate for investors – has a positive impact on the economic and social development of the country. There is a need to fully demonstrate the investment potential of our country to attract more foreign investment in the national economy. One of the most important tasks for investors in the context of the coronavirus crisis is the analysis, assessment and effective management of risks that can affect investment projects before investing. And also, the investor must identify the factors that negatively affect the project results and develop measures to reduce their negative impact. Based on the above, it can be said that improving the methodology of risk analysis and assessment of investment projects on the basis of modern and best practices has become one of the urgent tasks.
The aim of research is to study various methods of risk assessment, which are a key part of investment risk management, and develop proposals for their application in Uzbekistan.
To achieve the aim of the study, the following tasks were identified:
Explain the content of the economic categories “risk” and “investment risk”;
Explain the content of investment risk management;
Development by the author of the stages of the investment risk management process;
Study and outline methods for assessing the risks of investment projects;
Development of recommendations on the application of risk assessment methods in Uzbekistan.
Subject of research: methods for assessing the risks of investment projects.
II. REVIEW OF THE LITERATURE
In the economic literature, a number of economists define risk in different ways. The word “risk” has Spanish-Portuguese roots and means “reef”, “underwater rock”. This is associated with the concept of “maneuvering between the rocks”, which means that it is fraught with danger [2].
In the dictionary of the Russian language, the famous lexicographer Ozhegov S. I., risk is defined as “a random action in the hope of a happy outcome”[3], and in the world-famous Webster dictionary, risk is defined as “the possibility of loss or injury”[4].
The concept of “uncertainty”, which is very close to the concept of “risk”, is used by a number of economists as a synonym for the classification of certain types of risk, in particular M. Bernadete Junkes, Anabela P. Tereso, Paulo S. L. P. Afonso wrote in their research: “Risk is, fundamentally, the possibility of financial loss. It is used as a synonym of uncertainty and refers to the variability of returns associated with an investment project”[5].
Professor Livshits V. N. explaining the difference between risk and uncertainty, wrote that: “Uncertainty is the incompleteness and inaccuracy of information about the conditions for the implementation of the project. The risk of a project for a given participant is understood as the possibility of such conditions for the implementation of the project, which he assesses negatively”[6].
Another Russian economist, Khominich I.P. argued that: “Risk is an economic category that represents the possibility of an event occurring that can entail three economic results: negative (damage, loss), zero and positive (benefit, profit). Risk is a subjective-objective category. The subjective side of risk lies in making certain strategic decisions and calculating the likelihood of their result. The objective side of risk is a qualitative and quantitative expression of possible manifestations of risk and their consequences”[7].
Michel Crouhy, Dan Galai, Robert Mark in their book commented on the concept of risk as follows: “In particular, we understand that risk is not synonymous with the size of a cost or of a loss. After all, some of the costs we expect in daily life are very large indeed if we think in terms of our annual budgets: food, fixed mortgage payments, college fees, and so on. These costs are big, but they are not a threat to our ambitions because they are reasonably predictable and are already allowed for in our plans.
The real risk is that these costs will suddenly rise in an entirely unexpected way, or that some other cost will appear from nowhere and steal the money we’ve set aside for our expected outlays. The risk lies in how variable our costs and revenues really are. In particular, we care about how likely it is that we’ll encounter a loss big enough to upset our plans” [8].
Michel Crouhy continued his scientific research on risks and highlighted three broad risk types in the global banking industry:
“Credit risk is the risk of loss following a change in the factors that drive the credit quality of an asset. These include adverse effects arising from credit grade migration, including default, and the dynamics of recovery rates.
Market risk is the risk of losses arising from changes in market risk factors. Market risk can arise from changes in interest rates, foreign exchange rates, or equity and commodity price factors.
Operational risk refers to financial loss resulting from a host of potential operational breakdowns that we can think of in terms of people risks, process risks, and technology risks (e.g., frauds, inadequate computer systems, a failure in controls, a mistake in operations, a guideline that has been circumvented, or a natural disaster)”.
Uzbek scientist, professor Abdullayeva Sh. Z. explained the difference between risk and danger as follows: “Danger is an already existing reality, that is, in most cases, danger is primary, risk is secondary. Usually, knowing that there is a danger and deciding to deal with it and get a positive result creates a risk. Danger often leads to negative situations. In our opinion, positive results of dangerous situations can be achieved only by risking” [9].
Uzbek Professor Vakhabov A. V. defines: “Investment risk as an integral part of the overall financial risk, which includes the possibility of financial losses and incomplete return on investment or additional investment costs [10].
Martina Merkova, Josef Drabek commented on risk: “Risk is unavoidable part of any entrepreneurship, so it is very important to make its analysis, but, paradoxically at the same time, it is one of the most underestimated parts of the project”[11].
Analysis of the set of definitions given to the nature of risk allows us to single out the main aspects that lead to risky situations: the random nature of the emerging situation; availability of alternative solutions; the ability to determine the expected result; the likelihood of additional costs; the possibility of obtaining additional income.
Currently, project risks are understood as a set of situations that lead to a decrease in the expected benefit (efficiency) from the project. At the same time, the risk of an investment project is also the sum of risks that impede the implementation of the investment project or reduce the efficiency of the project. Investment risk can be defined as the possibility of loss of reserves, the inability to receive income or the need for additional costs as a result of making a certain investment decision.
III. RESEARCH RESULTS AND DISCUSSION
To date, for the successful implementation of investment projects, measures are being developed to effectively manage and reduce investment risks. When developing and implementing an investment project, it is necessary to take into account, study and analyse each type of risk, develop measures to reduce them, which is the most effective way to prevent risk events.
Risk management can be understood as a set of actions aimed at determining a reasonable combination of risk and reward [12]. In our opinion, risk management is a structural process that is constantly carried out in a company in order to identify, assess, calculate, control (monitor) and reduce risks affecting the profitability of an investment project and their consequences. The purpose of risk management and assessment is to provide the investor with the information necessary to make decisions on the advisability of participating in the implementation of an investment project and to develop measures to protect against possible financial losses.
In our opinion, risk management consists of six stages, the first of which is to determine the risk factor, that is, the cause of the risk and the event or situation that may affect the project. At the second stage, the analysis and assessment of risks is carried out; it should be noted that risk assessment can be divided into two groups: a) qualitative risk assessment - aimed at identifying types of risks, their causes and organizational measures to reduce risks; b) quantitative risk assessment - means calculating a quantitative expression of project risks through project indicators, determining the likelihood of risks and the impact of risks on the project. Next, risk mitigation planning is the application of specific measures within the selected risk management measures and methods. At the fourth stage, risk prevention and control is carried out; specific organizational and technical measures based on specific plans and programs, such as risk monitoring, risk prediction, collection of data on negative impact and subsequent costs associated with risk, development of risk prevention guidelines are discussed. Then, in the fifth step, risk management methods are selected and applied. At the final stage, information about risky situations and their consequences are collected and recommendations for the future are given. The received instructions and conclusions will be used in the implementation of subsequent projects.
It should be noted that when managing the risks of investment projects, management methods are selected based on the results of their analysis and evaluation. This means that the more accurate the project risk assessment is, the more accurate and reliable the project data will be and the more efficient project management will be.
In practice, there are several methods for assessing investment risks, the main of which are listed below.
1. The sensitivity analysis of the project shows how much the main indicator of the project efficiency (NPV or IRR) changes with a certain change in the given parameters of this project. The more the project performance indicators change with the change in the initial conditions, that is, if the project is more sensitive to changes in direct and indirect factors, the higher the project risk level.
The following algorithm is used to perform the sensitivity analysis.
a. First, the main indicator of the project is selected, for example, net present value or internal rate of return.
b. Then the factors that most significantly affect the sensitivity are selected, for example, the selling price, the value of variable or fixed production costs, sales volume, loan fees, the amount of investment costs, and the cost of capital raised.
c. Next, the value of the main indicator for the given ranges of factors is calculated.
d. Finally, the factors to which the project is most sensitive are determined, and a decision is made to implement the project or to complete the feasibility study.
The factors that affect the efficiency of the project (that is, they are called parameters) are divided into two groups:
- Factors Directly Affecting Income and Expenses: Sales volume, product price, production costs, investment volume, interest payments on loans and others.
- Indirect Factors: The terms of construction, the production period, delays in payments, sales of finished products, inflation, income tax rate and others.
Sensitivity analysis is recommended to identify factors that significantly affect the results of investment projects, and for comparative analysis.
2. Scenario analysis allows us to determine the impact on the main indicators of the project of all project parameters. In this case, the deviations of the project parameters are calculated taking into account the correlation between them. During the risk analysis, three scenarios are calculated: pessimistic, baseline and optimistic. In a pessimistic scenario, parameter values are used that are lower than expected. This takes into account the correlation between the parameters. For example, a decrease in the volume of products sold is likely to lead to an increase in the price of these products. If, at the same time, all the parameters that are significant for successful work on the project are deteriorated, then a decrease in the quality of the project should be expected. However, the probability of simultaneous deterioration of a large number of weakly correlated values is small. Therefore, the choice of the characteristics of the pessimistic scenario should be treated very carefully. The same difficulties are encountered when developing an optimistic scenario. The Monte Carlo simulation method is devoid of these drawbacks.
3. The method for assessing the sustainability of the project is one of the types of the scenario method described above. It assesses the risk of losing or decreasing the expected profit or increasing losses or costs when the conditions of the investment project change, that is, when the project scenario changes. Often three scenarios are used when conducting a risk analysis: baseline, optimistic and pessimistic. The net present value is calculated accordingly for each scenario: for the optimistic scenario - ., for the baseline scenario - and for the pessimistic scenario, . The deviation of the project from the net present value is calculated using the following for (1)[1]
Where:
) – Variation of Net Present Value;
– Net Present Value for the optimistic scenario;
. – Net Present Value for the pessimistic scenario.
According to this formula, the wider the project NPV variation width, the higher the risk level.
Using the risk assessment methods presented above, we will evaluate the risks of the towel manufacturing enterprise.
Initial information on the project is given below (Table-1,2,3,4).
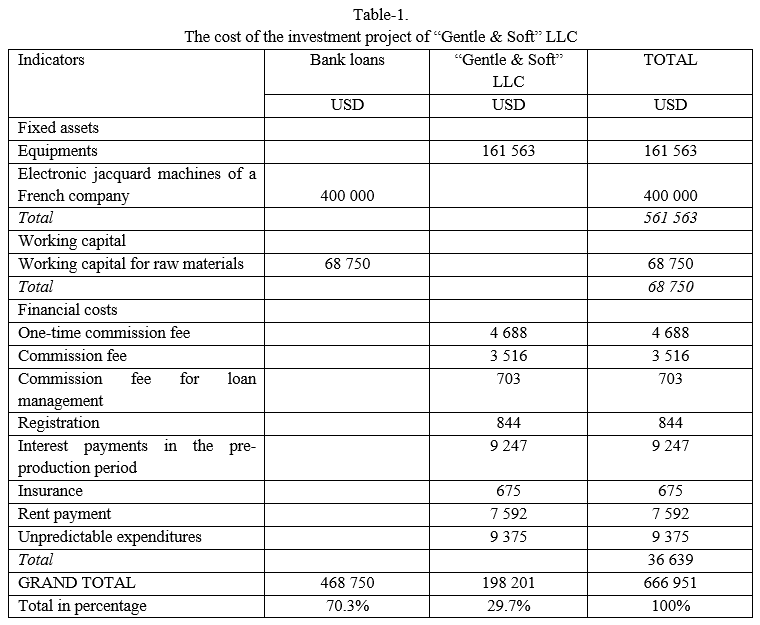
The main goal of the investment project of “Gentle & Soft” LLC is to get a loan from the bank in the amount of 468,750 US dollars for the production of towels. The loan will be used to purchase electronic jacquard machines from a French company, as well as a belt machine from a German company and raw materials (high-quality cotton yarn) from PolimerNamStroy LLC and Etiqod Savdo Servis LLC.
The total cost of the project is 666 951 US dollars, of which 70.3% or 468 750 US dollars are bank loans, and the remaining 29.7% or 198 201 US dollars are the company’s own funds.
The term of the investment project of “Gentle & Soft” LLC is 5 years.
According to the plan, “Gentle & Soft” LLC will reach its full capacity (100%) by the 4th year, and by years the capacity development is set as follows: in the 1st year - 85%; in the 2nd year - 90%; in the 3rd year - 95%; in the 4th year - 100%; in the 5th year - 100% (Table-2).
Table-2.
Schedule of full capacity development for the investment project of “Gentle & Soft” LLC
|
Reaching full capacity/ Years |
1 |
2 |
3 |
4 |
5 |
|
Capacity |
85% |
90% |
95% |
100% |
100% |
|
Total revenue |
1 716 839 |
1 847 241 |
1 977 643 |
2 108 045 |
2 108 045 |
The production costs of the investment project of “Gentle & Soft” LLC at full capacity are given in the table below.
Table-3.
The production costs of the investment project of “Gentle & Soft” LLC at full capacity
|
Cost item |
Total costs, USD |
Fixed costs (share) |
Variable costs (share) |
Fixed costs, USD |
Variable costs, USD |
|
Material costs |
1 243 915 |
0% |
100% |
0 |
1 243 915 |
|
Personal costs |
151 536 |
0% |
100% |
0 |
151 536 |
|
Other expenses (the cost of decorating the fabric) |
240 240 |
0% |
100% |
|
240 240 |
|
Rent payment |
9000 |
100% |
0% |
9000 |
0 |
|
Administration services |
8 460 |
100% |
0% |
8 460 |
0 |
|
Insurance |
469 |
100% |
0% |
469 |
0 |
|
Depreciation charges |
56 156 |
100% |
0% |
56 156 |
0 |
|
TOTAL |
1 709 776 |
|
|
74 085 |
1 635 691 |
Loan terms for the investment project of “Gentle & Soft” LLC are given in table-4.
Table-4.
Loan terms for the investment project of “Gentle & Soft” LLC
|
Grace period |
6 months |
|||
|
Interest rate |
8% |
|||
|
Amount of credit, USD |
468750 |
|||
|
Payment periods |
Principal payments |
Balance |
Interest payments |
Total payments |
|
Year 0 |
0 |
468750 |
|
- |
|
Year 1 |
52083 |
416667 |
36130 |
88213 |
|
Year 2 |
104167 |
312500 |
29514 |
133681 |
|
Year 3 |
104167 |
208333 |
21181 |
125347 |
|
Year 4 |
104167 |
104167 |
12847 |
117014 |
|
Year 5 |
104167 |
- |
4514 |
108681 |
|
TOTAL |
468750 |
- |
104186 |
572936 |
The structure of cash flows of the investment project of “Gentle & Soft” LLC and future income and expenses of the investment project are presented in the table below, where investment costs in year 0 amounted to 468,750 US dollars, cash flows in the 1st year amounted to 249713 USD, in the 2nd year 312523 USD, in the 3rd year 203615 USD, in the 4th year 259015 USD, and in the 5th year 267348 USD.
Table-5.
Cash flow from “Gentle & Soft” LLC investment project for the production of towels
|
Indicators/Years |
1 |
2 |
3 |
4 |
5 |
|
Total revenue (USD) |
1 716 839 |
1 847 241 |
1 977 643 |
2 108 045 |
2 108 045 |
|
Depreciation charges |
56 156 |
56 156 |
56 156 |
56 156 |
56 156 |
|
Material costs |
1 057 327 |
1 119 523 |
1 181 719 |
1 243 915 |
1 243 915 |
|
Total Income |
603 356 |
671 562 |
739 768 |
807 974 |
807 974 |
|
Period expenses |
|
||||
|
Administration services |
8 460 |
8 460 |
8 460 |
8 460 |
8 460 |
|
Insurance |
469 |
469 |
469 |
469 |
469 |
|
Production costs |
151 536 |
151 536 |
151 536 |
151 536 |
151 536 |
|
Other expenses (rent payment, the cost of decorating the fabric) |
213 204 |
225 216 |
237 228 |
249 240 |
249 240 |
|
General operating costs |
373 669 |
385 681 |
397 693 |
409 705 |
409 705 |
|
Operating income |
229 687 |
285 881 |
342 075 |
398 269 |
398 269 |
|
Loan interest |
36 130 |
29 514 |
21 181 |
12 847 |
4 514 |
|
Taxes and fees |
- |
- |
173 435 |
182 563 |
182 563 |
|
Net Profit |
193 557 |
256367 |
147459 |
202859 |
211 192 |
|
NCF |
249 713 |
312523 |
203615 |
259015 |
267 348 |
|
DCF (r=18%) |
211 621.2 |
224 449.2 |
123 926.4 |
133 597.1 |
116 860.3 |
The following efficiency indicators were identified using the cash flow data of the investment project for the production of towels “Gentle & Soft” LLC:
Table-6.
Efficiency indicators of “Gentle & Soft” LLC
|
Net Present Value – NPV, USD |
143503.04 |
|
Profitability index – PI |
1.22 |
|
Internal Rate of Return – IRR, % |
27.67% |
|
Discounted Payback Period – DPP, days |
3 years 292 days |
In general, the analysis and evaluation of the financial and economic efficiency of “Gentle & Soft” LLC investment project for the production of towels has shown that the efficiency of the project is positive, the project can be accepted for financing.
A project sensitivity analysis was performed based on a 10% change in project initial data. The results of the sensitivity analysis for the planned investment project are shown in Table-7.
Table-7.
Sensitivity analysis of “Gentle & Soft” LLC investment project for the production of towels
|
Risk factor |
Indicators |
Unit |
Estimated value, USD |
Deviation ±10% |
NPV after change, USD |
Absolute change, USD |
Relative change, % |
|
Q |
Production volume (Quantity of product) |
tons |
663.128 |
596.815 |
-455898.42 |
-599401.62 |
317.69% |
|
VC1 |
Material costs |
USD |
1057327 |
1163059.7
|
-216958.83 |
-360462.03 |
151.19% |
|
VC2 |
Production costs |
USD |
151 536 |
166689.6
|
96115.14
|
-47388.05 |
33.02% |
|
VC3 |
Other expenses (the cost of decorating the fabric) |
USD |
204204
|
224624.4
|
75950.55741
|
-67552.64 |
47.07% |
|
FC1 |
Rent payment |
USD |
7650
|
8415
|
142959.34
|
-543.86 |
0.38% |
|
FC2 |
Administration services |
USD |
8460 |
9306
|
140857.46
|
-2645.74 |
1.84% |
|
FC3 |
Insurance |
USD |
469
|
515.9
|
143356.38
|
-146.819959 |
0.10% |
|
FC4 |
Loan interest |
USD |
36130 |
39743
|
136172.44
|
-7330.76 |
5.11% |
|
NPV |
Net Present Value |
USD |
143503.04 |
|
|
|
|
The results of the project sensitivity analysis by changing the project values ±10 % show that the risk factors that mostly cause the decrease of NPV are production volume, material costs, the cost of decorating the fabric and production (labor) costs. The effect of other factors such as loan interest and administration services and is not so significant. Costs for rent and insurance have very little effect on NPV.
In order to use the scenario method, it is necessary to draw up 3 scenarios: optimistic, pessimistic and realistic. In this example, for a realistic scenario, we select all initial data for the project. And for the optimistic and pessimistic scenarios, we will change the data by 10%. Unlike the sensitivity analysis method the scenario method takes into account all parameter changes at once (rather than individually).
The results of the scenario method for the planned investment project are shown in Table-8.
Table-8.
Scenario risk assessment of “Gentle & Soft” LLC investment project for the production of towels
|
Indicators/Years |
1 |
2 |
3 |
4 |
5 |
|
Production volume (Q), tons |
663.13 |
713.50 |
763.86 |
814.23 |
814.23 |
|
Price per ton, USD |
2589 |
2589 |
2589 |
2589 |
2589 |
|
Total revenue, USD |
1716839 |
1847241 |
1977643 |
2108045 |
2108045 |
|
Depreciation charges, USD |
56156 |
56156 |
56156 |
56156 |
56156 |
|
Material costs, USD |
1057327 |
1119523 |
1181719 |
1243915 |
1243915 |
|
Total Income, USD |
603356 |
671562 |
739768 |
807974 |
807974 |
|
Administration services, USD |
8460 |
8460 |
8460 |
8460 |
8460 |
|
Insurance, USD |
469 |
469 |
469 |
469 |
469 |
|
Production costs, USD |
151536 |
151536 |
151536 |
151536 |
151536 |
|
Other expenses, USD |
213204 |
225216 |
237228 |
249240 |
249240 |
|
General operating costs, USD |
373669 |
385681 |
397693 |
409705 |
409705 |
|
Operating income, USD |
229687 |
285881 |
342075 |
398269 |
398269 |
|
Loan interest, USD |
36130 |
29514 |
21181 |
12847 |
4514 |
|
Taxes and fees, USD |
0 |
0 |
173435 |
182563 |
182563 |
|
Net Profit, USD |
193557 |
256367 |
147459 |
202859 |
211192 |
|
NCF, USD |
249713 |
312523 |
203615 |
259015 |
267348 |
|
DCF (r=18%, USD |
211621.2 |
224449.2 |
123926.4 |
133597.1 |
116860.3 |
|
NPV real, USD |
143503.2 |
||||
|
Indicators/Years |
1 |
2 |
3 |
4 |
5 |
|
Production volume (Q), tons |
596.82 |
642.15 |
687.48 |
732.81 |
732.81 |
|
Price per ton, USD |
2330.1 |
2330.1 |
2330.1 |
2330.1 |
2330.1 |
|
Total revenue, USD |
1716839 |
1847241 |
1977643 |
2108045 |
2108045 |
|
Depreciation charges, USD |
56156 |
56156 |
56156 |
56156 |
56156 |
|
Material costs, USD |
1163059.7 |
1231475.3 |
1299890.9 |
1368306.5 |
1368306.5 |
|
Total Income, USD |
497623.3 |
559609.7 |
621596.1 |
683582.5 |
683582.5 |
|
Administration services, USD |
9306 |
9306 |
9306 |
9306 |
9306 |
|
Insurance, USD |
515.9 |
515.9 |
515.9 |
515.9 |
515.9 |
|
Production costs, USD |
166689.6 |
166689.6 |
166689.6 |
166689.6 |
166689.6 |
|
Other expenses, USD |
234524.4 |
247737.6 |
260950.8 |
274164 |
274164 |
|
General operating costs, USD |
411035.9 |
424249.1 |
437462.3 |
450675.5 |
450675.5 |
|
Operating income, USD |
86587.4 |
135360.6 |
184133.8 |
232907 |
232907 |
|
Loan interest, USD |
39743 |
32465.4 |
23299.1 |
14131.7 |
4965.4 |
|
Taxes and fees, USD |
0 |
0 |
190778.5 |
200819.3 |
200819.3 |
|
Net Profit, USD |
46844.4 |
102895.2 |
-29943.8 |
17956 |
27122.3 |
|
NCF, USD |
103000.4 |
159051.2 |
26212.2 |
74112 |
83278.3 |
|
DCF (r=18%, USD |
87288.47 |
114228.10 |
15953.55 |
38226.14 |
36401.71 |
|
NPV ps., USD |
-374853.02 |
||||
|
Indicators/Years |
1 |
2 |
3 |
4 |
5 |
|
Production volume (Q), tons |
729.44 |
784.85 |
840.25 |
895.65 |
895.65 |
|
Price per ton, USD |
2847.9 |
2847.9 |
2847.9 |
2847.9 |
2847.9 |
|
Total revenue, USD |
1716839 |
1847241 |
1977643 |
2108045 |
2108045 |
|
Depreciation charges, USD |
56156 |
56156 |
56156 |
56156 |
56156 |
|
Material costs, USD |
951594.3 |
1007570.7 |
1063547.1 |
1119523.5 |
1119523.5 |
|
Total Income, USD |
709088.7 |
783514.3 |
857939.9 |
932365.5 |
932365.5 |
|
Administration services, USD |
7614 |
7614 |
7614 |
7614 |
7614 |
|
Insurance, USD |
422.1 |
422.1 |
422.1 |
422.1 |
422.1 |
|
Production costs, USD |
136382.4 |
136382.4 |
136382.4 |
136382.4 |
136382.4 |
|
Other expenses, USD |
211071.96 |
222963.84 |
234855.72 |
246747.6 |
246747.6 |
|
General operating costs, USD |
355490.46 |
367382.34 |
379274.22 |
391166.1 |
391166.1 |
|
Operating income, USD |
353598.24 |
416131.96 |
478665.68 |
541199.4 |
541199.4 |
|
Loan interest, USD |
32517 |
29514 |
21181 |
12847 |
4514 |
|
Taxes and fees, USD |
0 |
0 |
156091.5 |
164306.7 |
164306.7 |
|
Net Profit, USD |
321081.24 |
386617.96 |
301393.18 |
364045.7 |
372378.7 |
|
NCF, USD |
377237.24 |
442773.96 |
357549.18 |
420201.7 |
428534.7 |
|
DCF (r=18%, USD |
319692.58 |
317993.36 |
217615.47 |
216735.36 |
187316.47 |
|
NPV op., USD |
592402.24 |
||||
Finally, the deviation of the project from the net present value is calculated using the following form
Var(NPV)= 592402.24-(-374853.02)= 967255.26 USD
As soon as the variation width is found, the investor compares it with the maximum and minimum limits set for him and concludes that the project is sustainable.
If the instability of the project is identified, it is recommended to make the following necessary changes to the organizational and economic mechanism of the project:
- Changing the amount or maturity of the debt, for example, the use of a “lightweight” debt repayment schedule;
- Organization of reserves, such as financial reserves, cash reserves and contributions to funds;
- Coordination of the terms of mutual settlements between the project participants;
- Consideration of issues of insurance of project participants from one or another insured event.
If the project remains unstable even with these changes, the project is not accepted for funding as it will be considered ineffective.
In addition, the following methods are used to analyse and assess investment risks: Mathematical methods (standard deviation and variation), Risk-adjusted interest rate method, Decision tree method, Monte Carlo method, and others.
Conclusion
Effective implementation of investment projects in the national economy requires improved methods of project risk assessment and management. To this end, the following conclusions and recommendations have been developed: 1) In investment risk management, methods are selected based on the results of risk analysis and assessment. On the other hand, effective project management leads to the desired result. Therefore, the risk assessment of the project must be thorough and reasonable. 2) The specificity of the risks affecting the project should be taken into account when choosing methods for assessing risks and managing investment projects. In this case, for example, risks are divided into insured and uninsured. Of the uninsured risks, it is preferable to use the method of allocating financial reserves and determine the amount of funds required to cover costs, rather than manage force majeure risks or political risks using the method of insurance and calculating insurance costs. 3) When assessing the risks of investment projects, it is necessary to carry out a comprehensive assessment. Risk assessment requires a comprehensive assessment based not only on a unified assessment method, but also on the integration of objective methods (based on statistical and reporting data) and subjective methods (based on expert opinion), as well as other methods of qualitative and quantitative assessment. In this case, the disadvantage of one method is compensated by the advantage of the second and an impeccable risk assessment is achieved. 4) Methods for assessing risks in the national economy should be based on foreign experience and, in particular, on assessment methods which are used with information and communication technologies. The application of risk management methods based on financial instruments proposed by foreign economists leads to the use of innovative financing mechanisms, advanced and modern management methods.
References
[1] O’zbekiston Respublikasi Prezidenti Shavkat Mirziyoyevning Oliy Majlisga Murojaatnomasi. Toshkent. 28-dekabr, 2018-yil. www.press-service.uz. [2] Investitsiya faoliyati va strategik rivojlanish borasidagi ustuvor vazifalar muhokama qilindi. O’zbekiston Respublikasi Investitsiyalar va tashqi savdo vazirligi huzuridagi xorijiy investitsiyalarni jalb etish agentligi sayti ma’lumoti. https://invest.gov.uz/uz/mediacenter/news/priority-tasks-of-investment-activity-and-strategic-development-were-discussed/. [3] Kuznetsov, B.T. (2015). Investitsii. (Investments). Moscow: UNITI-DANA. p. 663. [4] Ozhegov, S.I., Shvedova, N.Yu. (2006). Tolkovyy Slovar Russkogo Yazyka: 80000 Slov i Frazeologicheskikh Vyrazheniy. (Explanatory Dictionary of the Russian Language: 80,000 Words and Phraseological Expressions). Moscow: A TEMP. 2006. p. 3423. [5] Merriam-Webster’s Dictionary and Thesaurus (2014), Mass-Market Paperback. https://www.merriam-webster.com. Access: 10.03.2021. [6] Junkes, M.B., Tereso, A.P., Afonso, P.S.L.P. (2015). The Importance of Risk Assessment in the Context of Investment Project Management: A Case Study. Retrieved: https://reader.elsevier.com/reader/sd/pii/S1877050915027416?token=EB6136D999AB0F3A8A2B5BE7D8C88AB8A20E13C0FD48A3091928E10DC3E16B610356577EECDB5514AE02767A8A79C9EE . Access: 15.03.2021. Procedia Computer Science 64, pp. 902-910. [7] Vilenskiy, P.L., Livshchits, V.N., Smolyak, S.A. (2008). Otsenka Effektivnosti Investitsionnykh Proyektov: Teoriya i Praktika. (Evaluation of the Effectiveness of Investment Projects: Theory and Practice). Moscow: “Delo” ANKH Publishing House. p.1104. [8] Khominich, I.P. Peshchanskaya, I.V. Upravleniye Finansovymi Riskami. (Financial Risk Management). (2019). Textbook and workshop for undergraduate and graduate programs. Moscow: Urayt Publishing House. 2019. p.345. [9] Crouhy, M., Galai, D., Mark, R. (2006). The United States of America: The McGraw-Hill Companies, Inc. 2006. p. 416. [10] Abdullaeva, Sh.Z. (2002). Bank Risklari va Kreditlash. (Banking Risks and Lending). Tashkent: Moliya. 2002. p.304. [11] Vakhabov, A.V., Xajibakiev, Sh.X., Muminov, N.G. (2010). Khorijiy Investitsiyalar. (Foreign Investments). Tashkent: Moliya. 2002. p.324. [12] Martina Merkova, Josef Drabek. (2015). Use of Risk Analysis in Investment Measurement and Management. (http://toc.proceedings.com/29281webtoc.pdf ). Access: 16.03.2021. Procedia Economics and Finance Volume 34, pp. 656-662. [13] Mamatov, B.S., Khuzhamkulov, D.Yu., Nurbekov, O.Sh. (2014). Investitsiyalarni Tashkil Etish va Moliyalashtirish. (Organisation and Financing of Investments). ?ashkent: IQTISOD-MOLIYA. p. 608. [14] Nosirov, E.I., Mamatov, B.S., Shaislamova, N.K., Sharifkhodjaeva, K.U. (2012). Investitsiya risklarini boshqarish. (Investment risk management). Tashkent: Fan va texnologiya. p. 148.
Copyright
Copyright © 2022 Shaislamova Nargiza Kabilovna. This is an open access article distributed under the Creative Commons Attribution License, which permits unrestricted use, distribution, and reproduction in any medium, provided the original work is properly cited.

Download Paper
Paper Id : IJRASET43925
Publish Date : 2022-06-07
ISSN : 2321-9653
Publisher Name : IJRASET
DOI Link : Click Here
 Submit Paper Online