

Ijraset Journal For Research in Applied Science and Engineering Technology
Can AI replace Human? A Study on Customer Perception and Attitude towards AI-Based Chatbot in Food Service
Authors: Dr. Vikas Saxena, Amardeep Gautam
DOI Link: https://doi.org/10.22214/ijraset.2022.42967
Certificate: View Certificate
Abstract
When interaction comes in digital world means interacting with AI- enabled chatbot, this study focuses on customer perception and attitude to conclude can AI replaced the human? Primary survey was done for collected the customer data, 300 people were targeted out of which 219 responds. The study concludes that customer still prefer human interaction over chatbot even chatbot provides many benefits like quick response, easy to use and convenient to interact at any time. After conclusion there is future scope of this study and some recommendation for food service providers in India.
Introduction
I. INTRODUCTION
Artificial intelligence (AI) is a branch of computer science concerned with building smart machines capable of performing tasks that typically require human intelligence. Since there are advancements in machine learning and deep learning which is creating a shift in every industries sector and handling various types of operations even better than humans. Majority of the repetitive tasks are now replaced with AI which was previously done by humans. This intelligent behaviour can be helpful to replace humans as it can imitate the human behaviour and can do the same work arguably more effectively and efficiently. [1]
A. Chatbot and How it Works
One of the industries that have introduced this technology in their operations is Food service/ Delivery Apps. To replace the Human element in customer support AI is used in the form of Chatbots [1]. A chatbot is a computer program that allows humans to interact with technology using a variety of input methods such as voice, text, gesture and touch [2]. Chatbots attend to customers at all times of the day and week and are not limited by time or a physical location [1].
On a simple level, a human interacts with a chatbot. If voice is used, the chatbot first turns the voice data input into text (using Automatic Speech Recognition (ASR) technology). Text only chatbots such as text-based messaging services skip this step. The chatbot then analyses the text input, considers the best response and delivers that back to the user.
The chatbot’s reply output may be delivered in any number of ways such as written text, voice via Text to Speech (TTS) tools, or perhaps by completing a task.
It’s worth noting that, understanding humans isn’t easy for a machine. The subtle and nuanced way humans communicate is a very complex task to recreate artificially, which is why chatbots use several natural language principles: Natural Language Processing (NLP) Natural Language Processing is used to split the user input into sentences and words. It also standardizes the text through a series of techniques, for example, converting it all to lowercase or correcting spelling mistakes before determining if the word is an adjective or verb – it’s at this stage where other factors such as sentiment are also considered. Natural Language Understanding (NLU) Natural Language Understanding helps the chatbot understand what the user said using both general and domain specific language objects such as lexicons, synonyms and themes. These are then used in conjunction with algorithms or rules to construct dialogue flows that tell the chatbot how to respond. Natural Language Generation (NLG) Delivering a meaningful, personalized experience beyond pre-scripted responses requires natural language generation. This enables the chatbot to interrogate data repositories, including integrated back-end systems and third-party databases, and to use that information in creating a response. Conversational AI technology takes NLP and NLU to the next level. It allows enterprises to create advanced dialogue systems that utilize memory, personal preferences and contextual understanding to deliver a realistic and engaging natural language interface [2].
B. Research Problem
Nowadays, in food delivery app businesses like Zomato, swiggy, chatbots are used to solve customers’ queries or problems, but chatbots are effective in that business model? The target customer of this business model are the people who don’t have time to go outside to take food, they want convenience at their home, or are not ready to take the pain, so their queries should also be solved most conveniently. A chatbot is used to serve the user's request. The chatbot must plan how to perform the task requested by a user. Chatbot responds to each user request by learning from the conversation to what the request is. There is no doubt that machines are much better when it comes to working efficiently but they cannot replace the human connection that customer executive makes with their customers as the customers find the real interaction more reliable and engaging. More questions arise when a chatbot is used, is the customer is satisfied with the chatbot? Is customer trust chatbot for the solution of their problem? Which one do customers prefer between AI-based chatbot interaction and human interaction? Considering all these factors there was a need to understand consumer perception and attitude towards the adoption of AI-based Chatbots by online food services in India.
C. Scope of the Study
This study focusing on the analysis of Consumer perception and attitude towards adoption of AI- based Chatbots by online food service in India. As we all know In India consumer wants to talk directly to the customer executive rather than addressing their problem to the chatbots, if the chatbots doesn’t solve the query of the customer problem and took time to solve the customer problem then it demotivates the customer and customer loses their interest in service. Study will be beneficial for the business models like Zomato, Swiggy, Ubereats, etc. to understand the impact of AI-based chatbot on customers and their preference towards chatbot and plan their marketing strategy accordingly.
D. Objective of the study
- To study consumer perception towards Chatbots
- To interpret the efficiency of chatbots on customer satisfaction
- To identify the customer's trust on chatbots regarding problem-solving.
- To determine what customers, prefer human interaction or AI-based chatbot interaction.
II. LITERATURE REVIEW
- As the world progresses, there will be emerging new technologies that will definitely have an influence upon how consumers look up for products, brands, search for alternate options, make buying decisions and finally the overall customer relationship is also bound to be affected (Libai et al., 2020).
- Newer and fresher technologies are bound to make their way into customer’s life during the upcoming advancement in technologies (Hoyer et. al., 2020).
- There has been quite a many argument upon the consumer might experience due to newer concepts of technologies and the changed perception of customer towards their way of shopping in this world (Ng and Wakenshaw, 2017).
- When using the online services, the retailers can use the concept of the “recommendation agents” when setting up their services as these will help the customer find the item of their choice easily and in less time duration than the traditional way of purchasing (Xiao &Benbasat, 2007).
- There’s more to just finding items retailers can also go beyond and create a fully personalised and unique landing interfaces so that the customer feels connected to the experiences and finds the information relevant to him easily avoiding the unnecessary hassle (Hoyer et. al., 2020).
- When considering the concept of chatbots, they are primarily based upon the text applications and use the words to connect with consumer to solve issues resolve queries, or just to simplify the traceability of the consumer’s order (Dale, 2016).
- Chatbots are great at providing an instant customer support and reply to written questions, they “offer an atomized and cost efficient first-level support” (Backhaus and Awan, 2019). Any organisation’s overall digital maturity has been directly linked as to how much the organisation is resilient against the external disturbing factors like a hack or data loss (Fletcher & Griffiths, 2020).
- When we shift the focus to food industry the section of this industry that uses the technology to their most is the online food delivery services to enhance their customer relations while increasing their productivity (Kimes, 2011) and extending the market to greater newer heights (Yeo et al., 2017).In the food service industry, although a few researchers have addressed but not many research have their focus on how the concept of chatbots is having influence upon this industry.
III. RESEARCH METHODOLOGY
A. Data Collection
Data was collected through primary source. Primary data was collected through survey method. Primary data was collected in the month of March, 2022. A questionnaire (Annexure I) was prepared to get responses. Questionnaire was shared through google form to about 650 respondents. Out of which 219 people responded to the Google form link of the questionnaire. Sample size 219 was studied in this study. The questionnaire consists of two sections: - Section-1 contains demographic profile of the respondents and section-2 contains questions to know perception and attitude of customers towards AI- based chatbot in food services.
A questionnaire consists of different types of questions and includes some short type questions, some multiple choices, and some of them are Likert scale rating questions (ratings between 1 to 5, and 1 to 10). Based upon the responses, tables and charts were prepared to analyze the result.
B. Data Analysis
Collected data was analysed with the help of IBM SPSS statistics. Demographic Data were analysed and displayed in the form of pie charts and graphs, Frequency & measures of central tendency analysis was carried out for those questions which consist behaviour of respondents, Correlation, & Regression were test carried out for predefined Variables (dependent and independent variables)
IV. DATA ANALYSIS AND INTERPRETATION
A. Sample Characteristics (From Demographic profile)
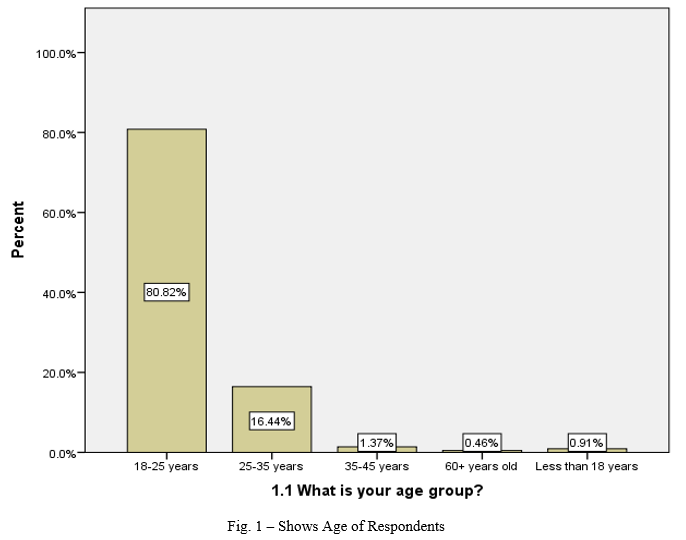
- Around 80.82 % of the respondent’s populations is in the age group of 18-25 years, followed by 16.44% lying in 25-35 age group, 1.37 % lying in 35-45 years, 0.91 % lying in less than 18 years and 0.46 % lying under 60+ year old age group.
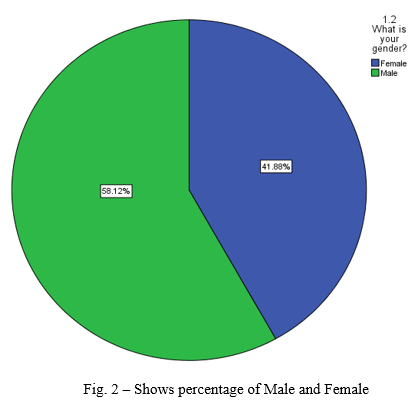
- Out of 219 respondents 41.88% are female and 58.12% are male.
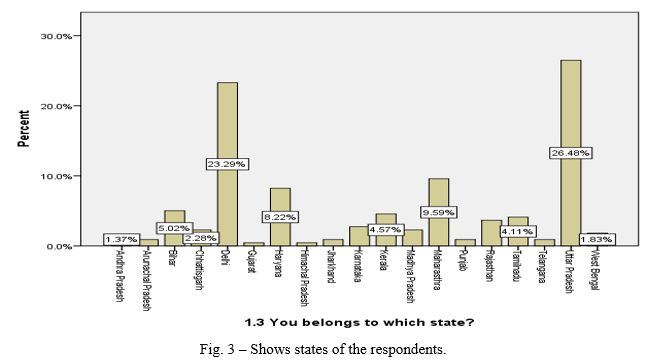
- According to data received, we can conclude that respondents are from all over India.
- Around 26.48% respondents are from Uttar Pradesh followed by Delhi (23.29%), Maharashtra (9.59%), Haryana (8.22%), Bihar (5.02%), Kerala (4.57%) and respondents from other states are also there like from Andhra Pradesh, Arunachal Pradesh, Chhattisgarh, Gujarat, Himachal Pradesh, Jharkhand, Karnataka, Madhya Pradesh, Punjab Rajasthan Tamilnadu, Telangana, and west Bengal.
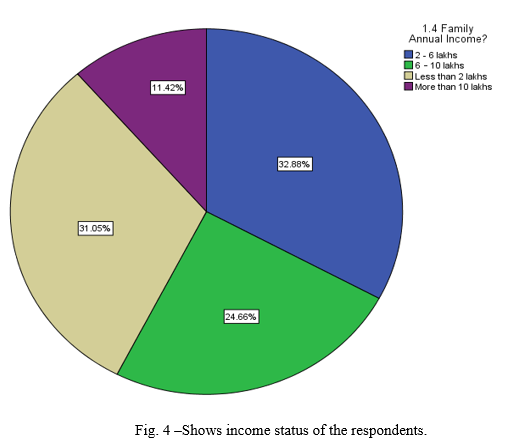
- 32.88% respondents are from the 2-6 Lakhs income per annum, 31.05% respondents come under less than 2 lakhs per annum income group, 24.66% fall into 6-10 lakhs per annum income group and rest 11.42% respondents comes under more than 10lakhs per annum income group.
- So major population belongs to 2-6 lakhs income source means comes under middle class family status.
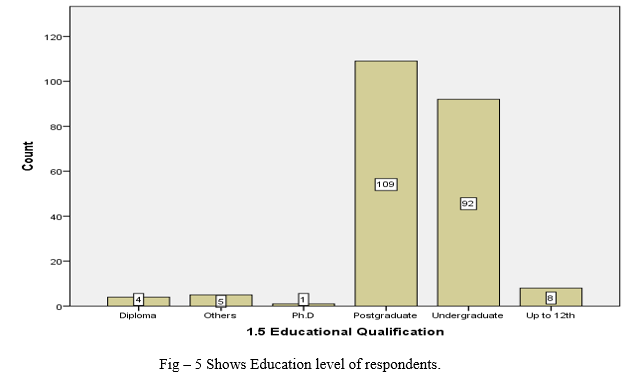
- Most of the respondents having post graduation qualification, followed by under graduate qualification and around 8 respondents are having only up to 12th qualification, 4 respondents are from diploma and 1 respondent have a doctorate degree and 5 respondents are having qualification other than options available.
B. Studying Customer behaviour towards chatbot.
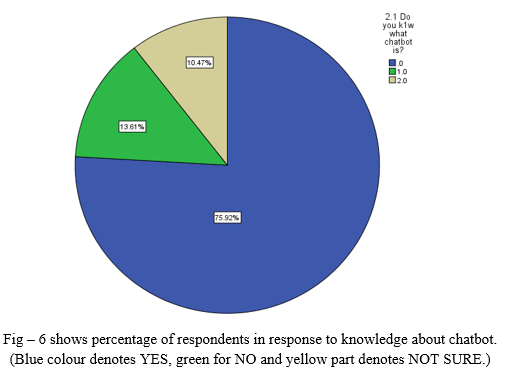
- In this question we would like to know whether our audience are aware about chatbot or not.
- Around 72.92% respondents know about chatbot and around 13.61% respondents are not sure whether they know about chatbot. 10.47% respondents don’t know about chatbot.
- By observing data statistics, we can conclude that most of people in India have knowledge about chatbot.
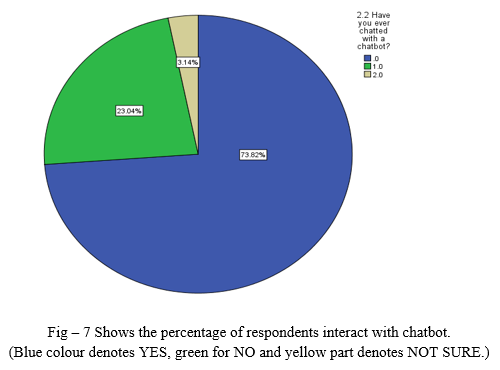
- In this question, we would like to know whether respondents have interacted with chatbot or not.
- In respondents only 73.82% people chatted with a chatbot and 3.14% respondents are not sure whether they are engaging with chatbot or not.
- Major portion of data has been interacted with chatbot. And few persons are not aware whether they are interacted with a chatbot or not.
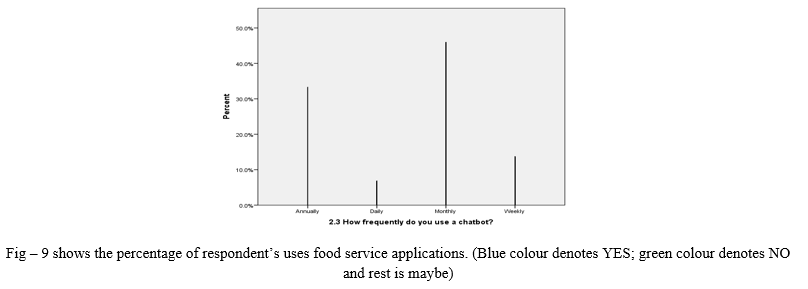
- Most of the respondents used chatbot monthly or annually and some are weekly and few uses chatbot on daily basis.
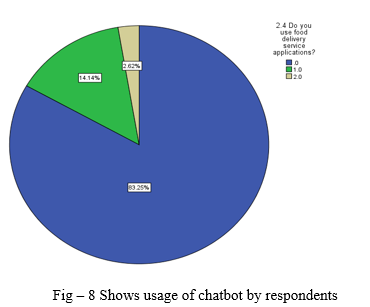
- Our focus is on food delivery service applications with chatbot, this question is getting to know how many people uses food applications, around 82.5% respondents are using food applications with 2.62% respondents who are not sure that they are using or not
|
2.5 Do you ever raise a complaint on chatbot? |
|||||
|
|
Frequency |
Percent |
Valid Percent |
Cumulative Percent |
|
|
Valid |
.0 |
123 |
55.9 |
56.2 |
56.2 |
|
1.0 |
96 |
43.6 |
43.8 |
100.0 |
|
|
Total |
219 |
99.5 |
100.0 |
|
|
|
Missing |
System |
1 |
.5 |
|
|
|
Total |
220 |
100.0 |
|
|
|
Table 1- represents responses against do you ever raise a complaint on chatbot? where .0 represents YES and 1.0 represents NO.
- In this question our motive is know that peoples have ever raised a complaint on chatbot or not.
- Out of 219 respondents 55.9% (123) respondents raised a complaint on chatbot.
|
2.6 How much time does the chatbot take to answer the problem? |
|||||
|
|
Frequency |
Percent |
Valid Percent |
Cumulative Percent |
|
|
Valid |
|
1 |
.5 |
.5 |
.5 |
|
0-30 seconds |
107 |
48.6 |
48.6 |
49.1 |
|
|
1 min – 2 minutes |
12 |
5.5 |
5.5 |
54.5 |
|
|
30 seconds - 1 minute |
74 |
33.6 |
33.6 |
88.2 |
|
|
More than 2 minutes |
26 |
11.8 |
11.8 |
100.0 |
|
|
Total |
220 |
100.0 |
100.0 |
|
|
Table 2- Shows how much time a chatbot take to answer a problem.
- Motive of this question is to know how much time a chatbot take time to answer a problem based on the customer experience.
- Out of 219 respondents 107 says that a chatbot take around 0-30 seconds to answer a problem followed by 74 respondents says it take around 30 seconds to 1 minute to answer.
- So according to our responses we can conclude that chatbot takes less time to answer a problem.
|
2.7 How satisfied or dissatisfied are you with the chatbot? |
|||||
|
|
Frequency |
Percent |
Valid Percent |
Cumulative Percent |
|
|
Valid |
|
1 |
.5 |
.5 |
.5 |
|
Dissatisfied |
14 |
6.4 |
6.4 |
6.8 |
|
|
Neither satisfied nor dissatisfied |
95 |
43.2 |
43.2 |
50.0 |
|
|
Satisfied |
89 |
40.5 |
40.5 |
90.5 |
|
|
Very dissatisfied |
2 |
.9 |
.9 |
91.4 |
|
|
Very satisfied |
19 |
8.6 |
8.6 |
100.0 |
|
|
Total |
220 |
100.0 |
100.0 |
|
|
Table 3- shows the satisfaction level of customer with chatbot.
- In this question our focus is to know how many people are satisfied or dissatisfied with chatbot.
- Around 43.2% respondents are neither satisfied nor dissatisfied with the chatbot service and only 40.5% respondents are satisfied. Around 6.4% people are dissatisfied, and only 8.6% people are very satisfied with chatbot service.
- So according to data we can conclude that satisfied population is less as compared to those who don’t even know whether they are satisfied or not but satisfied population is high in comparison with dissatisfied people.
|
2.8 Trust on chatbot? (Rate on a scale of 5, 1 is for highly distrusted, 5 is for highly trusted and 3 is for neutral) |
|||||
|
|
Frequency |
Percent |
Valid Percent |
Cumulative Percent |
|
|
Valid |
1.0 |
6 |
2.7 |
2.7 |
2.7 |
|
2.0 |
25 |
11.4 |
11.4 |
14.2 |
|
|
3.0 |
99 |
45.0 |
45.2 |
59.4 |
|
|
4.0 |
61 |
27.7 |
27.9 |
87.2 |
|
|
5.0 |
28 |
12.7 |
12.8 |
100.0 |
|
|
Total |
219 |
99.5 |
100.0 |
|
|
|
Missing |
System |
1 |
.5 |
|
|
|
Total |
220 |
100.0 |
|
|
|
Table 4- shows trust level on chatbot.
- Focus of this question is to know about trust level of respondents with chatbot on a Likert scale rating (1-5, where 1 is for highly distrusted and 5 is for highly trusted).
- Out of 219 respondents, 99 people are neutral about chatbot while 61 respondents have trust on chatbot, and 25 people are not trust on chatbot for their problem.
- According to data in table, trusted people are less in comparison with neutral people, but more in comparison with distrusted.
|
2.9 Your preference for interaction? |
|||||
|
|
Frequency |
Percent |
Valid Percent |
Cumulative Percent |
|
|
Valid |
.0 |
179 |
81.4 |
81.7 |
81.7 |
|
1.0 |
40 |
18.2 |
18.3 |
100.0 |
|
|
Total |
219 |
99.5 |
100.0 |
|
|
|
Missing |
System |
1 |
.5 |
|
|
|
Total |
220 |
100.0 |
|
|
|
Table 5- Shows preference of interaction where .0 denotes Human customer executive and 1.0 denotes AI- based chatbot.
- This knows is to know the customer preference for interaction for their problem.
- Around 179 respondents want to interact with human customer executive, only 40 respondents out of 219 respondents prefer AI-Based chatbot for interaction.
- Observation is that whether chatbot gives quick answer or easy to use but customer wants to interact with human customer executive for their problem.
Question number 10 of questionnaire contains few statements on which respondents have to choose number from 1.0 – 5.0. Where-
- 1.0 represents that respondent is strongly agree with the statements
- 2.0 represents that respondent is agree with statement
- 3.0 represents that respondent is neutral with statement
- 4.0 represents that respondent is disagree with statement
- 5.0 represents that respondents is strongly disagree with statement
|
2.10 how much agree or disagree are you with below statements. . [Chatbots are risky in terms of data security and privacy] |
|||||
|
|
Frequency |
Percent |
Valid Percent |
Cumulative Percent |
|
|
Valid |
1.0 |
40 |
18.2 |
18.3 |
18.3 |
|
2.0 |
75 |
34.1 |
34.2 |
52.5 |
|
|
3.0 |
70 |
31.8 |
32.0 |
84.5 |
|
|
4.0 |
23 |
10.5 |
10.5 |
95.0 |
|
|
5.0 |
11 |
5.0 |
5.0 |
100.0 |
|
|
Total |
219 |
99.5 |
100.0 |
|
|
|
Missing |
System |
1 |
.5 |
|
|
|
Total |
220 |
100.0 |
|
|
|
Table 6- represents the response against “chatbot’s are risky in terms of data security and privacy”.
- Around 75 respondents are agreed with the statement that chatbot’s are risky in terms of data security and privacy while 40 respondents are strongly agreed for the same and 70 respondents are neutral, Approx 15% of our respondents are disagree to this statement.
|
2.10 how much agree or disagree are you with below statements. [Chatbot has the capability of understanding problem] |
|||||
|
|
Frequency |
Percent |
Valid Percent |
Cumulative Percent |
|
|
Valid |
1.0 |
28 |
12.7 |
12.8 |
12.8 |
|
2.0 |
64 |
29.1 |
29.2 |
42.0 |
|
|
3.0 |
79 |
35.9 |
36.1 |
78.1 |
|
|
4.0 |
35 |
15.9 |
16.0 |
94.1 |
|
|
5.0 |
13 |
5.9 |
5.9 |
100.0 |
|
|
Total |
219 |
99.5 |
100.0 |
|
|
|
Missing |
System |
1 |
.5 |
|
|
|
Total |
220 |
100.0 |
|
|
|
Table 7- represents the response against “Chatbot has the capability of understanding problem”.
- 64 respondents out of 219 respondents are agree with the statement “chatbot has the capability of understanding problems, 35 respondents are disagreeing for the same while 28 and 13 respondents are strongly agreeing and disagree. But most of the respondents are neutral to this statement means they are not agreeing nor disagree.
|
2.10 how much agree or disagree are you with below statements. [Chatbots help in engagement in customer service] |
|||||
|
|
Frequency |
Percent |
Valid Percent |
Cumulative Percent |
|
|
Valid |
1.0 |
31 |
14.1 |
14.2 |
14.2 |
|
2.0 |
124 |
56.4 |
56.6 |
70.8 |
|
|
3.0 |
57 |
25.9 |
26.0 |
96.8 |
|
|
4.0 |
6 |
2.7 |
2.7 |
99.5 |
|
|
5.0 |
1 |
.5 |
.5 |
100.0 |
|
|
Total |
219 |
99.5 |
100.0 |
|
|
|
Missing |
System |
1 |
.5 |
|
|
|
Total |
220 |
100.0 |
|
|
|
Table 8- represents the response against “Chatbots help in engagement in customer service”
- Around 70% of the respondents are in the category of strongly agree and disagree and around 25% are neutral for this statement, only 5 % respondents are disagreed to this statement.
|
2.10 how much agree or disagree are you with below statements. [Chatbot can be considered as the future of customer service] |
|||||
|
|
Frequency |
Percent |
Valid Percent |
Cumulative Percent |
|
|
Valid |
1.0 |
36 |
16.4 |
16.4 |
16.4 |
|
2.0 |
85 |
38.6 |
38.8 |
55.3 |
|
|
3.0 |
63 |
28.6 |
28.8 |
84.0 |
|
|
4.0 |
27 |
12.3 |
12.3 |
96.3 |
|
|
5.0 |
8 |
3.6 |
3.7 |
100.0 |
|
|
Total |
219 |
99.5 |
100.0 |
|
|
|
Missing |
System |
1 |
.5 |
|
|
|
Total |
220 |
100.0 |
|
|
|
Table 9 - represents the response against “Chatbot can be considered as the future of customer service”
- Around 40% of the respondents are agree to this statement that chatbot can be considered as the future customer service support. While approx. 13% respondents are disagree to this statement only.
|
Correlations |
|||
|
|
2.5 Do you ever raise a complaint on chatbot? |
2.7 How Satisfied or Dissatisfied are you with the chatbot? |
|
|
2.5 Do you ever raise a complaint on chatbot? |
Pearson Correlation |
1 |
-.014 |
|
Sig. (2-tailed) |
|
.832 |
|
|
N |
219 |
219 |
|
|
2.7 How Satisfied or Dissatisfied are you with the chatbot? |
Pearson Correlation |
-.014 |
1 |
|
Sig. (2-tailed) |
.832 |
|
|
|
N |
219 |
219 |
|
Table 10 – Correlation between complaint raised by respondents and satisfaction level of respondents.
- Motive of this correlation is to determine whether there is a correlation in between complaint raised by customer and how much customer is satisfied or dissatisfied.
- According to analysis, the P- value is more than 0.01, the test is not significant. There is not a significant relationship between these two variables.
|
Correlations |
|||
|
|
2.8 Trust on chatbot? |
2.10 Chatbot has the capability of understanding problem |
|
|
2.8 Trust on chatbot? |
Pearson Correlation |
1 |
-.341** |
|
Sig. (2-tailed) |
|
.000 |
|
|
N |
219 |
219 |
|
|
2.10 Chatbot has the capability of understanding problem |
Pearson Correlation |
-.341** |
1 |
|
Sig. (2-tailed) |
.000 |
|
|
|
N |
219 |
219 |
|
|
**. Correlation is significant at the 0.01 level (2-tailed). |
|||
|
Table 11 - Correlation between Trust on chatbot and chatbot has the capability of understanding problem.
|
|||
|
Correlations |
|||
|
|
2.10 Chatbots help in engagement in customer service |
2.10 Chatbot can be considered as the future of customer service |
|
|
2.10 Chatbots help in engagement in customer service |
Pearson Correlation |
1 |
.369** |
|
Sig. (2-tailed) |
|
.000 |
|
|
N |
219 |
219 |
|
|
2.10 Chatbot can be considered as the future of customer service |
Pearson Correlation |
.369** |
1 |
|
Sig. (2-tailed) |
.000 |
|
|
|
N |
219 |
219 |
|
|
Table 12 – Correlation between Chatbots help in engagement in customer service and Chatbot can be considered as the future of customer service.
|
|||
Conclusion
According to the data collected and analysed we can conclude that most of the AI chatbot users are youth and literate belongs to all over India. Customers are well aware about Chatbot technology and uses it in their lifestyle. Chatbot takes less time to provide the solution of customer problems and customer says it is easy to interact with Chatbot and it can understand there problem not all but it can, and they have trust on chatbot that it will give easy and quick solution to their problem. But as we know everything has its pros and cons, meanwhile even though chatbot provide easy and quick response customer still wants to interact with Human customer executive and think chatbot can be risky for them in terms of their data security. After analysing all the results, the conclusion is that chatbot is efficient and effective in terms of time saving and quick response, even customers have trust on it for their problem solution, have the capability of understanding problem and chatbot can be the future of customer service but still customer prefer human to interact related to their problem. A. Limitation 1) The responses obtained from the survey are subject to various types of biasness. 2) The respondents are discrete samples from few cities of different states and hence, the study doesn’t give us a true picture of the overall population. 3) The analytical tools used have their own respective limitations in interpretation of the data which may not give more precise outcomes. 4) Focus of this study uses of chatbot only in food service, no other business models. B. Future Scope This study was conducted only in Indian users and the chatbot service is available in India, as we can see from our data Indian people are not much aware about AI enabled chatbot and their application yet but in reference to this in future this study may be carried out in global level for a better picture of customer trust and satisfaction with the chatbots applications. C. Recommendations 1) As we can see customers still prefer human touch for their problem even chatbot provides many benefits, so companies should teach people about technology to users, also introduce a human touch to their customer service. 2) The companies should not rely only on chatbot for critical problems human executive should be there. 3) Chatbot can be useful and more usable when companies get enough data of the customer queries, and this can be done by with the help of machine learning concept to increase the efficiency and problem-solving capability of chatbot.
References
[1] Dr. Amisha Gupta, Himanshu Gupta, Vaibhav Rathore, Suyash Awasthi, Harshdeep Singh, Impact of Chatbots on Customer Satisfaction in Food Delivery Apps (www.ijsrd.com) [2] Chatbots: The definitive guide, by Artificial Solutions (www.artificial-solutions.com) [3] Libai, B., Bart, Y., Gensler, S., Hofacker, C., Kaplan, A., &Kötterheinrich, K. (2020). Brave new world? On AI and the management of customer relationships. Journal of Interactive Marketing forthcoming. [4] Wayne D. Hoyer, Mirja Kroschke, Bernd Schmitt, Karsten Kraume, Venkatesh, Shankar (2020), Transforming the Customer Experience Through New Technologies, https://doi.org/10.1016/j.intmar.2020.04.001 [5] Ng, I. C. L., & Wakenshaw, S. Y. L. (2017). The internet-of-things: Review andresearch directions. International Journal of Research in Marketing, 34(1),3–21. [6] Xiao, B., &Benbasat, I. (2007). E-commerce productrecommendation agents: Use, characteristics, and impact. MIS Quarterly,31(1), 137–209. [7] Dale, R., 2016. The return of the chatbots. Nat. Lang. Eng. 22 (5), 811–817. https://doi.org/10.1017/S1351324916000243 [8] Backhaus K., Awan A. (2019) The Paradigm Shift in Customer Analysis: Marketing or IT-Driven?. In: Bergener K., Räckers M., Stein A. (eds) The Art of Structuring. Springer, Cham. https://doi.org/10.1007/978-3-030-06234-7_32 [9] Fletcher, G., & Griffiths, M. (2020).Digital transformation during a lockdown.International Journal of Information Management, (55), 102185.https://doi.org/10.1016/j.ijinfomgt.2020.102185. Published by Elsevier Ltd
Copyright
Copyright © 2022 Dr. Vikas Saxena, Amardeep Gautam. This is an open access article distributed under the Creative Commons Attribution License, which permits unrestricted use, distribution, and reproduction in any medium, provided the original work is properly cited.

Download Paper
Paper Id : IJRASET42967
Publish Date : 2022-05-20
ISSN : 2321-9653
Publisher Name : IJRASET
DOI Link : Click Here
 Submit Paper Online