

Ijraset Journal For Research in Applied Science and Engineering Technology
A Study on Effects of Saturation on Soil Subgrade Strength
Authors: Ripunjay Kumar Sharma, N Manoj Kumar
DOI Link: https://doi.org/10.22214/ijraset.2022.44424
Certificate: View Certificate
Abstract
The design of the pavement layers to be laid over sub grade soil starts off with the estimation of sub grade strength and the volume of traffic to be carried. Design of the various pavement layers are very much dependent on the strength of the sub grade soil over which they are going to be laid. Sub grade strength is mostly expressed in terms of CBR (California Bearing Ratio). Weaker sub grade essentially requires thicker layers whereas stronger sub grade goes well with thinner pavement layers. The sub grade is always subjected to change in saturation level due to precipitation, capillary action, flood or abrupt rise or subtidal of water table. Change in moisture level in sub grade causes change in the sub grade strength. And it becomes quite essential for an engineer to understand the exact nature of dependence of sub grade strength on moisture variation. An understanding of the dependence of the CBR strength of local soils on water content will contribute towards better design and maintenance practices. Normally CBR test is an easy and well adopted method conducted on soil samples to measure the strength of sub grade. However, many other tests are also considered for assessing the sub grade strength. The strength of soil, used for sub grade may vary largely on the amount of saturation in it, i.e. Amount of water exposed to the soil. Hence, in this study an attempt has been made to vary the degree of soaking and hence the saturation level in various types of soils and study the engineering properties of soils including CBR at different saturation levels. It is observed that for coarse grained soil, worst engineering properties are observed after three days of soaking and for fine grained soils, the same is found at the end of four days.
Introduction
I. INTRODUCTION
A. Subgrade
The crust of a pavement, whether flexible or rigid, rests on a soil foundation on an embankment or cutting, normally known as subgrade. Subgrade can be defined as a compacted layer, generally of naturally occurring local soil, assumed to be 500/300 mm in thickness, just beneath the pavement crust, providing a suitable foundation for the pavement. The subgrade in embankment is compacted in two layers, usually to a higher standard than the lower part of the embankment .The soil in subgrade is normally stressed to certain minimum level of stresses due to the traffic loads and the subgrade soil should be of good quality and appropriately compacted so as to utilize its full strength to withstand the stresses due to traffic loads. This leads to economization of the overall pavement thickness. On the other hand, the subgrade soil is characterized for its strength for the purpose of analysis and design of pavement.
B. California Bearing Ratio Test
The California Bearing Ratio Test (CBR Test) is a penetration test developed by California State Highway Department (U.S.A.) for evaluating the bearing capacity of subgrade soil. The CBR test was first introduced or developed by O.J. Porter at California Highway Department in 1920.
It is otherwise called as load-deformation test which is conducted in the laboratory or in the fields and these results are generally used to find the thickness of pavement layers, base course and other layers of a given traffic loading by the use of empirical design chart. Initially it practiced for the design of surfaced and un-surfaced airfields which is still based upon CBR today. The CBR determines the thickness of different elements constituting the pavement. The CBR test is the ratio of force per unit area required to penetrate soil mass by a circular plunger of 50mm at the rate of 1.25mm/min. Observations are carried out between the load resistances (penetration) vs. plunger penetration. The California bearing ratio, CBR is expressed as the ratio of the load resistance (test load) of a given soil sample to the standard load at 2.5mm or 5mm penetration, expressed in percentage.
CBR = (Test load/Standard load) ×100
II. OBJECTIVE
To Perform A Study On Effects Of Saturation On Soilsubgrade Strength
III. REVIEW OF LITERATURE
A. Effect Of Moisture Variation On CBR
Alayaki and Bajomo (2011) examined the effect of moisture variation on the strength characteristics of laterite soil in Abeokuta, Ogun State, Nigeria. The result showed that an increase in the soaking period of the compacted soil sample from 1to 5 days result in decrease in the CBR of the soil. He observed that the top face of the soaking soil has a CBR value greater than that at the bottom face. Jaleel (2011) studied the effect of soaking on the top and bottom CBR value of a sub-base material. He prepared fourteen CBR samples at 95% relative modified AASHTO compaction. The results showed that, a significant drop in the CBR for top and bottom due to the soaking was observed. Most of decrease in soaking CBR value was pronounced in the first days for top and
bottom CBR, respectively. From the results of the testing conducted in this study on the effect of soaking period on top and bottom subbase for highway purpose, he concluded that the load applied on the subbase layer decreases with increase of period soaking.
Ampadu (2006) examined the effect of water content on the CBR of a subgrade soil samples of soil from a study site were prepared by laboratory compaction at the optimum water content using different levels of compaction to obtain samples at different densities. The remoulded samples were then subjected to different levels of wetting in a water tank and different degrees of drying in the laboratory and the CBR value were determined. From the laboratory CBR test results on a subgrade material at different water contents for three different dry densities, it may be concluded that the rate of change in CBR per percentage change in water content during drying from the OMC was 3 to 7 times larger than during wetting from OMC.Singh et al.(2011) developed regression-based models for estimating soaking and unsoaking California Bearing Ratio (CBR) values for fine-grained subgrade soils .Five locally available soils were collected from different zones of West Bengal. The samples were compacted at four different levels of compaction (i.e.,50, 56, 65, and 75 blows) and at five different levels of moisture contents on dry and wet sides of an optimum moisture content (OMC) of a soil Regression models were developed considering different independent parameters namely, index properties of soils, degree of compaction, and moisture content. It was observed that the CBR value, both soaking and unsoaking significantly affected by change in moisture content and compaction effort. Ningsih et al. (2012) studied correlation between index properties and CBR tests of Pekanbaru (Indonesia)soils with and without soaking. This research aims to make comparisons between CBR soaking test results for CBR un-soaking in some variation of clay content and make simple comparisons between CBR soaking for CBR unsoaking by considering the soil properties. The results showed that there was a linear correlation between the CBR soaking and CBR unsoaking also influenced by the nature of the index (the properties of the soil).
Rahman (2010) studied the correlation between CBR results and physical properties of soil. Correlation had been proposed in the study to predict the CBR values at top face of the soil sample for Malaysia’s type of soil based on the collected soil data and results from laboratory works. These correlations were developed based on the Maximum dry density (MDD), Optimum moisture content (OMC) and the number of blows (of CBR test). Hussain (2008) correlated between CBR value and Undrained Shear Strength from Vane Shear Test. Several soil samples with different Plasticity Index and moisture content were compacted and tested using CBR test and Vane Shear test to obtain the data to establish the correlation. He found that CBR value and Undrained shear strength increases with increase of Plastic index. CBR value and Undrained shear strength from Vane shear test of soil samples are inversely
proportional with the moisture content.
Cokca et al. (2003) studied the effects of compaction moisture content on the shear strength of an unsaturated clay. In this study, the effects of compaction moisture content and soaking on the unsaturated shear strength parameters of clay were investigated. Experiments were done on samples compacted at optimum moisture content, on the dry side of optimum and on the wet side of optimum. He found that angle of friction decreases rapidly with increasing moisture contents, the cohesion component of shear strength attains its peak value at around optimum Moisture content and then decreases.
Yasinet al. studied the Effect of Submergence on Subgrade Strength. His study aimed at determining the effects of depth of submergence and duration of submergence on the subgrade strength of soil samples collected from the Dhaka-Aricha highway. CBR tests were performed with different heights of submergence after normal soaking period and also after prolonged
submergence. For the studied depth and duration of submergence, no effect of submergence on sub-grade CBR strength could be found for any of the three types of soils tested.
Razouki et al. (2003) examined Long–term soaking effect on strength and deformation characteristics of a gypsiferous subgrade soil. The behaviour during long-term soaking of the California Bearing Ratio (CBR), the resilient modulus and the deformation of compacted Iraqi gypsiferous soil containing about 34% gypsum was studied. Sixteen (CBR) samples compacted at optimum moisture content and 95% of the maximum dry density of the modified AASHTO compaction test were prepared. The paper reveals that a soaking period of four days can lead to misleading and unsafe results regarding strength, stiffness and deformation of gypsiferous soils.
B. Effect Of Moisture Variation On Direct Shear Test
Kim (2011) studied the variation of shear strength of weathered granite soil with water content. This study investigates the effects of initial water content and disturbance on the strength reduction for both disturbed and undisturbed samples of weathered granite soil in Korea using direct shear test. He found out that cohesion and friction angle of weathered granite soils linearly decrease with an increase in degree of saturation.
Blazejczak et al. (1995) investigated the effect of soil water conditions and soil compaction on the age hardening process of loamy sand and silty loamy sand in relation to the tensile strength. At intervals after moulding, the tensile strengths of the moist samples were measured with the indirect tension test. High water content had a negative effect on the tensile strength of soil at constant bulk density. High bulk density, however, had a positive effect on tensile strength at constant water content. when the combination is arranged down the lighter fraction evaporates. owing to issues with pollution from the volatile organic compounds within the lighter fraction, cut-back asphalt has been for the most part replaced by asphalt emulsion.
IV. METHODOLOGY AND EXPERIMENTAL INVESTIGATIONS
A. Introduction
The entire study has been conducted on three types of soil, i.e. 1. Clayey Soil (from Bonai, Sundergarh District), 2. Clayey soil (from Rajgangpur, Sundergarh District) and 3. Red Moorum Soil (from NIT Rourkela campus). Initially experiments were conducted to find out different properties of soil such as index properties, grain size distribution and differential free swell index. Later on, heavy compaction tests were conducted to find out the optimum moisture content & corresponding maximum dry density. Then CBR tests were made at different moisture contents including OMC and analysis made to investigate the variation of CBR with respect to different days of soaking, i.e. from unsoaked (day 0) to soaked (day 5). The variations were also made with regard to moisture content at different layers along with different positions (east, west, north, south, center positions) and also the variations of moisture content with respect to different days of soaking were observed. Direct Shear Test was also conducted on the soil samples.
B. Experimental Investigations
Soils are classified with different engineering properties which affect the behavior of soil under different conditions. These properties are described briefly here.
- Liquid Limit: The liquid limit (LL) is the water content at which a soil changes from plastic to liquid behavior. At this limit, the soil possesses a small value of shear strength, losing its ability to flow as a liquid. In other words, the liquid limit is the minimum moisture content at which the soil tends to flow as a liquid.
- Plastic Limit: Plastic limit (PL) is the arbitrary limit of water content at which the soil tends to pass from the plastic state to the semi-solid state of consistency. Thus, this is the minimum water content, at which the change in shape of the soil is accompanied by visible cracks, i.e., when worked upon, the soil crumbles.
- Plasticity Index: Plasticity Index (PI) is the range of water content within which the soil exhibits plastic properties, that is, it is the difference between liquid and plastic limits. Plasticity Index (IP ) = Liquid Limit(WL) -Plastic Limit (WP)
- Differential Free Swell: Free Swell Index is the increase in volume of a soil, without any external constraints, on submergence in water.
Where, Vd = volume of soil specimen read from the graduated cylinder containing distilled water.
Vk = volume of soil specimen read from the graduated cylinder containing kerosene.
Specific Gravity
Specific gravity of soil solids is defined as the ratio of unit weight of solids to the unit weight of water at the standard temperature.
Sieve Analysis
About 1kg of soil was taken and it was washed thoroughly with water on 75-micron sieve, soil retained on sieve was dried and weighed and used for sieve analysis.
Modified Proctor Test
The Proctor compaction test is a laboratory method of experimentally determining the optimal moisture content at which a given soil type will become most dense and achieve its maximum dry density. The term Proctor is in honor of R. R. Proctor, who in 1933 showed that the dry density of a soil for a given compactive effort depends on the amount of water the soil contains during soil compaction. His original test is most commonly referred to as the standard Proctor
compaction test; later on, his test was updated to create the modified Proctor compaction test.
California Bearing Ratio Test
The CBR is a measure of resistance of a material to penetration of standard plunger under controlled density and moisture conditions. The test procedure should be strictly adhered if high degree of reproducibility is desired. The CBR test may be conducted in re-molded or undisturbed specimens in the laboratory. The test has been extensively investigated for field correlation of flexible pavement thickness requirement. Briefly, the test consists of causing a cylindrical plunger of 50mm diameter to penetrate a pavement component material at 1.25mm/minute. The loads, for 2.5mm and 5mm are recorded. This load is expressed as a percentage of standard load value at a respective deformation level to obtain CBR value.
Direct Shear Test:
A direct shear test is a laboratory or field test used by geotechnical engineers to measure the shear strength properties of soil or rock material, or of discontinuities in soil or rock masses. Stabilizing additives are employed in the mixture to stop mortar drain down and to supply higher binding. Fibres unremarkably used now-a days are polypropene, polyester, mineral and polyose. The main helpful additives employed in mixes is classified in to totally different groups; Ø Fibres (Cellulose Fibres, Mineral Fibres, Chemical Fibres) Ø Polymer Ø Powder and flour like materials (Silicic acid, Special Filler) Ø Plastics (Polymer Powders or Pellets).
V. RESULTS AND DISCUSSIONS
The index properties such as Liquid limit, Plastic limit, Plasticity Index value are presented in Table4.1 as follows:
Index properties of type – 1 soil
|
Index property |
Experimental Value |
|
Liquid Limit |
55.29% |
|
Plastic Limit |
34.04% |
|
Plasticity Index |
21.25% |
|
Specific Gravity |
2.65 |
|
Differential Swell Index |
57% |
A. Particle Size Distribution
The grain size distribution of this soil sample has been shown in Table 4.2.
Grain size distribution of type - 1 soil
|
I.S Sieve no. |
Weight retained in gm |
Percentage Weight retained |
Percentage weight passing |
|
4.75mm |
4.6 |
0.46 |
99.54 |
|
2mm |
14.5 |
1.45 |
98.09 |
|
1mm |
20.2 |
2.02 |
96.07 |
|
0.6mm |
5 |
0.5 |
95.57 |
|
0.425mm |
9.8 |
0.98 |
94.59 |
|
0.3mm |
5.1 |
0.51 |
94.08 |
|
.212mm |
21.1 |
2.11 |
91.17 |
|
.015mm |
15.6 |
1.56 |
90.41 |
|
0.075mm |
30.49 |
3.049 |
87.361 |
B. Moisture Variation In Soil Sample
Attempts have been made to take soil samples from various parts of a CBR sample for determination of moisture content, as per the schematic diagram given in Figure 4.8. Middle layer is almost in the middle of the sample (vertical level). The top and bottom layers are about 15 cm from the top and bottom of a sample respectively. The east and west for each layer (horizontal) indicate towards left and right side of the sample respectively, while north and south represent samples away and towards the observer respectively.
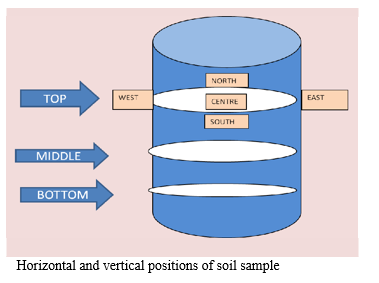
Horizontal and vertical positions of soil sample
Moisture content for test – 1, type – 1 soil for soaked (day - 5) condition
|
Vertical Positions |
MOISTURE CONTENTS% |
||||
|
Horizontal Positions |
|||||
|
EAST |
WEST |
NORTH |
SOUTH |
CENTRE |
|
|
TOP |
28.18 |
26.25 |
26.25 |
25.68 |
25.55 |
|
MIDDLE |
24.43 |
22.96 |
22.39 |
21.87 |
23.09 |
|
BOTTOM |
22.39 |
19.40 |
20..75 |
21.74 |
20.61 |
Moisture content for test- 1, type – 1 soil for soaked (day - 1) condition
|
Vertical Positions |
MOISTURE CONTENTS% |
||||
|
Horizontal Positions |
|||||
|
EAST |
WEST |
NORTH |
SOUTH |
CENTRE |
|
|
TOP |
16.93 |
17.52 |
17.74 |
18.90 |
18.64 |
|
MIDDLE |
16.77 |
16.56 |
16.65 |
16.50 |
16.70 |
|
BOTTOM |
16.62 |
17.80 |
15.65 |
16.49 |
16.73 |
Moisture content for test – 1, type – 1 soil for soaked (day - 3) condition
|
Vertical Positions |
MOISTURE CONTENTS% |
||||
|
Horizontal Positions |
|||||
|
EAST |
WEST |
NORTH |
SOUTH |
CENTRE |
|
|
TOP |
24.52 |
24.28 |
24.78 |
24.88 |
23.98 |
|
MIDDLE |
19.70 |
20.03 |
20.44 |
20.88 |
19.63 |
|
BOTTOM |
17.75 |
17.86 |
18.33 |
17.78 |
18.72 |
Moisture content for test – 1, Type – 1 soil for soaked (day - 4) condition
|
Vertical Positions |
MOISTURE CONTENTS% |
||||
|
Horizontal Positions |
|||||
|
EAST |
WEST |
NORTH |
SOUTH |
CENTRE |
|
|
TOP |
25.52 |
24.97 |
24.60 |
24.67 |
25.40 |
|
MIDDLE |
19.33 |
20.94 |
21.43 |
22.75 |
22.7 |
|
BOTTOM |
20.64 |
19.57 |
19.82 |
20.22 |
21.84 |
C. CBR Values of Soil
CBR values of first type of soil
|
Compaction Conditions(M.C&D.D) |
CBR(%) |
|||||
|
|
DAYS OF SOAKING |
|||||
|
0 |
1 |
2 |
3 |
4 |
5 |
|
|
OMC &MDD (14.8,1.85) |
35.39 |
3.57 |
2.9 |
2.67 |
2.5 |
1.13 |
|
98% Density(dry side) (12.46,1.82) |
31.77 |
2.6 |
1.96 |
1.87 |
1.56 |
0.9 |
|
98% Density(wet side) (16.25,1.82) |
33.05 |
2.12 |
2.08 |
1.95 |
1.78 |
1.12 |
|
97% Density(dry side) (10.7,1.794) |
32.45 |
2.02 |
1.83 |
1.74 |
1.67 |
0.7 |
|
97% Density(wet side) (17.8,1.794) |
34.33 |
2.07 |
1.93 |
1.88 |
1.76 |
0.6 |
CBR values of third type of soil
|
Compaction Conditions (O.M.C & D.D) |
CBR (%) |
|||||
|
|
DAYS OF SOAKING |
|||||
|
0 |
1 |
2 |
3 |
4 |
5 |
|
|
OMC & MDD (10.83%,2.15gm/cc) |
72.64 |
44.27 |
29.68 |
21.35 |
20.31 |
19.55 |
|
98% Density (wet side)(12%,2.107gm/cc) |
44.58 |
30.96 |
23.43 |
20.73 |
15.08 |
14.04 |
|
98% Density (dry side) (8%,2.107gm/cc) |
49.43 |
38.93 |
28.23 |
19.28 |
14.65 |
13.31 |
|
97% Density (Wet side) (12.5%,2.08gm/cc) |
38.65 |
26.54 |
22.77 |
18.47 |
12.49 |
10.08 |
|
97% Density (dry side) (7.5%,2.08gm/cc) |
34.23 |
20.33 |
15.98 |
13.72 |
8.85 |
8.28 |
From the above tests and results for the three type of soils , it has been found that for the first and second type of soil the decrease in strength (CBR Value) is quite similar. There is a sudden decrease in CBR from unsoaked condition to that with one day soaking. But there is no significant variation of CBR from third to fourth day of soaking. It has been observed that higher moisture contents result at top layers than compared to that in lower layers. Rate of decrease in CBR value for third type of soil is less. Effect of varying days of soaking does not affect much to third type of soil.
CBR values of first type of soil
|
Compaction Conditions(M.C&D.D) |
CBR(%) |
||||||
|
|
DAYS OF SOAKING |
||||||
|
0 |
1 |
2 |
3 |
4 |
5 |
||
|
OMC &MDD (16.4,1.85) |
48 |
2.9 |
2.2 |
1.9 |
1.6 |
1.5 |
|
|
98% Density (wet side) (17.8,1.8) |
37.47 |
2.22 |
1.97 |
1.82 |
1.59 |
1.26 |
|
|
98% Density (dry side) (12.89,1.8) |
35.03 |
1.98 |
1.87 |
1.82 |
1.77 |
1.54 |
|
|
97% Density (wet side) (19,1.78) |
34.62 |
2.88 |
1.6 |
1.5 |
1.11 |
0.97 |
|
|
97%Density(dry side) (12.2,1.78) |
30.46 |
3.90 |
2.31 |
2.10 |
2.00 |
1.92 |
|
D. Index Properties
The results of index properties such as Liquid limit, Plastic limit, Plasticity Index value are presented in as follows:
Index properties of type- 1 soil
|
Description of index property |
Experimental Value |
|
Liquid Limit |
28.18% |
|
Plastic Limit |
18.18% |
|
Plasticity Index |
10% |
|
Specific Gravity |
2.73 |
|
Differential Swell Index |
10% |
E. Particle size Distribution
The grain size distribution of this soil sample has been shown in Table
Grain size distribution of type - 2soil
|
I.S Sieve no. |
Weight retained in gm |
Percentage Weight |
Percentage weight |
|
4.75mm |
169 |
16.9 |
83.1 |
|
2mm |
208.6 |
20.86 |
62.24 |
|
1mm |
151.7 |
15.17 |
47.07 |
|
0.6mm |
47.3 |
4.73 |
42.34 |
|
0.425mm |
23.6 |
2.36 |
39.98 |
|
0.3mm |
15.9 |
1.59 |
38.39 |
|
.212mm |
26.6 |
2.66 |
35.73 |
|
.015mm |
10.8 |
1.08 |
34.65 |
|
0.075mm |
30.9 |
3.09 |
31.56 |
F. Moisture Variation In Soil Sample
Moisture content for test – 1, type – 2 soil for soaked (day - 1) condition
|
Vertical Positions |
MOISTURE CONTENTS% |
||||
|
Horizontal Positions |
|||||
|
EAST |
WEST |
NORTH |
SOUTH |
CENTRE |
|
|
TOP |
11.50 |
12.13 |
11.48 |
11.49 |
11.90 |
|
MIDDLE |
11.08 |
11.36 |
11.57 |
10.77 |
10.87 |
|
BOTTOM |
10.58 |
11.23 |
10.58 |
10.83 |
11.25 |
Moisture content for test – 1, type – 3 soil for soaked (day - 2) condition
|
Vertical Positions |
MOISTURE CONTENTS% |
||||
|
Horizontal Positions |
|||||
|
EAST |
WEST |
NORTH |
SOUTH |
CENTRE |
|
|
TOP |
13.47 |
12.40 |
12.69 |
12.20 |
12.37 |
|
BOTTOM |
11.24 |
11.94 |
10.84 |
9.68 |
11.25 |
Moisture content for test – 1, type – 2soil for soaked (day - 3) condition
|
Vertical Positions |
MOISTURE CONTENTS% |
||||
|
Horizontal Positions |
|||||
|
EAST |
WEST |
NORTH |
SOUTH |
CENTRE |
|
|
TOP |
13.16 |
13.68 |
1.347 |
13.82 |
14.11 |
|
MIDDLE |
12.23 |
12.96 |
12.62 |
12.28 |
12.22 |
|
BOTTOM |
11.12 |
10.69 |
11.58 |
11.47 |
10.39 |
Moisture content for test – 1, type – 2 soil for soaked (day - 4) condition
|
Vertical Positions |
MOISTURE CONTENTS% |
||||
|
Horizontal Positions |
|||||
|
EAST |
WEST |
NORTH |
SOUTH |
CENTRE |
|
|
TOP |
13.59 |
14.25 |
13.79 |
14.84 |
14.09 |
|
MIDDLE |
13.18 |
12.94 |
12.54 |
13.39 |
13.03 |
|
BOTTOM |
12.69 |
12.5 |
12.58 |
13.04 |
12.64 |
Conclusion
A. Conclusions An attempt has been made in this project work to explore the effect of saturation, i.e. Soaking on the strength properties of subgrade soil, namely CBR which is widely used as a measure of design of all types of pavements. For these three types of soils have been considered. The effect of soaking on degree of saturation on different parts of the soil sample have also been considered in this study. From the results and discussions presented earlier, following conclusions are drawn: 1) It is observed that the CBR value of the given clayey soil sample with BIS classification “OH” prepared at a particular density decreases rapidly with time of soaking up to 1day after which the rate of decrease is small. While the CBR value reduces by about 20 times compared to the unsoaked conditions, the loss of CBR value in 4 days is about half compared to that after 1 day. It is also observed that there are not much significant variations in CBR values from 3rd day to 4th day of soaking. When soil samples are taken from different points of the CBR sample and tested for its moisture content, it is also observed that their variations in moisture content in a given layer are not significant in unsoaked conditions and 1 day of soaking. However, it is observed that for a longer soaking time, higher moisture contents result at top layer compared to that in the lower layers. 2) For the 2nd type of soil considered and found to be of “CI” classification, the trend is almost similar to the first type of soil used. 3) For the 3rd type of soil classified as ‘GM’, the rate of decrease of strength is very less. Although there is decrease in CBR value with increase in number of days of soaking but the rate of decrease is not as much as in 1st type and 2nd type of soil considered. 4) For 1st type and 2nd type of soil wet side of Optimum Moisture Content (CBR values) gives better results than that dry side. However, this trend was not observed 3rd type soil. 5) It has been observed that as usual with decrease in degree of compaction (either on wet or dry side) cohesion and angle of friction decreases. B. Future Scope of Work 1) Other engineering properties such as direct shear, unconfined compression and triaxial test should also be considered for different levels of saturation. 2) Effect of stabilization with weak (clayey) soil on engineering properties at different levels of saturation needs to be explored. 3) The considerations on engineering properties as stated above may be applied to a variety of soils, so that a database may be prepared to justify the period of soaking of a soil for deciding the CBR value or any such engineering property that may be used for pavement design.
Copyright
Copyright © 2022 Ripunjay Kumar Sharma, N Manoj Kumar. This is an open access article distributed under the Creative Commons Attribution License, which permits unrestricted use, distribution, and reproduction in any medium, provided the original work is properly cited.

Download Paper
Paper Id : IJRASET44424
Publish Date : 2022-06-17
ISSN : 2321-9653
Publisher Name : IJRASET
DOI Link : Click Here
 Submit Paper Online