

Ijraset Journal For Research in Applied Science and Engineering Technology
Taxi Demand Prediction using ML
Authors: Dr. A. Venkata Ramana, Asiya Batool, Manisha Ramavath , Pindrathi Viveka
DOI Link: https://doi.org/10.22214/ijraset.2022.43912
Certificate: View Certificate
Abstract
Taxi plays a crucial role in transportation especially in urban areas.Predicting the future demand for taxis in particular geographical location will greatly help internet based transportation companies like Ola, Uber etc. So that we can drastically decrease the waiting time of customers/passengers and also it helps taxi drivers to move to particular location where demand is high eventually making passengers,drivers and companies happy. In this Project we like to predict the demand for taxi in particular location for next 10 min using previous time series data .we want to perform this task of regression using machine learning models with high accuracy and then we would like to apply deep learning models and compare the results.we like to propose the best suited and high accuracy model for the problem.It will greatly help companies in managing the taxi fleet in cities.
Introduction
I. INTRODUCTION
These days commuting has become essential for all the people in cities to reach their destinations from present location.Taxi is one of the important modes of transport in ur- ban areas.So it has become a large scale business for many internet based companies like Uber,Ola.But these companies and cab drivers are facing some major problems.Searching for a passenger is one of the most important challenges for all cab drivers.
If taxi driver spends more time in reaching a new passenger, then fuel consumption will be high and the lesser number of passengers will be transported. As an inexperienced cab driver, we generally don’t know where to pick-up a new customer as we don’t have proper infor- mation about the demand of taxi over time and location.
This information regarding taxi demand in the future can be used to navigate both inexperienced and experienced taxi drivers to the areas where there is high demand in the city faster. So it helps to meet the demand with the supply for taxi services in the urban areas.
This prediction of de- mand is challenging because it depends on many parameters. Suddenly there would be hike in demand due to rain in that particular location,there may be events like cricket matches, music concerts any religious meetings. These events also leads to sudden increase in demand for taxi in that area. Generally we rely on manual work but it is not sufficient. So we want better regression based machine learning and deep learning algorithms.
II. OBJECTIVE
- To collect the data which is suitable for our problem statement.
- To preprocess the data collected.
- To select appropriate machine learning and deep learning algorithms.
- To prepare a predictive regression models by training it with the collected data set.
- By comparing the different models we will select the best model to predict the taxi demand which helps the taxi drivers.
III. LITERATURE REVIEW
Different surveys were performed on the twitter datasets.
- Jun Xu, R Rahmatizade, Ladislau B [?] [1] :- As these people observed two major scenarios which are : (Scenario 1) excessive number of vacant vehicles and exces- sive competition among them and (Scenario 2) more passenger waiting times and lower taxi reliability. Here they mainly focused over scenario 1 as they found many solutions for second scenario. In order to get solution for this they used time series forecasting techniques which are performed on dataset from one large sized taxi network which has 63 taxi stands and 441 taxies running on Porto city, Portugal (Scenario 1). According to their report they were able to achieved 76percentage of accuracy.
- Bin Li , Daqing Zhang , Lin Sun , Chao Chen ,Shijian Li , Guande Qi , Qiang Yang [3]:-In this paper, They found best(efficient) and worst(inefficient) passenger finding strategies based on GPS dataset, which was taken from China city from 5350 taxis for an year. In order to perform ML techniques on dataset they represented data by triplet (Time, Location, Strategy). Here they mainly focused on the behaviour of drivers based on time and location and here they used beautiful tool in order to perform these strategies is L1-Norm SVM, to select the most salient patterns in order to divide top- and ordinary-performance taxis. They find the selected patterns reveal interesting hidden “facts” and can well interpret the empirical study results derived from raw data analysis. Performing this they are able to achieve a prediction accuracy of 85.3 percentage on new test dataset.
- Jun Xu , Rouhollah Rahmatizadeh , Ladislau Bol¨oni , Damla Turgut [4] :- They proposed sequence learning model based on mixture density networks(MDN) and recurrent neural networks(RNN) to predict taxi demand in different areas of a city.Through the learning from previous taxi demand patterns, the proposed LSTM- MDN model which is able to predict taxi demand for entire city. They trained their model with3.5 years of New York City taxi trips. These model results show that the LSTM-MDN model can produce an accuracy of nearly 83percentage at the city level. They further extend the LSTM-MDN model to a conditional model in which each prediction is just not only made based on past information of taxis, but also on current demands in other places. In addition, they showed that their models outperform two other prediction models based on naive statistic average and fully connected feed-forward neural networks.
IV. THEORETICAL BACKGROUND
A. Exploratory Data Analysis
EDA is an analysing our data using simple tools from statistics, from linear algebra,from simple plotting tools and other techniques.So we need to understand what is the data set is before we apply actual machine learning model.But this is extremely important stage,for any given problem first thing we actually do is exploratory data analysis.This is called Exploratory because we don’t know anything about the data set when we start.we are trying to understand what the data set actually is.1.Plotting Tools 2. Cleaning data 3.Data preparation 4.Apply models
B. Proposed Algorithms/Models
- Moving Average :The moving average is a statistical method used for forecasting long-term trends. The technique represents taking an average of a set of numbers in a given range while moving the range
- Weighted Moving Average: Weighted Moving Average puts more weight on recent data and less on past data. This is done by multiplying each bar's price by a weighting factor. Because of its unique calculation, WMA will follow prices more closely than a corresponding Simple Moving Average.
- Exponential Moving Average:Exponential Moving Average is a type of Moving Average, which applies more weight to the most recent data points than those which happened in past. In other words, it is like giving more importance to the last experience or memories than to older ones, assuming those are represented by data points.
- Linear Regression : Simple linear regression is useful for finding relationship between two continuous variables. One is predictor or independent variable and other is response or dependent variable. Itlooks for statistical relationship but not deterministic relationship. Relationship between two variables is said to be deterministic if one variable can be accurately expressed by the other. For example, using temperature in degree Celsius it is possible to accurately predict Fahrenheit. Statistical relationship is not accurate in determining the relationship between two variables. For example, relationship between height and weight.
- Random forest : Here in Random Forest ,Decision Trees are the base models used.The word random comes because we are doing a random bootstrap sampling and the forest comes because of group of trees present in decision trees.Random Forest = Decision Trees(base models) + bagging + Column Sampling + Aggre- gation.These Decision trees should be of reasonable depth. Random Forest is super powerful algorithm which works well in many real-world cases.
- XGboost : The term ‘Boosting’ refers to a family of algorithms which converts weak learners to strong learners. Boosting is an ensemble method for improving the model predictions of any given learning algorithm. The goal of boosting is to reduce bias.
- LSTM : Long Short Term Memory generally termed as LSTMs .This is a special type of RNN.LSTM deals very well with both long term and short term dependencies.Need for LSTM Simple RNN cannot take care of long term dependencies(if a later output depends a lot on earlier inputs). So Simple RNN failed terribly for tasks like machine translation(converting text from one language to another).Then in the year 1997 people came up with the idea of LSTM(Long Short Term Memory).
???????C. Proposed Work
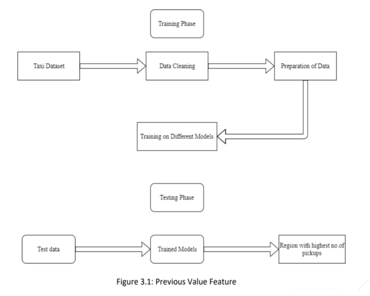
The block diagram of the proposed framework is as shown in Figure. The data is taken from the data set and it undergoes cleaning process where we remove the outliers and also perform some exploratory data analysis to get insights of the data and its attributes. Then the cleaned data is given as input to data preparation step where we make the city into clusters/regions
of almost equal sizes and assign a cluster id and we also create time bins of 10 min’s interval which makes us easy to predict the cluster with maximum no.of pickups given cluster id and the time interval. Then after preparing data we give this prepared data to different algorithms as input for training. The models are then tested with test data to calculate the accuracy and later we try to improve the results. At last we select the model with best accuracy to predict the new data so as to get the required rresult.
???????D. Working Steps
- Data set
a. Creating Own data set by modifying the old dataset: The above given data set is having latitudes and longitudes of New York city, but we wanted to make it localized. So, we modified the existing latitudes and longitudes of New York city to Surat city.We considered the valid bounding box with latitudes and longitudes as (21.08136,72.71) and (21.4216,73.1596) so hence any coordinates not within these coordinates are not con-sidered by us as we are only concerned with pickups which originate within Surat.
b. Training and Test Data set : In this project, the data set used for training the model is 70 percent of the total data set and the remaining 30 percent is considered as testing data set.
2. Data cleaning
An important and initial task is to develop a clean, understandable and reliable data set so that efficient data is available for extracting patterns. Data cleaning for this project includes Univariate analysis and outlier removal.
- We remove outliers based on pick-up latitudes and pick-up longitudes.
- We remove outliers based on drop-off latitudes and drop-up longitudes.
- We convert given time format to Unix timestamp and perform univariate analysis for trip duration and remove outliers based on trip duration .
- We perform univariate analysis remove outliers based on speed.
- We perform univariate analysis remove outliers based on trip distance.
- We perform univariate analysis remove outliers based on fare.
a. Pickup Latitude and Pickup Longitude: The latitude and longitude bounding box is roughly between two location coordinates. Therefore, any coordinate that are not within bounding box are not considered as pickups. Here “Folium” package is used to plot some of these coordinates. Folium package is used for better visualization and understanding of what exactly happens here.
b. Dropoff Latitude and Dropoff Longitude : explained in the above feature, the drop-off latitudes and longitudes that are not within the bounding box are not considered.
c. Trip Duration: Trip Duration is nothing but the total time between pickup time and drop off time.In general, Trip Duration = Drop off time - pickup time.
d. Speed: The next interesting feature that we can compute is the speed. We can get trip speed by dividing trip-distance with trip-time and multiplying it with 60. Now let’s check if there are any outliers or unwanted values for trip speeds.
e. Trip Distance: The next feature is the trip distance which can be computed by taking the difference from starting point and ending point.
f. Total Fare: To understand total fare, we have plotted the box plot. The thing that we observed from the box plot is that the 25th, 50th, 75th percentiles are very close. There are also some bunch of outliers.We then looked into the percentile values and observed that 90th percentile value is 25.8 and the 100th percentile value is extremely large. We again analysed the data between 90th percentile and 100th percentile. The individual percentile values are shown in the figure above. We observed that the 99th percentile value is 66.13 which is also reasonable. So, we further analysed the percentile value between 99th and 100th percentiles.
3. Data Preperation
After cleaning the data set we applied K-means on cleaned data set in order to get clusters. So we tried different number of clusters for choosing better K.Here we need to choose number of clusters so that, there are more number of cluster regions that are close to any cluster centre and make sure that the minimum inter cluster should not be very less.
4. Base Line Models Implementation
We applied Simple Moving Average, Weighted Moving Average and Exponential Moving Average. Then we compared the results of these three models based on MAPE (Mean Absolute Percentage Error) and MSE (Mean Squared Error).
???????E. Linear Regression
For linear regression and tree based models, we need to divide the data into training and testing data and we should not do that randomly as it is a time series data. Since we have data of jan, feb and march months we divided jan,feb data for training and March data for testing. As seen in some base models we don’t take ratio values to predict as their accuracy is slightly lower when compared to models using previous values to predict the output at time We took time t 1,t 2,t 3,t 4,t 5 and t from exponential moving average model and also we took week day attribute, latitude, longitude, f 1,a 1,f 2,a 2 ,f 5,a 5(frequencies and am- plitudes)and we prepared the data frame with 10 features .we applied Simple Linear Regression model and observed the following results.
???????F. Random Forest
Since we divided the data earlier, we used the same data frame which we created for linear regression and we applied Random Forest Regressor on the data frame and we got the following results.
???????G. XGBOOST
In previous model it could not minimised hing losses where as XG-Boost algorithm can minimise all types of losses until it’s loss function is differentiable.
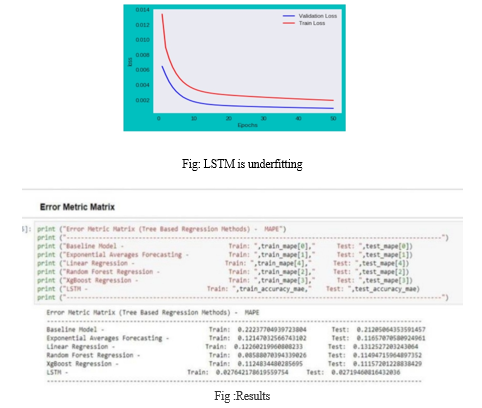
???????H. LSTM
In order to check that neural networks works for this problem. When ever we thought of neural network and time series data the first model we struck in our minds is RNN. So,here we used LSTM on this data set but after applying this LSTM we found that LSTM is under fitting.
 ???????
Conclusion
From the above observation we can conclude that XG-Boost is performing well when compared with other even through we saw LSTM is giving less MAPE but it is under- fitting. A. Future Work Even we can perform other regression models on some or all attributes(features) of data frame and we can perform hyper parameter tuning so, we may or may not achieve best results.
References
[1] Jun Xu, Rouhollah Rahmatizadeh, Ladislau Bol oni and Damla Turgut. ”Real-time Prediction of Taxi Demand Using Recurrent Neural Networks”, IEEE, 2017 [2] Ioulia Markoua *, Filipe Rodriguesa , Francisco C. Pereiraa Multi-step ahead prediction of taxi demand using time-series and textual data”, IEEE,2018. [3] Daqing Zhang, Nan Li, Zhi-Hua Zhou, Chao Chen†, Lin Sun, Shijian Li ”: Detecting Anomalous Taxi Trajectories from GPS Traces”,IEEE,2011. [4] Ukrish Vanichrujee, Teerayut Horanont, Wasan Pattara-atikom, Thanaruk Theer munkong, Takahiro S ”Taxi Demand Prediction using Ensemble Model Based on RNNs and XGBOOST”, IEEE,2018. [5] Juntao Wang , Xiaolong Su ”An Improved K-Means Algorithm”, IEEE,2018. [6] N. J. Yuan, Y. Zheng, L. Zhang, X. Xie, ”T-finder: A recommender system for finding passengers and vacant taxis”, IEEE,2013
Copyright
Copyright © 2022 Dr. A. Venkata Ramana, Asiya Batool, Manisha Ramavath , Pindrathi Viveka. This is an open access article distributed under the Creative Commons Attribution License, which permits unrestricted use, distribution, and reproduction in any medium, provided the original work is properly cited.

Download Paper
Paper Id : IJRASET43912
Publish Date : 2022-06-07
ISSN : 2321-9653
Publisher Name : IJRASET
DOI Link : Click Here
 Submit Paper Online