

Ijraset Journal For Research in Applied Science and Engineering Technology
User Segmentation of Ecommerce
Authors: K. Niranjan, Y. Vasanth, K. Sathwik
DOI Link: https://doi.org/10.22214/ijraset.2023.48782
Certificate: View Certificate
Abstract
The emergence of many competitors and entrepreneurs created a lot of excitement as companies competed to find new buyers and retain old ones. As a result of its predecessor, , the need for excellent customer service became relevant regardless of the size of the company. Additionally, each company\'s ability to understand the needs of each of its customers provides better customer support in its targeted delivery of his customer service and the development of customized customer service plans. This understanding is possible through \'s structured customer service. Each segment has customers with the same market characteristics. Big data ideas and machine learning have made automated customer segmentation approaches more widely accepted than traditional market analysis, which often fails on large customer bases. In this paper, the k-means clustering algorithm is used for this purpose. The Sklearn library was developed for the k-means algorithm (described in the appendix) , and the program is trained on his two-factor dataset of 100 samples obtained from a retail store. Characteristics of average purchasers and monthly average customers.
Introduction
I. INTRODUCTION
Over the years, increased competition among companies and the availability of extensive historical data have led to the widespread use of data mining techniques to find important and strategic information hidden in company information. became. Data mining is the process of extracting logical information from data sets and presenting it in an understandable way to support decision making. Data Mining Techniques distinguishes areas such as Statistics, Artificial Intelligence, Machine Learning, and Data Systems . Data mining applications include, but are not limited to, bioinformatics, weather forecasting, fraud detection, financial analysis, and customer segmentation. The key to this document is the identification of commercial enterprise customer segments using data mining techniques. Customer segmentation is a grouping of a business customer base called customer segments, each customer segment containing customers who share the same market characteristics. These differences are based on factors that directly or indirectly affect the market or business, such as: B. Product preferences or expectations, location, behavior, etc. The importance of customer segmentation includes, but is not limited to, a company's ability to customize market plans suitable for each segment of customers. Supporting business decisions in high-risk environments, such as customer credit relationships. Identify the products associated with individual components and how supply and demand are managed. It becomes clear that the interdependencies and interactions between consumers, between products, or between customers and products may be unknown to the business. Ability to predict customer rejection, predict which customers are likely to have problems, and provide clues to finding solutions.
II. LITERATURE REVIEW MATERIALS AND METHODOLOGY
A. Customer Classification
Over the years, the world of business has become more competitive as such organizations must meet the needs and desires of their customers, acquire new customers and improve their businesses. Identifying and meeting the needs and requirements of each customer within the company is a very difficult task. This is because customers can differ based on their needs, desires, demographics, size, preferences, characteristics, etc. As it stands, treating all customers equally at store is a bad practice. The challenge employs the concept of customer segmentation or market segmentation. In this concept, consumers are divided into subgroups or segments, with members of each subcategory sharing similar market behaviors or characteristics. Customer segmentation is therefore the process of dividing the market into native groups.
B. Big Data
Recently, big data research is gaining momentum. Definition of Big Data – A term that describes large amounts of formal and informal data that cannot be analyzed by traditional methods and algorithms.
Businesses collect billions of data about their customers, suppliers, and operations, and millions of interconnected sensors are turned into real-world devices such as mobile phones, cars, sensors, and manufacturing and communications data. sent to the world. Ability to improve forecasting, save money, increase efficiency, and improve various areas such as traffic control, weather forecasting, disaster prevention, finance, fraud prevention, commerce, national security, education, and healthcare. Big data is primarily seen in three Vs: volume, volatility, and velocity. Other 2V available - authenticity and price so 5V.
C. Data Repository
Data collection is the process of gathering and measuring information about targeted changes in an established system that allows relevant questions to be answered and results to be evaluated. Data collection is part of research in all of his study areas, including natural sciences, social sciences, humanities and economics. The purpose of all data collection is to obtain high-quality evidence that facilitates the analysis that builds concrete and misleading answers to questions. Collected data from , the UCI machine learning repository
D. Clustering Data
Clustering is the process of grouping information in a data set based on approximately similarities. There are several algorithms scalar library.that can be applied to records based on the provided condition . However, there is no universal clustering algorithm, so choosing the right clustering method is important. In this article, we implemented three clustering algorithms using the Python
E. K-mean
The K-means algorithm is one of the most popular classification algorithms. This clustering algorithm is based on Centro, where each data point is placed in one of duplicates pre-sorted with the K algorithm. Clusters are created that correspond to hidden patterns in the data, providing the information needed to assist in making execution decisions. process. There are many ways to configure K-Means, but we will use the elbow method.
F. Methodology
The data used in this document was collected from the UCI Machine Learning repository. This is a set of geographic data containing all transactions made with unregistered and unregistered brokers in the UK between 1st January 2010 and 12th September 2011. The company mainly sells unique gifts at one time. Many of the company's customers are owners of his shop. The database has eight attributes. These features are:
"Invoice: Invoice number. By default, a six-digit total number is assigned to each transaction individually. If this code begins with the letter 'c', it indicates that is void."
“Stock Code Code: Product (Item). name. A 5-digit number assigned only to individual his products. “
"Definition: Product name (item). By name."
"Price: Price for each product (item). Number."
"Unit Price: The price is for 1 unit. Price, product price per unit. "
"Customer: Customer number. Name, her 5 digit number for each customer. "
Country: Country name. Name, the name of the country in which each customer resides. In this white paper, we took several steps to get accurate results. It contains the most common stage k-means algorithm, Feature with Centros initial stage, allocation stage and update stage.
G. Data Collection
This is the data preparation phase. This function typically refines all data elements at a standard rate of and is useful for improving the performance of clustering algorithms. Each data point varies from order 2 to +2. Integration methods including min-max, decimal, and -z-point are the default z-signature strategies used to make things uneven before the dataset algorithm applies the k-means algorithm.
H. Methods Of Customer Classification
There are various methods of partitioning, differing in severity, data requirements, and purpose. Below are some of the most commonly used methods, but this is not an incomplete list. There are articles describing artificial neural networks, particle determination, and complex type ensembles, but they are not included due to limited exposure to .
I may cover some of these options in future articles, but for now these general methods will suffice. Subsequent sections of this article provide basic descriptions of the methods and code examples of the methods used. Skip the code if you don't have expertise. You should familiarize yourself with the in each of the four subsections of this article.
I. K-Means Encounter
The K-Means Clustering Algorithm is a commonly used algorithm for understanding forms and differences in databases. Marketing often uses it to build customer segments and understand the behavior of these unique segments. Let's create a assembly model in the Python environment.
J. Centroid Initiation
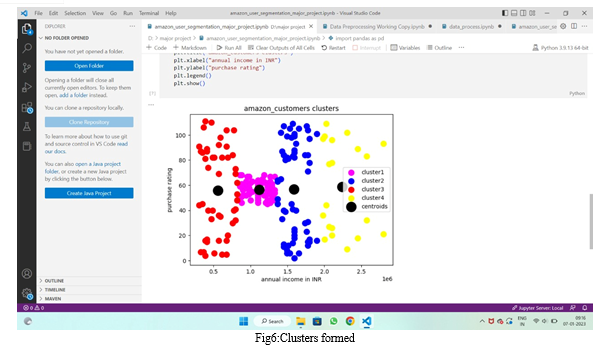
Selected cents or initials selected. Figure 1 represents the beginning of graduate centers. Four selected centers shown at different sizes were selected using the Forgi method. Forgy's method randomly selects data points using k (in this case k=4) as the centroid of the clusters.
K. Technical Introduction
The code below was written in the Jupiter manual using Python 3.x and some Python packages to manipulate, process, analyze and visualize information. Most of the following code is from his GitHub package for the book Hands-on Data Science for Marketing. This book is available from Amazon or Oil Reilly. The open source data costs used in the code below are from Irwin's Machine Learning Repository.
III. MODELING AND ANALYSIS
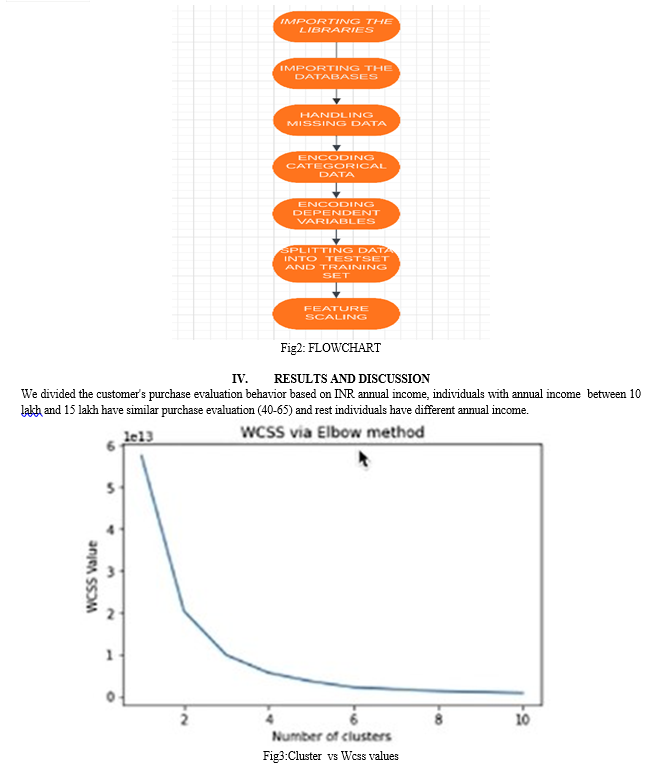
- Importing Packages: First,we need to import the packages to perform analysis and the excel spreadsheet where our data is present.
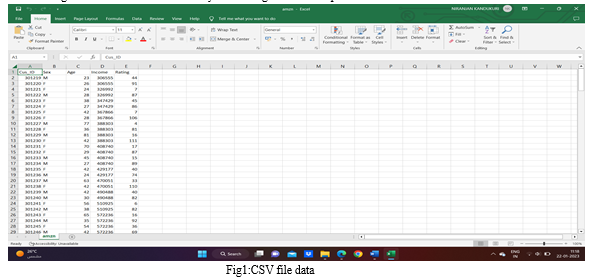
- Data cleaning: Data which we are having should be clean and should be in a organizing form to perform actions.The data we are using is at csv file ,csv means comma separated values file which contains the data on which we are performing our analysis.
- Handling Missing Data: If our dataset has any missing data,may leads to problems so it should be handled.We have different ways like deleting that row, calculating the mean.
- Importing Dataset: The dataset we are using is present in xlxs file so to use that data we need to import it by using read_csv() function.
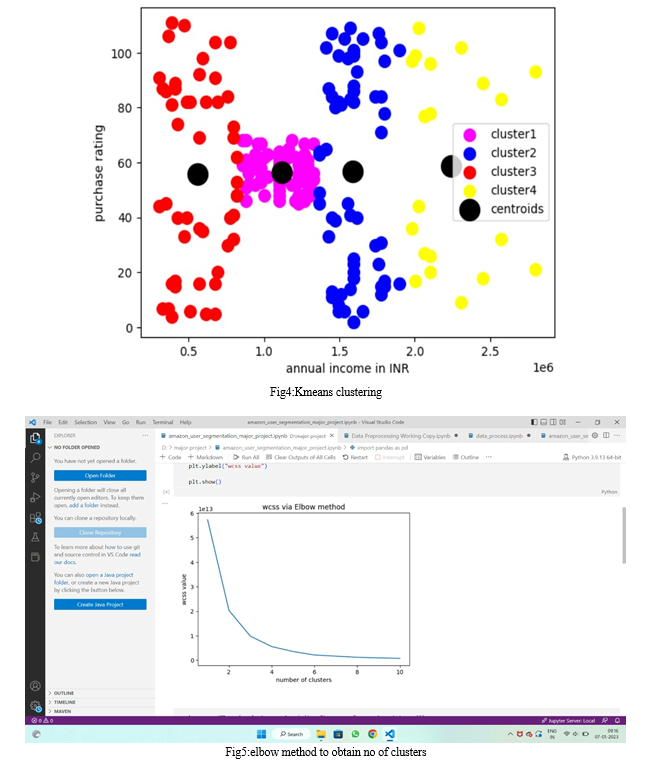
- Selecting No Of Groups: To perform cluster analysis we need to find out how many groups it should have to select no of groups we are using elbow method which works by calculating the sum of squared errors.
Conclusion
Because our dataset is unbalanced, in this paper we have chosen an inner clustering validation rather than an external clustering validation that relies on external data such as labels. You can use internal cluster validation to choose the best clustering algorithm for your data set. And vice versa, you can correctly group data in clusters. Customer segmentation, if done properly, can have a positive impact on your business. You can offer special discounts and gift certificates to people with orange clusters to keep them longer. He can also advertise his hot-selling products by offering discounts to attract them. green clusters, you can organize the feedback column to find out what you can change to attract them. Based on the information above, we found the Jumbo Bag Red Retrospect to be the most expensive team\'s best-selling item. You can use this available information to make recommendations to other potential customers in this section.
References
[1] T. Mimura, S. Hiyamizu, T. Fujii, and K. Nanbu, “A new field-effect transistor with selectively doped GaAs/n-AlxGa1-xAs heterojunctions,” Japanese Journal of Applied Physics, vol. 19, pp. L225–L227, May 1980. [2] R. Dingle, H. L. Stormer, A. C. Gossard, and W. Wiegmann, “Electron mobilities in modulationdoped semiconductor heterojunction superlattices,” Applied Physics Letters, vol. 33, no. 7, pp. 665-667, Oct. 1978 [3] S. Hiyamizu, T. Mimura, T. Fujii, and K. Nanb, “High mobility of two-dimensional electrons at the GaAs/n-AlGaAs heterojunction interface,” Applied Physics Letters, vol. 37, no. 9, pp. 805- 807, Nov. 1980.
Copyright
Copyright © 2023 K. Niranjan, Y. Vasanth, K. Sathwik. This is an open access article distributed under the Creative Commons Attribution License, which permits unrestricted use, distribution, and reproduction in any medium, provided the original work is properly cited.

Download Paper
Paper Id : IJRASET48782
Publish Date : 2023-01-22
ISSN : 2321-9653
Publisher Name : IJRASET
DOI Link : Click Here
 Submit Paper Online