

Ijraset Journal For Research in Applied Science and Engineering Technology
Water Scarcity Zonation Mapping of Household in District Soreng West Sikkim by MCDM Method Using RS&GIS
Authors: Devendra Sharma, Er. Vinod Kumar Sonthwal
DOI Link: https://doi.org/10.22214/ijraset.2023.54293
Certificate: View Certificate
Abstract
A major global problem, water scarcity has a negative impact on ecosystems, socioeconomic activity, and millions of people. Effective water resource management calls for well-informed decision-making processes that consider many factors and their respective importance. The goal of this case study is to use the Multiple Criteria Decision-Making (MCDM) method to address the problem of ranking water scarcity. The study starts out by developing a set of pertinent standards for evaluating water shortage, including water availability, population demand, storage capacity, total population of the household, accessibility of a nearby source, distance to a perennial source, use of rainwater harvesting, number of animals in the household, water obtained from a public supply, and manual water collection methods. Surveys are used to gather information on these criteria, as well as statistical reports, remote sensing, and expert opinions. To ensure comparability across many parameters, the collected data are subsequently analysed and standardized. The regions are then ranked according to the severity of their water scarcity using a suitable MCDM approach. Using the MCDM method, decision-makers can consider their preferences and opinions as well as give various criteria proportionate weights based on their importance. The case study demonstrates how MCDM was used in the study area\'s battle against water scarcity. Policymakers and stakeholders can utilize the data to identify families that are experiencing the greatest levels of water scarcity and then priorities solutions based on those findings. Furthermore, sensitivity analysis can be performed to assess how well the ranking results hold up under other weightings and criteria. The results of this case study provide a systematic and all-encompassing strategy, which advances water resources management tactics also the results can be further used to prepare a Water Scarcity Zonation Map in ArcGIS or QGIS using RS&GIS method.
Introduction
I. INTRODUCTION
The Indian state of Sikkim has consistently struggled with a lack of water. The eastern Himalayan state of Sikkim is renowned for its abundance of natural beauty, including several rivers and lakes. Nevertheless, despite its geographical advantages, the area has long struggled with water shortage issues. Sikkim’s topography is characterized by steep slopes and rough mountains, which makes managing water a challenging undertaking. The area has a primarily monsoon climate, with the heaviest rain falling in the summer. Although the monsoon replenishes water supplies, it is challenging to adequately capture and store water due to the uneven rainfall distribution and the existence of steep terrain. In recent decades, Sikkim has experienced both populations increase and a rise in urbanization. Urbanization and population growth have put stress on water supplies, increasing demand and depleting water supplies. The economic foundation of Sikkim is agriculture. Terrace farming and the production of cash crops demand a significant amount of water. Water supply has also been impacted by the development of hydroelectric facilities in the area since water is diverted for power production. Water scarcity in Sikkim has been made worse by climate change effects including altered rainfall patterns and melting glaciers. Water supply for both human consumption and agricultural use is impacted by these changes. Sikkim’s water shortage is also a result of inadequate infrastructure and water management. The government of Sikkim has started several initiatives to solve water scarcity, including rainwater harvesting projects, reservoir development, and the promotion of water conservation practices. These initiatives seek to increase the state's access to water and promote sustainable water management.
Multi-Criteria Decision Making (MCDM) water shortage zonation is a systematic approach that aids in identifying and prioritizing locations with the most difficult water scarcity difficulties.
Water shortage is a serious problem that affects the entire world and is brought on by several factors, including population expansion, climate change, and ineffective water management techniques. It is essential to evaluate and rank regions according to their degree of water scarcity in order to allocate resources efficiently and adopt sustainable water management techniques as water resources grow scarcer. An organized framework for analyzing and contrasting numerous criteria or elements in order to reach conclusions is provided by MCDM technique. This method enables decision-makers to take several aspects of water shortage into account, including availability, quality, population density, agricultural demand, and environmental effects, among others. The government of Sikkim has started several initiatives to solve water scarcity, including rainwater harvesting projects, reservoir development, and the promotion of water conservation practices. These initiatives seek to increase the state's access to water and promote sustainable water management.
II. ADOPTED METHODOLOGY
Following methodology was adopted to conduct the study:
- Data collection: By conducting surveys, pertinent data for the study area, such as population data, storage data, qualification data, data on the number of men and women in the population, data on the availability of local sources, information on rainwater harvesting, the amount of water received from public sources, the distance to perennial sources, the number of pet animals, and information on the type of roofing of household were gathered. The MCDM analysis used this data as its input.
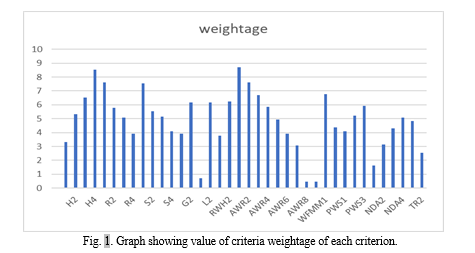
- Criteria Weighting: To reflect each criterion's relative relevance, appropriate weights were assigned to each one. Stakeholder interviews and expert judgement were used to determine the weighting. The weights account for how important each condition is in affecting water scarcity.
- Suitability Analysis: The Water Scarcity Index or Suitability Index for each location within the research region was calculated using the chosen MCDM technique, Weighted Sum Model (WSM). In order to create a composite score that would represent the degree of water shortage, the standardized data had to be aggregated using the weights that had been assigned.
- Zonation Mapping: Based on the water shortage index and appropriateness index results, the study region was divided into various zones using QGIS software. A visual representation of regions with various levels of water shortage is provided by the generated zonation map.
III. PROCEDURE
A. Preparation Of Questionnaire For Field Survey
It's crucial to plan questions that capture pertinent data and are in line with the study's objectives when creating a questionnaire for a field survey on water scarcity zonation. The following actions were taken to prepare the questionnaire:
- Defining the Objectives: The survey's objectives were first distinctly stated. The precise data needed for water scarcity zonation was identified, including factors causing water scarcity, perceptions of water availability, patterns of water use, or community needs related to water resources, as well as the storage capacity of the household and the highest qualification of the household.
- Finding the Main Themes: The main subjects or themes that the questionnaire will cover were found. Infrastructure, water demand, agricultural methods, socioeconomic factors, water obtained from the public supply, etc. are a few of these. To guarantee a logical flow in the questionnaire, the questions under each category were grouped.
- Determination of Question kinds: Based on the data that was sought, appropriate question kinds were chosen.
- Keeping Questions Simple and plain: To prevent ambiguity or confusion, plain and concise language was employed in the questions. The questions were made to be simple enough for the intended audience to grasp.
- Sequencing Questions Logically: To keep the questionnaire's flow, the questions were arranged in a logical order. To set the stage, broad questions were asked first, and then specific or delicate subjects were introduced gradually.
- Finalizing the Questionnaire: After making the necessary corrections, the questionnaire was polished and made user-friendly.
B. eld surveys are a crucial technique for gathering first-hand information from the studied area. They entail compiling data through on-site observations, testing, measurements, discussions, and surveys. By conducting firsthand observations, measurements, interviews, and questionnaires inside the subject region, field surveys are an effective way to gather primary data. With the help of this practical approach, researchers can get precise and pertinent data for their research goals.
Field surveys have several advantages over secondary data sources, including the ability to capture unique data that isn't possible with other methods and the ability to collect data that is time- and place-specific. Conducting a field survey requires thorough planning and methodical execution. The essential steps are as follows:
- Specifying Goals: The specific data needed from the field survey should be specified in the research objectives. This will serve as a direction for gathering data and ensure that the survey is focused on pertinent issues.
- How to Create Survey Instruments: Create appropriate survey tools, such as interview guides, questionnaires, and observation checklists. The required data must be accurately and effectively captured by these instruments.
- Sampling Strategy: Select the target population or the areas to be surveyed as part of the sampling strategy. Select a representative sample that is in line with the study's goals while taking statistical significance, accessibility, and diversity into account.
- Data Collection: Visit the research region to conduct a field survey, collecting data in accordance with the survey's objectives and instruments. Direct observations, measurements, individual or focus group interviews, and the distribution of questionnaires could all be part of this. Keep thorough records of the data gathered to guarantee its accuracy and consistency.
A survey was conducted for a total of 298 households. The name of the house owner and location is not included in the sample data for privacy reasons. The sample data collected is shown in the tables below.
TABLE I
SHOWING THE SAMPLE OF DATA COLLECTED BY CONDUCTING FIELD SURVEY
|
SL.NO |
TOTAL MEMBERS |
MALE |
FEMALE |
QUALIFICATION |
STORAGE CAPACITY IN LITRES |
LOCAL SOURCE |
|
1 |
9 |
5 |
4 |
GRADUATE |
12000 |
0 |
|
2 |
3 |
3 |
0 |
8 |
4000 |
0 |
|
3 |
6 |
3 |
3 |
12 |
4000 |
0 |
|
4 |
4 |
1 |
3 |
8 |
3000 |
0 |
|
5 |
3 |
2 |
1 |
GRADUATE |
15000 |
0 |
|
6 |
29 |
28 |
1 |
GRADUATE |
8000 |
0 |
|
7 |
3 |
1 |
2 |
8 |
1000 |
0 |
|
8 |
3 |
2 |
1 |
12 |
8000 |
0 |
|
9 |
4 |
2 |
2 |
GRADUATE |
400 |
0 |
|
10 |
5 |
3 |
2 |
GRADUATE |
4000 |
0 |
|
11 |
8 |
5 |
3 |
10 |
10000 |
0 |
|
12 |
4 |
2 |
2 |
7 |
3000 |
0 |
|
13 |
4 |
3 |
1 |
8 |
2000 |
0 |
|
14 |
3 |
2 |
1 |
8 |
2000 |
0 |
|
15 |
2 |
1 |
1 |
GRADUATE |
8000 |
0 |
|
16 |
4 |
3 |
1 |
POSTGRADUATE |
4000 |
0 |
|
17 |
5 |
3 |
2 |
GRADUATE |
3000 |
0 |
|
18 |
4 |
1 |
3 |
GRADUATE |
9000 |
0 |
|
19 |
4 |
1 |
3 |
GRADUATE |
9000 |
0 |
|
20 |
4 |
3 |
1 |
10 |
9000 |
0 |
|
21 |
3 |
2 |
1 |
8 |
2000 |
0 |
|
22 |
3 |
2 |
1 |
GRADUATE |
1500 |
0 |
|
23 |
5 |
3 |
2 |
2 |
9000 |
0 |
|
24 |
4 |
1 |
3 |
GRADUATE |
1500 |
0 |
|
25 |
10 |
4 |
6 |
8 |
9000 |
0 |
|
26 |
3 |
1 |
2 |
GRADUATE |
1500 |
0 |
|
27 |
6 |
3 |
3 |
GRADUATE |
10000 |
0 |
|
28 |
3 |
2 |
1 |
GRADUATE |
2000 |
0 |
|
29 |
8 |
4 |
4 |
GRADUATE |
9000 |
0 |
|
30 |
8 |
4 |
4 |
8 |
500 |
0 |
|
31 |
3 |
1 |
2 |
12 |
4000 |
0 |
|
32 |
5 |
4 |
1 |
10 |
9000 |
0 |
|
33 |
6 |
2 |
4 |
12 |
10000 |
0 |
|
34 |
4 |
3 |
1 |
8 |
1500 |
0 |
|
35 |
5 |
2 |
3 |
GRADUATE |
10000 |
0 |
|
36 |
13 |
5 |
8 |
12 |
15000 |
0 |
|
37 |
3 |
2 |
1 |
12 |
2000 |
0 |
|
38 |
2 |
1 |
1 |
8 |
1000 |
0 |
|
39 |
5 |
3 |
2 |
GRADUATE |
4000 |
0 |
TABLE II
SHOWING THE SAMPLE OF DATA COLLECTED BY CONDUCTING FIELD SURVEY
|
SL.NO |
RAINWATER HARVESTING |
WATER RECEIVED IN HOUR |
WATER FETCHED BY MANUAL MEANS |
SOURCE AT Km. |
NUMBER OF ANIMALS |
TYPE OF ROOF |
|
1 |
1 |
1 |
0 |
14 |
5 |
T |
|
2 |
0 |
0.8 |
0 |
14 |
0 |
T |
|
3 |
0 |
0.8 |
0 |
14 |
0 |
T |
|
4 |
0 |
0.8 |
0 |
14 |
3 |
T |
|
5 |
0 |
1 |
0 |
14 |
3 |
T |
|
6 |
0 |
1 |
0 |
14 |
0 |
T |
|
7 |
0 |
0.8 |
0 |
14 |
1 |
RCC |
|
8 |
0 |
0.8 |
0 |
14 |
0 |
T |
|
9 |
0 |
0.5 |
0 |
14 |
4 |
T |
|
10 |
0 |
0.5 |
0 |
14 |
0 |
T |
|
11 |
0 |
1 |
0 |
14 |
3 |
T |
|
12 |
0 |
0.8 |
0 |
14 |
5 |
T |
|
13 |
0 |
0.8 |
0 |
14 |
4 |
T |
|
14 |
0 |
0.8 |
0 |
14 |
2 |
T |
|
15 |
0 |
1 |
0 |
14 |
2 |
T |
|
16 |
0 |
1 |
0 |
14 |
2 |
T |
|
17 |
0 |
1 |
0 |
14 |
1 |
T |
|
18 |
0 |
1 |
0 |
14 |
2 |
T |
|
19 |
0 |
1 |
0 |
14 |
4 |
T |
|
20 |
0 |
1 |
0 |
14 |
2 |
T |
|
21 |
0 |
0.8 |
0 |
14 |
5 |
T |
|
22 |
0 |
0.8 |
0 |
14 |
1 |
T |
|
23 |
0 |
0.8 |
0 |
14 |
2 |
T |
|
24 |
0 |
0.8 |
0 |
14 |
1 |
T |
|
25 |
0 |
1 |
0 |
14 |
1 |
T |
|
26 |
0 |
1 |
0 |
14 |
4 |
T |
|
27 |
0 |
1 |
0 |
14 |
2 |
T |
|
28 |
0 |
1 |
0 |
14 |
1 |
T |
|
29 |
0 |
1 |
0 |
14 |
2 |
T |
|
30 |
0 |
1 |
0 |
14 |
2 |
T |
|
31 |
0 |
1 |
0 |
14 |
1 |
T |
|
32 |
0 |
0.8 |
0 |
14 |
3 |
T |
|
33 |
0 |
1 |
0 |
14 |
4 |
T |
|
34 |
0 |
1 |
0 |
14 |
2 |
T |
|
35 |
0 |
1 |
0 |
14 |
6 |
T |
|
36 |
0 |
1 |
0 |
14 |
5 |
T |
|
37 |
0 |
1 |
0 |
14 |
2 |
T |
|
38 |
0 |
1 |
0 |
14 |
0 |
T |
|
39 |
0 |
1 |
0 |
14 |
1 |
T |
C. Criteria Weighting
The prepared questionnaire was circulated among twenty engineers of Sikkim among which eighteen replied and out of eighteen responses only thirteen responses were readable.
TABLE III
SHOWING THE SAMPLE OF QUESTIONNAIRE FOR CRITERIA WEIGHTING
|
Sl. No |
Criteria |
Abbreviation |
|
|
|
1 |
How much, in your opinion, does a family's population contribute to the lack of water in a household in mountainous region? [1-5 people] |
H1 |
||
|
2 |
How much, in your opinion, does a family's population contribute to the lack of water in a household in mountainous region? [5-10 people] |
H2 |
||
|
3 |
How much, in your opinion, does a family's population contribute to the lack of water in a household in mountainous region? [10-15 people] |
H3 |
||
|
4 |
How much, in your opinion, does a family's population contribute to the lack of water in a household in mountainous region? [15 and above] |
H4 |
||
|
5 |
What role might education play, in your opinion, in the efficient use of a natural resource like drinking water in a hilly area? [class 12 and below] |
R1 |
||
|
6 |
What role might education play, in your opinion, in the efficient use of a natural resource like drinking water in a hilly area? [Graduate] |
R2 |
||
|
7 |
What role might education play, in your opinion, in the efficient use of a natural resource like drinking water in a hilly area? [Post graduate] |
R3 |
||
|
8 |
What role might education play, in your opinion, in the efficient use of a natural resource like drinking water in a hilly area? [Above post-Graduation] |
R4 |
||
|
9 |
What impact, in your opinion, might a household's water storage capacity have on the household's ability to obtain enough water in a hilly area like Sikkim? [below 2000 litres] |
S1 |
||
|
10 |
What impact, in your opinion, might a household's water storage capacity have on the household's ability to obtain enough water in a hilly area like Sikkim? [2000 to 5000 litres] |
S2 |
||
|
11 |
What impact, in your opinion, might a household's water storage capacity have on the household's ability to obtain enough water in a hilly area like Sikkim? [5000 to 10000 litres] |
S3 |
||
|
12 |
What impact, in your opinion, might a household's water storage capacity have on the household's ability to obtain enough water in a hilly area like Sikkim? [10000 and above] |
S4 |
||
|
13 |
In your experience, which gender out of male, and female uses more water in a household? [If number of male populations > female population in a house] |
G1 |
||
|
14 |
In your experience, which gender out of male, and female uses more water in a household? [If number of Female populations> male population in a house] |
G2 |
||
|
15 |
What role might availability of local water source play, in your opinion, in the water scarcity of a household in a hilly area? [Local source available] |
L1 |
||
|
16 |
What role might availability of local water source play, in your opinion, in the water scarcity of a household in a hilly area? [local source not available] |
L2 |
||
|
17 |
In a scale of 1 to 10, what might be the impact of Rainwater Harvesting in water scarcity of a household? [If rainwater harvesting done] |
RWH1 |
||
|
18 |
In a scale of 1 to 10, what might be the impact of Rainwater Harvesting in water scarcity of a household? [If rainwater harvesting not done] |
RWH2 |
||
|
19 |
What possible significance does the amount of time a home receives water from a public source have in relation to water scarcity? [10 minutes a day] |
AWR1 |
||
|
20 |
What possible significance does the amount of time a home receives water from a public source have in relation to water scarcity? [15 minutes a day] |
AWR2 |
||
|
21 |
What possible significance does the amount of time a home receives water from a public source have in relation to water scarcity? [20 minutes a day] |
AWR3 |
||
|
22 |
What possible significance does the amount of time a home receives water from a public source have in relation to water scarcity? [25 minutes a day] |
AWR4 |
||
|
23 |
What possible significance does the amount of time a home receives water from a public source have in relation to water scarcity? [30 minutes a day] |
AWR5 |
||
|
24 |
What possible significance does the amount of time a home receives water from a public source have in relation to water scarcity? [40 minutes a day] |
AWR6 |
||
|
25 |
What possible significance does the amount of time a home receives water from a public source have in relation to water scarcity? [1 hour a day] |
AWR7 |
||
|
26 |
What possible significance does the amount of time a home receives water from a public source have in relation to water scarcity? [6 hours a day] |
AWR8 |
||
|
27 |
What possible significance does the amount of time a home receives water from a public source have in relation to water scarcity? [8 hours and above a day] |
AWR9 |
||
|
28 |
In a scale of 1 to 10, what would be the impact of the following in water scarcity of a household? [If a household need to fetch water by manual means] |
WFMM1 |
||
|
29 |
In a scale of 1 to 10, what would be the impact of the following in water scarcity of a household? [If a household do not fetch water by manual means] |
WFMM2 |
||
|
30 |
In your opinion, what might be the impact of distance of perennial water source form a household in its water scarcity? [less than 10 km] |
PWS1 |
||
|
31 |
In your opinion, what might be the impact of distance of perennial water source form a household in its water scarcity? [10-15 km] |
PWS2 |
||
|
32 |
In your opinion, what might be the impact of distance of perennial water source form a household in its water scarcity? [15 km and above] |
PWS3 |
||
|
33 |
what might be the impact of number of domestic animals in a household in its water scarcity? [No domestic animal] |
NDA1 |
||
|
34 |
what might be the impact of number of domestic animals in a household in its water scarcity? [1-5 domestic animals] |
NDA2 |
||
|
35 |
what might be the impact of number of domestic animals in a household in its water scarcity? [5-10 domestic animals] |
NDA3 |
||
|
36 |
what might be the impact of number of domestic animals in a household in its water scarcity? [10 and above domestic animals] |
NDA4 |
||
|
37 |
In your opinion, which type of roof from the following can be used as a better catchment for rainwater harvesting? [Truss] |
TR1 |
||
|
38 |
In your opinion, which type of roof from the following can be used as a better catchment for rainwater harvesting? [RCC] |
TR2 |
The values obtained from the survey are listed in the table below.
TABLE IV
SHOWING THE RESPONSE OBTAINED FROM THE SURVEY FOR CRITERIA WEIGHTING IS GIVEN IN COLUMN AVG.
|
Criteria |
Response |
|||||||||||||
|
A |
B |
C |
D |
E |
F |
G |
H |
I |
J |
K |
L |
M |
AVG. |
|
|
1 |
3 |
4 |
3 |
5 |
3 |
2 |
3 |
4 |
3 |
2 |
4 |
2 |
5 |
3.307692 |
|
2 |
5 |
6 |
5 |
8 |
4 |
3 |
4 |
7 |
5 |
4 |
6 |
6 |
6 |
5.307692 |
|
3 |
7 |
8 |
7 |
10 |
5 |
4 |
6 |
6 |
7 |
6 |
6 |
7 |
6 |
6.538462 |
|
4 |
9 |
10 |
9 |
10 |
7 |
8 |
7 |
8 |
9 |
8 |
8 |
8 |
10 |
8.538462 |
|
5 |
8 |
9 |
8 |
7 |
6 |
6 |
6 |
8 |
8 |
8 |
9 |
7 |
9 |
7.615385 |
|
6 |
6 |
7 |
6 |
8 |
4 |
4 |
5 |
7 |
6 |
7 |
5 |
5 |
5 |
5.769231 |
|
7 |
5 |
6 |
5 |
6 |
4 |
3 |
5 |
6 |
5 |
5 |
4 |
4 |
8 |
5.076923 |
|
8 |
4 |
5 |
4 |
6 |
3 |
2 |
3 |
5 |
4 |
3 |
4 |
3 |
5 |
3.923077 |
|
9 |
9 |
10 |
9 |
5 |
7 |
7 |
8 |
7 |
9 |
8 |
6 |
8 |
5 |
7.538462 |
|
10 |
6 |
7 |
6 |
6 |
5 |
4 |
6 |
6 |
6 |
5 |
4 |
5 |
6 |
5.538462 |
|
11 |
5 |
6 |
5 |
6 |
4 |
4 |
5 |
6 |
5 |
4 |
5 |
6 |
6 |
5.153846 |
|
12 |
4 |
5 |
4 |
6 |
3 |
2 |
3 |
5 |
4 |
3 |
4 |
4 |
6 |
4.076923 |
|
13 |
4 |
5 |
4 |
5 |
4 |
2 |
3 |
5 |
4 |
4 |
3 |
3 |
5 |
3.923077 |
|
14 |
6 |
7 |
6 |
8 |
5 |
4 |
5 |
9 |
6 |
5 |
5 |
6 |
8 |
6.153846 |
|
15 |
0 |
1 |
0 |
2 |
0 |
0 |
0 |
2 |
0 |
1 |
0 |
1 |
2 |
0.692308 |
|
16 |
7 |
8 |
7 |
6 |
5 |
4 |
6 |
5 |
7 |
8 |
6 |
5 |
6 |
6.153846 |
|
17 |
4 |
5 |
4 |
4 |
3 |
2 |
4 |
4 |
4 |
3 |
5 |
3 |
4 |
3.769231 |
|
18 |
7 |
8 |
7 |
6 |
5 |
6 |
5 |
8 |
7 |
5 |
6 |
6 |
5 |
6.230769 |
|
19 |
9 |
10 |
9 |
10 |
8 |
7 |
8 |
8 |
9 |
8 |
9 |
8 |
10 |
8.692308 |
|
20 |
8 |
9 |
8 |
10 |
7 |
5 |
6 |
8 |
8 |
7 |
7 |
6 |
10 |
7.615385 |
|
21 |
7 |
8 |
7 |
10 |
6 |
4 |
5 |
8 |
7 |
7 |
6 |
8 |
4 |
6.692308 |
|
22 |
6 |
7 |
6 |
10 |
5 |
4 |
4 |
7 |
6 |
4 |
5 |
7 |
5 |
5.846154 |
|
23 |
5 |
6 |
5 |
6 |
4 |
5 |
4 |
6 |
5 |
4 |
5 |
6 |
3 |
4.923077 |
|
24 |
4 |
5 |
4 |
6 |
3 |
3 |
4 |
5 |
4 |
3 |
3 |
5 |
2 |
3.923077 |
|
25 |
3 |
4 |
3 |
5 |
2 |
2 |
2 |
5 |
3 |
1 |
2 |
5 |
3 |
3.076923 |
|
26 |
0 |
1 |
0 |
2 |
0 |
0 |
0 |
1 |
0 |
1 |
0 |
1 |
0 |
0.461538 |
|
27 |
0 |
1 |
0 |
1 |
0 |
0 |
0 |
1 |
0 |
1 |
1 |
1 |
0 |
0.461538 |
|
28 |
7 |
8 |
7 |
8 |
5 |
5 |
6 |
8 |
7 |
5 |
6 |
8 |
8 |
6.769231 |
|
29 |
5 |
6 |
5 |
5 |
4 |
3 |
4 |
3 |
5 |
6 |
4 |
3 |
4 |
4.384615 |
|
30 |
4 |
5 |
4 |
4 |
3 |
2 |
3 |
6 |
4 |
5 |
3 |
6 |
4 |
4.076923 |
|
31 |
5 |
6 |
5 |
7 |
4 |
3 |
4 |
7 |
5 |
4 |
5 |
7 |
6 |
5.230769 |
|
32 |
6 |
7 |
6 |
7 |
5 |
4 |
7 |
8 |
6 |
5 |
4 |
8 |
4 |
5.923077 |
|
33 |
2 |
3 |
2 |
1 |
1 |
2 |
2 |
1 |
2 |
1 |
1 |
1 |
2 |
1.615385 |
|
34 |
3 |
4 |
3 |
5 |
2 |
2 |
3 |
4 |
3 |
2 |
2 |
4 |
4 |
3.153846 |
|
35 |
4 |
5 |
4 |
6 |
2 |
3 |
5 |
6 |
4 |
3 |
3 |
6 |
5 |
4.307692 |
|
36 |
5 |
6 |
5 |
8 |
3 |
3 |
5 |
6 |
5 |
4 |
4 |
6 |
6 |
5.076923 |
|
37 |
5 |
6 |
5 |
7 |
2 |
4 |
3 |
7 |
5 |
4 |
4 |
7 |
4 |
4.846154 |
|
38 |
3 |
4 |
3 |
2 |
2 |
3 |
2 |
2 |
3 |
2 |
2 |
2 |
3 |
2.538462 |
D. Water Scarcity Index or Suitability Index
Calculating a water scarcity index using a weighted sum model involves assigning weights to different indicators or criteria related to water scarcity mentioned in table I and table II above and then combining them using a weighted sum formula. Step-by-step process on how to calculate a water scarcity index using this model is given below.
- Defining the indicators: First, the indicators of water scarcity index were defined as shown in table I and table II. These indicators include total household population, storage capacity, availability of local source, availability of rainwater harvesting system, number of hours water received from public supply, variation between male and female population, type of rooftop of household, highest qualification of household to see the pattern of proper utilization of water.
- Assigning weights: To each indicator based on their relative importance in contributing to water scarcity. The weights were determined by conducting a survey among the stakeholders and experts as shown in table IV.
- Calculation of the weighted sum: Each indicator was multiplied by its corresponding weight, and then the products were summed up. The formula for the weighted sum is as follows:
Weighted Sum = (Weight1 * Indicator1) + (Weight2 * Indicator2) + ... + (Weight N * Indicator N)
4. Interpretation of the index: The resulting weighted sum represents the water scarcity index. The interpretation of the index depends on the scale used for normalization. The indicators were normalized between 0 and 10, the index also ranged between 0 and 10, where higher values indicate higher water scarcity.
TABLE V
SHOWING THE SAMPLE OF SCARCITY INDEX CALCULATION.
|
SL.NO |
SITP |
SIFM |
SIQ |
SIS |
SILS |
SIRWH |
SIHWR |
SIWFMM |
SINA |
SIDSD |
AVG SI |
|
1 |
7 |
5 |
5 |
4 |
6 |
4 |
4 |
5 |
6 |
0 |
4.6 |
|
2 |
3 |
5 |
7 |
7 |
6 |
7 |
5 |
5 |
3 |
0 |
4.8 |
|
3 |
7 |
5 |
7 |
7 |
6 |
7 |
5 |
5 |
3 |
0 |
5.2 |
|
4 |
3 |
7 |
7 |
7 |
6 |
7 |
5 |
5 |
3 |
0 |
5 |
|
5 |
3 |
5 |
5 |
4 |
6 |
7 |
4 |
5 |
3 |
0 |
4.2 |
|
6 |
9 |
5 |
5 |
4 |
6 |
7 |
4 |
5 |
3 |
10 |
5.8 |
|
7 |
3 |
7 |
7 |
8 |
6 |
7 |
5 |
5 |
3 |
0 |
5.1 |
|
8 |
3 |
5 |
7 |
4 |
6 |
7 |
5 |
5 |
3 |
0 |
4.5 |
|
9 |
3 |
5 |
5 |
8 |
6 |
7 |
6 |
5 |
3 |
0 |
4.8 |
|
10 |
3 |
5 |
5 |
7 |
6 |
7 |
6 |
5 |
3 |
10 |
5.7 |
|
11 |
7 |
5 |
7 |
4 |
6 |
7 |
4 |
5 |
3 |
0 |
4.8 |
|
12 |
3 |
5 |
7 |
7 |
6 |
7 |
5 |
5 |
6 |
0 |
5.1 |
|
13 |
3 |
5 |
7 |
8 |
6 |
7 |
5 |
5 |
3 |
0 |
4.9 |
|
14 |
3 |
5 |
7 |
8 |
6 |
7 |
5 |
5 |
3 |
0 |
4.9 |
|
15 |
3 |
5 |
5 |
4 |
6 |
7 |
4 |
5 |
3 |
0 |
4.2 |
|
16 |
3 |
5 |
5 |
7 |
6 |
7 |
4 |
5 |
3 |
0 |
4.5 |
|
17 |
3 |
5 |
5 |
7 |
6 |
7 |
4 |
5 |
3 |
0 |
4.5 |
|
18 |
3 |
7 |
5 |
4 |
6 |
7 |
4 |
5 |
3 |
0 |
4.4 |
|
19 |
3 |
7 |
5 |
4 |
6 |
7 |
4 |
5 |
3 |
0 |
4.4 |
|
20 |
3 |
5 |
7 |
4 |
6 |
7 |
4 |
5 |
3 |
0 |
4.4 |
|
21 |
3 |
5 |
7 |
8 |
6 |
7 |
5 |
5 |
6 |
0 |
5.2 |
|
22 |
3 |
5 |
5 |
8 |
6 |
7 |
5 |
5 |
3 |
0 |
4.7 |
|
23 |
3 |
5 |
7 |
4 |
6 |
7 |
5 |
5 |
3 |
0 |
4.5 |
|
24 |
3 |
7 |
5 |
8 |
6 |
7 |
5 |
5 |
3 |
0 |
4.9 |
|
25 |
7 |
7 |
7 |
4 |
6 |
7 |
4 |
5 |
3 |
10 |
5.3 |
|
26 |
3 |
5 |
7 |
8 |
6 |
7 |
5 |
4 |
3 |
0 |
4.3 |
|
27 |
3 |
7 |
5 |
8 |
6 |
7 |
4 |
5 |
3 |
0 |
4.8 |
|
28 |
7 |
5 |
5 |
4 |
6 |
7 |
4 |
5 |
3 |
0 |
4.6 |
|
29 |
3 |
5 |
5 |
8 |
6 |
7 |
4 |
5 |
3 |
0 |
4.6 |
|
30 |
7 |
5 |
5 |
4 |
6 |
7 |
4 |
5 |
3 |
0 |
4.6 |
|
31 |
7 |
5 |
7 |
8 |
6 |
7 |
4 |
5 |
3 |
0 |
5.2 |
|
32 |
3 |
7 |
7 |
7 |
6 |
7 |
4 |
5 |
3 |
0 |
4.9 |
TABLE VI
SHOWING THE ABBREVIATIONS USED IN TABLE V
|
SL.NO |
SERIAL NUMBER |
|
SITP |
SCARCITY INDEX FOR TOTAL POPULATION OF HOUSEHOLD |
|
SIFM |
SCARCITY INDEX FOR VARIATION IN MALE FEMALE POPULATION OF A HOUSEHOLS |
|
SIQ |
SCARCITY INDEX FOR HIGHEST QUALIFICATION OF THE HOUSEHOLD |
|
SIS |
SCARCITY INDEX FOR STORAGE CAPACITY OF A HOUSEHOLD |
|
SILS |
SCARCITY INDEX FOR AVAILABILITY OF LOCAL SOURCE |
|
SIRWH |
SCARCITY INDEX FOR RAINWATER HARVESTING |
|
SIHWR |
SCARCITY INDEX FOR NUMBER OF HOURS WATER RECEIVED FROM PUBLIC SOURCE |
|
SIWFMM |
SCARCITY INDEX FOR WATER FETCHED BY MANUAL MEANS |
|
SINA |
SCARCITY INDEX FOR NUMBER OF DOMESTIC ANIMALS IN A HOUSEHOLD |
|
SIDSD |
SCARCITY INDEX FOR DIFFERENCE IN DEMAND AND SUPPLY |
|
AVG SI |
AVERAGE SCARCITY INDEX |
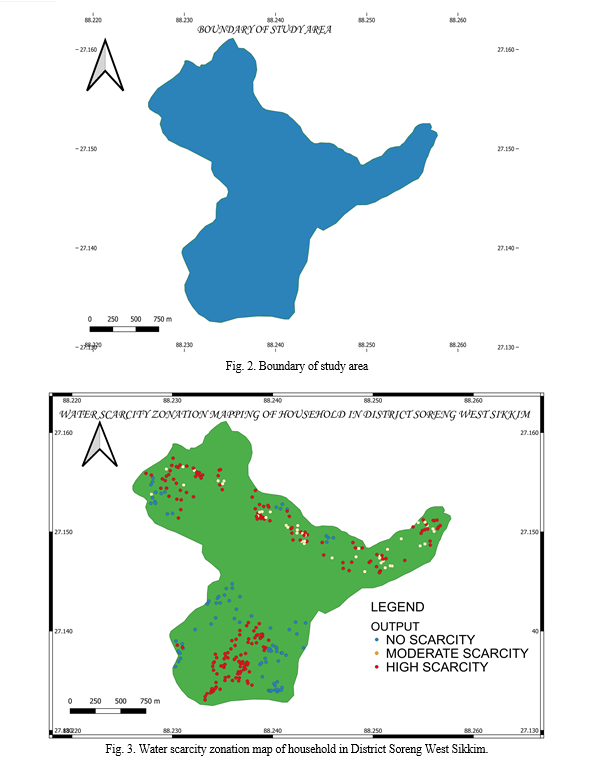
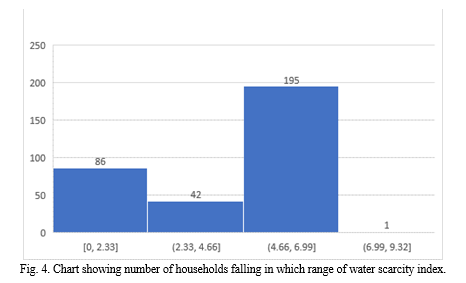
E. Zonation mapping in QGIS
Boundary map was created by digitizing google earth. The kml file obtained from google earth was then converted to shape file in QGIS which was further used in this study. The survey data along with the calculated scarcity index was converted to comma delimited(.CSV) format in MS Excel and saved. The csv file was then imported in QGIS and processed using processing tool. With the use of Vector Geoprocessing tool Plugin, the csv file and shape file were clipped. Categorisation of scarcity zone was done in three parts namely, No scarcity, moderate scarcity and high scarcity according to the values of individual scarcity index of households. The zonation map was then exported to image format from QGIS.
Conclusion
1) By reviewing the result, it was observed that out of 298 households, 86 households fell under no scarcity zone, 42 households under moderate scarcity zone and 196 households under high scarcity zone. 2) It was observed that water scarcity in the study area is mainly because of lack of availability of local sources, less amount of water received from the public supply and less water storage capacity of the households. 3) It was observed during the field survey that proper water management is not done during the distribution of water. 4) It was observed that the study area has a huge potential in Rainwater Harvesting. The government must sensitize the people about the benefits of rainwater harvesting.
References
[1] Chen K, Blong R, Jacobson C (2001) MCE-RISK: integrating multicriteria evaluation and GIS for risk decision-making in natural hazards. Environ Model Softw 16:387–397 [2] Flug M, Seitz HLH, Scott JF (2000) Multicriteria decision analysis applied to Glen Canyon Dam. J Water Resour Plan Manage ASCE 126(5):270–276 [3] Jaiswal RK, Mukherjee S, Krishnamurthy J, Saxena R (2003) Role of remote sensing and GIS techniques for generation of groundwater prospect zones towards rural development – an approach. Int J Remote Sens 24(5):993–1008. [4] Madrucci V, Taioli F, de Araújo CC (2008) Groundwater favorability map using GIS multicriteria data analysis on crystalline terrain, São Paulo State, Brazil. J Hydrol 357:153–173 [5] Shahid S, Nath SK, Roy J (2000) Groundwater potential modeling in a softrock area using a GIS. Int J Remote Sens 21(9):1919–1924 [6] Chowdhury A, Jha MK, Chowdary VM, Mal BC (2009) Integrated remote sensing and GIS-based approach for assessing groundwater potential in West Medinipur district, West Bengal, India. Int J Remote Sens 30(1):231–250 [7] Hajkowicz S, Higgins A (2008) A comparison of multiple criteria analysis techniques for water resource management. Eur J Oper Res 184:255–265 [8] Hasan, T.M. (2021) Study on Groundwater Resource Potentiality and Prospect of Artifcial Groundwater Recharge in Barind Tract, Bangladesh: A Multi-criteria Decision-Making Approach in GIS Environment, MS Thesis (Unpublished), University of Rajshahi, Bangladesh [9] Sener E, Davraz A, Ozcelik M (2005) An integration of GIS and remote sensing in groundwater investigations: a case study in Burdur, Turkey. Hydrogeol J 13(5–6):826–834. [10] Dey S (2014) Delineation of ground water prospect zones using remote sensing, GIS techniques—a case study of Baghmundi development block of Puruliya district, West Bengal. Int J Geol Earth Environ Sci 4(2):62–72 (ISSN: 2277-2081 (online)) [11] Morgan JP, McIntire WG (1959) Quaternary geology of the Bengal Basin, East Pakistan and India. Geol Soc Am Bull 70:319–342 [12] UNDP (United Nations Development Programme) (1982) Groundwater survey: the hydrogeological conditions of Bangladesh, united nations development programme (UNDP), technical report DP/ UN/BGD-74-009/1, New York, p 113
Copyright
Copyright © 2023 Devendra Sharma, Er. Vinod Kumar Sonthwal. This is an open access article distributed under the Creative Commons Attribution License, which permits unrestricted use, distribution, and reproduction in any medium, provided the original work is properly cited.

Download Paper
Paper Id : IJRASET54293
Publish Date : 2023-06-21
ISSN : 2321-9653
Publisher Name : IJRASET
DOI Link : Click Here
 Submit Paper Online