

Ijraset Journal For Research in Applied Science and Engineering Technology
“Effect of Hydroxyapatite Nanoparticles On Compressive strength and Flexural strength of Dental Composites Using Taguchi Method”
Authors: Shubham Padmaker Thakur, Dr. Umesh Vishnu Hambire
DOI Link: https://doi.org/10.22214/ijraset.2022.39691
Certificate: View Certificate
Abstract
Several composite materials are being used in biomedical and dental field with their immense applications to repair and transform various organs in human body. Recent advances suggest that Hydroxyapatite is one of the most reliable and widely used inorganic composite in dentistry. Desirable applications of Hydroxyapatite are achieved by utilizing variety of hydroxyapatite and their composites. This study was conducted to evaluate the compressive & flexural strength. Cylindrical specimens (n=9) for compressive strength & rectangular shaped specimens (n=9) for flexural strength were made according to manufacturer’s recommendations. Dental composite is using quartz, silica, and alumina glass as filler for a long time. Taguchi optimization technique keeps the experimentation within limit giving valid product in the calculating of compressive and flexural strength optimization. The goal of the work is to detect the best combination of composite materials.
Introduction
I. INTRODUCTION
The mechanical properties of the dental composite are the purpose of the matrix and filler composition. The purpose of this paper to get find out higher compressive and flexural strength of a dental composite by using hydroxyapatite, zirconia, and silica as a filler. The Suitable composition of Zirconia, hydroxyapatite, and silica is used to have a good result by gaining optimum flexural strength now day’s people have many problems such as dental cavities, decay, and root canal infections mostly cause due to bacterial infections. These problems hamper the tooth structure [1].
Recent advances in Biomedical field are the outcome of a vast and rapidly growing research work in the areas of material sciences mainly in nanomaterial of various compositions. Amongst the thousands of nano-materials, Hydroxyapatite is one of the most demanding and suitable bio-composite in Dentistry. [2] Outstanding properties such as antibacterial, biocompatibility and nontoxic ness makes them used extremely as a dental restorative material. More than that its advantages over aesthetic makes it more popular. Also, thermal, tribological, Physical and mechanical properties of polymer composites is moral.[3] (Bis-GMA) Bisphenol Aglycidyl methacrylate polymer composites tare the good and most commonly practice in dentistry for anterior & posterior tooth filling. It has low volatility, high viscosity, and low polymerization shrinkage. Urethane dimethacrylate are also lower viscosity but higher toughness than Bis-GMA. It can be used at substitute for Bis-GMA [15].Recently, reinforcements based on Nano fillers with saline treatment are being commonly used in dental polymer composites[4]. Dentintis athydrated biological dynamic compositwhichtconsiststof 30%twatertandtorganictmaterialstandt70%tminerals.[11,12]. Hydroxyapatite (HAP) contains the chemical element Ca10 (PO4) 6 (OH)2 which contains a large proportion of natural teeth and bones, providing excellent performance, good coherence and osteo-conductivity performance.
II. MATERIALS AND METHODS
The monomer system can be observed as the foundation of the composite resin system. Bis-GMA (bisphenol glycidyl methacrylate) and TEGDMA (triethylene glycol dimethacrylate) continue to be the mostly used monomers for manufacturing present-day composites [7]. Latest studies reveal introduction of hydroxyapatite as filler for improvement in mechanical properties. So addition to conventional filler namely zirconia and silica we have added hydroxyapatite nanoparticles as a new filler. Hydroxyapatite, Zirconia and silica with varying volume percentage as mentioned in table (1)
|
Process Parameters |
Level |
||
|
|
Levelt1 |
Levelt2 |
Levelt3 |
|
Hydroxyapatite% |
5.8 |
11 |
15.4 |
|
Zirconia% |
4.7 |
9.6 |
14.3 |
|
Silica% |
4.1 |
7.8 |
12.7 |
Table 1 Percentage % of filler volume at each level.
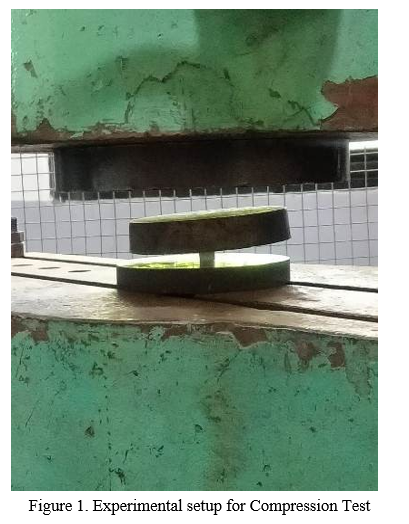
A. Preparation of Test Specimen for Compressive Strength
The test specimens for compressive strength experimental composites were made by the following method. A cylindrical test specimen was made using a glass tube of 12 mm inner dia (14 mm outer dia.) and 1cm long as mould. A transparent strip of glass was applied across each end, and then the material was compressed between 2 glass plates. The mold was slightly blocked with the test composite and all air bubbles were excluded.
The composites were restore for 20s or as per the manufacturer’s instructions on each side to confirm adequate polymerization with a LED light curing unit,3M Dental Products, light intensity > 450 mw/cm2. Then, specimens were removed from their moulds. The specimens were then kept in distilled water at 37°C for 24h.
The cylindrical specimen was tested in a universal testing machine and utilizing a crosshead speed of 1tmm/min. 3 specimens of each experimental group was tested. The mean value of the 3 was accepted as an observed strength of the tested composite resin. The purpose of the study was to study the involvement of different filler particles of Dental composites in the market to examine their mechanical properties and their filler contents.
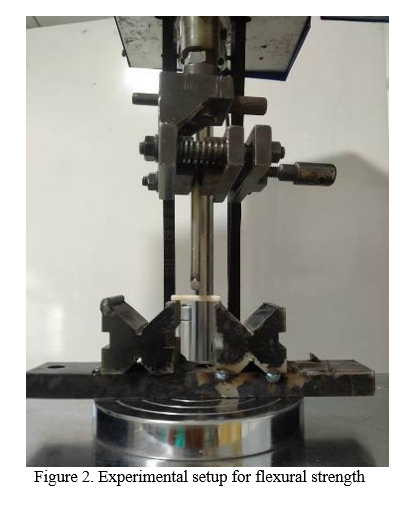
B. Preparation of Test Specimen for Flexural Strength
The test specimens for flexural strength experimental composites were made by the following method. A rectangle test specimen was made using a glass tube of 25×6×3 as mould. A transparent strip of glass was applied across each end, and then the material was compressed between 2 glass plates.
The mould was slightly blocked with the test composite and all air bubbles were excluded. The composites were restore for 20s or as per the manufacturer’s instructions on each side to ensure adequate polymerization with a LED light curing unit (XL1500), 3M Dental Products, light intensity > 450 mw/cm2.
Then, specimens were removed from their moulds. The specimens were then kept in distilled water at 37°C for 24h. The cylindrical specimen was tested in a universal testing machine and utilizing a crosshead speed of 1tmm/min. 3 specimens of each experimental group was tested.
The mean value of the 3 was accepted as an observed strength of the tested composite resin. The purpose of the study was to study the contribution of different filler particles of Dental composites in the market to examine their mechanical properties and their filler contents.
C. Procedure Adopted for Testing Compressive Strength and Flexural strength
The ASTM Standard accepted was and ASTM D 695 - 2015. We measured the initial dia and cross-section is of the specimen on the performance of dental composite in general and compressive strength in particular. Calculate & record the minimum value of the cross-sectional area was calculated and also measured the length of the specimen and recorded the value. Test specimen was positioned compressive testing machine.
Wet move the crosshead of the testing machine until it just contacts the top of the tool plunger was adjusted. The test machine is equipped with an automatic recording device, record the complete load deformation curve and allow the machine to run at this speed until the specimen breaks.
The ASTM Standard accepted was and ASTM D 790 - 2017. We measured the width and thickness of the specimen on the performance of dental composite in general and flexural strength in particular. Experimentation was complete and testing of all the leading commercially available brands to the nearest 0.01tmm (t0.001tin.) at several points along its length. Calculate and record the minimum value of the cross-sectional area was calculated and also measured the length of the specimen and recorded the value. Test specimen was positioned flexural testing machine.
Wet move the crosshead of the testing machine until it just contacts the top of the tool plunger was adjusted. The test machine is equipped with an automatic recording device, record the complete load deformation curve. After the yield point has been touched it may bet\desirable to increase the speedtfromt5ttot6tmm/min (0.20ttot0.25tin./min) and allow the machine to run at this speed until the specimen breaks.
D. Preparation of test Specimen
We have taken 3 levels of filler volume percentages, Low, medium and high. These 3 levels are shown in table 1. We have varied the 3 levels of the volume percentage of hydroxyapatite, Zirconia & silica. By Taguchi L9torthogonal array we have nine experimental composites.
E. Taguchi experiment: Design and analysis
Out-dated experimental design procedures are too complicated and not easy to use. When the number oftprocesstparameterstarettincreases, at large number of experimental works have to be carried out. Dr Genichi Taguchi has designed tat method which reduces the number of experiments by the use of an orthogonal array. The information the behaviour of the process tis obtained from a plan of experiments with the objective of acquiring data tin at controlled way. This design of high-quality system called Taguchi design method which reduces efforts of conducting a number of experiments, thus saving time and cost and enabling discovery significant factors quickly. But the main advantage of Taguchi method ist by conducting less experiments, we get a reliable result and also the higher the value of sum of square of tan independent variable, the more it has influence ton the performance parameter. One can also calculate the ratio of individual of square of a particular.
Independent variable to the total sum of squares of all the variables. This ratio gives the present contribution of the independent variable on the performance parameter. In addition to above, tone could also find the optimal solution to the problem. A statistical analysis of variance and signal to noise ratio can be employed to study the influence of different filler volume percentages on flexural strength & compressive strength values. Following are the steps followed in Taguchi optimization study (Taguchit1990; Rosst1996). (1) Select noise and control factors. (2) Select Taguchi orthogonal array. (3) Conduct experiments and measure the flexural strength forteach of the experimental composites. (4)Analyse results (signal-to-noise ratio). (5) Predict optimum.(6) Confirmation experiment.
|
Experiment number |
Filler volume levels |
Compressive Strength Mpa |
Flexural Strength Mpa |
||
|
Hydroxyapatite |
zirconia |
silica |
|||
|
1. |
1 |
1 |
1 |
63 |
58 |
|
2. |
1 |
2 |
2 |
75 |
53.1 |
|
3 |
1 |
3 |
3 |
97 |
49.4 |
|
4. |
2 |
1 |
2 |
105 |
53 |
|
5. |
2 |
2 |
3 |
130 |
47.66 |
|
6. |
2 |
3 |
1 |
110 |
54.8 |
|
7. |
3 |
1 |
3 |
140 |
44.9 |
|
8. |
3 |
2 |
1 |
100 |
54 |
|
9. |
3 |
3 |
2 |
150 |
43.2 |
Table 2 Orthogonal Array For TaguchitL9 Design
F. Planning of Experiments
Here Taguchi method tis used, which contains the experiment design theory and the quality loss function concept. The degrees of freedom for 3 parameters in each of 3 levels were calculated as follows: degree of freedom (DOF) = number of levels –1. For each factor, DOF is as follows: for hydroxyapatite DOF=t3t–t1t=t2; for zirconia, DOF = 3 – 1t=t2; for silica, DOF = 3t– 1t= 2. tL9torthogonaltarray 9 (Taguchi) was used, which has 3 columns at 3 levels and 9 rows corresponding to the number of tests [11]. Nine experiments were shown at different parameters tin this study. L9 orthogonal array has 8 DOFs, in which 6 were assigned to 3 factors (each onet2 DOFs) and 2 DOF were allocated to the error. Tablet4 shows the degree of influence of the process parameters, i.e. the filler content volumetric percentage, 3 factors each tat 3 levels, are taken into account [11]. The compressive & flexural strength was tested for each experimental composite with filler volume percentage corresponding to each level. The compressive & flexural strength values corresponding to each experimental composite are shown in table2.
III. RESULTS AND DISCUSSION
A. Regression Analysis
A mathematical model was developed with the volumetric % of 3 fillers in the composite, namely, hydroxyapatite, zirconia and silica and its effect on the compressive & flexural strength. The relationship between factors:- hydroxyapatite, zirconia, silica and compressive, flexural strength was obtained by multiple linear regressions. To derive the models, the standard commercial statistical software package ‘MINITAB’ is used.
Regression Equation
|
compressive strength |
= |
4.0 + 5.432 hydroxyapatite + 1.688 zirconia + 3.58 silica |
Regression Equation
|
flexural strength |
= |
68.14 - 0.629 hydroxyapatite - 0.294 zirconia - 0.938 silica |
B. Analysis of the Signal to Noise Ratio
For the minimization of quality characteristic variation due to uncontrollable parameters the response variation is studied using signal-to-noise ratio as enumerated tin Taguchi method. In the dental composites, larger compressive & flexural strength will be better, so the compressive & flexural strength was considered as the quality characteristic and the concept of ‘the larger-the-better’ [11] was used. The signal-to-noise ratio used for this type response is taken as t ‘larger-the-better’ and given by the relation.
Where,
y = measured value tin a run/row
n= number of measurements in a trial/row (n=t1 in this case).
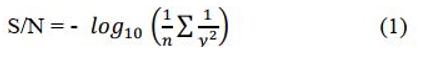
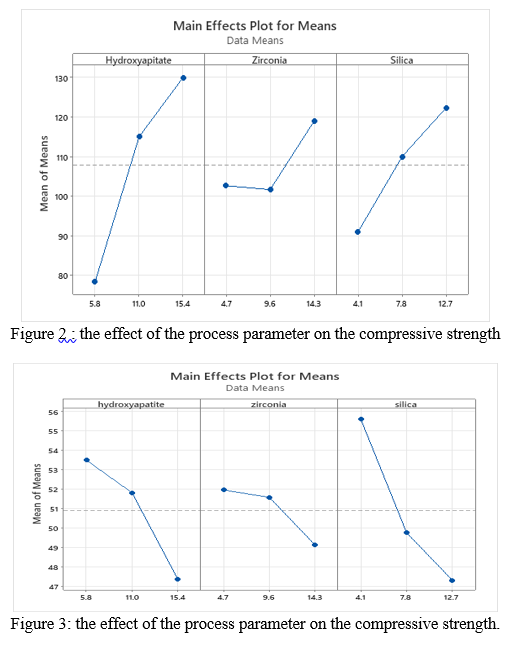
Calculate the signal-to-noise ratio in Equation (1). the corresponding values of compressive & flexural strength and the signal-to-noise ratios are shown tint tablet2. For the volumetric % of hydroxyapatite, zirconia and silica concentrations, the compressive & flexural strength response table and the rank are shown tin table 3&4. A greater signal-to-noise ratio\value twill give\ better performance, irrespective of the performance characteristic. The greater S/N ratio value will give the optimum level filler volume percentage. The optimal flexural strength was obtained at hydroxyapatite% =t5.8 (levelt1), zirconia= 4.7 (level 1), silica% = 4.1t (levelt1), based on the analysis of the S/N ratio.
larger is better
|
Level |
Hydroxyapatite |
Zirconia |
Silica |
|
1 |
37.74 |
39.78 |
38.94 |
|
2 |
41.18 |
39.93 |
40.48 |
|
3 |
42.15 |
41.36 |
41.65 |
|
Delta |
4.41 |
1.58 |
2.71 |
|
Rank |
1 |
3 |
2 |
Table No.3 Signal to Noise Ratios Response Table for compressive strength
|
Level |
Hydroxyapatite |
Zirconia |
Silica |
|
1 |
34.55 |
34.27 |
34.90 |
|
2 |
34.27 |
34.24 |
33.90 |
|
3 |
33.47 |
33.79 |
33.49 |
|
Delta |
1.08 |
0.48 |
1.40 |
|
Rank |
2 |
3 |
1 |
Table No.4 Signal to Noise Ratios Response Table for flexural strength
C. Analysis of Variance (ANOVA)
For finding out the differences in the average performance of the groups of items tested, ta statistical tool named ANOVA, which is an objective decision-making tool, is used. At a specific confidence level, the mean square is compared with an estimate of experimental error in ANOVA The interaction and significance of all the main factors are tested. The following equation is used to find out the total sum of squared deviations SST from the total mean S/N ratio, nm
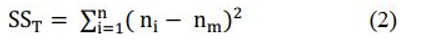
Where,
???????? = mean S/N ratio for the ith experiment
n = number of experiments in the orthogonal array.
For calculation of P, i.e. percentage contribution
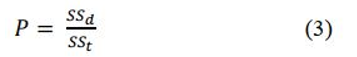
Where is ???????????? the sum of the squared deviations Table 4 shows the results of ANOVA. To find out the significance of at factor, a ratio of the mean square error to the residual error is taken and called as F-ratio, named after Fisher. Fisher test is used to study the significant effect on quality characteristic by the design parameters. To study the effect of\the filler volume percentage\on the compressive & flexural strength we use the percentage (%) shown in tablet4. From table 5, it can be seen that Nano-filler hydroxyapatite has 66.62%, zirconia 9.50% and silica 22.92% & hydroxyapatite has 32.56%, zirconia 7.46%, silica 53.79%, which influences on the compressive strength & flexural strength, respectively.
|
Source |
DF |
Seq SS |
Adj SS |
Adj MS |
F |
P |
Total |
|
Hydroxyapitate |
2 |
32.1687 |
32.1687 |
16.0843 |
70.07 |
0.014 |
66.62 |
|
Zirconia |
2 |
4.5904 |
4.5904 |
2.2952 |
10.00 |
0.091 |
9.50 |
|
Silica |
2 |
11.0675 |
11.0675 |
5.5337 |
24.11 |
0.040 |
22.92 |
|
Residual Error |
2 |
0.4591 |
0.4591 |
0.2295 |
|
|
0.95 |
|
Total |
8 |
48.2857 |
|
|
|
|
100 |
|
|
|
|
|
|
|
|
|
|
Source |
DF |
Seq SS |
Adj SS |
Adj MS |
F |
P |
Total |
|
hydroxyapatite |
2 |
1.8947 |
1.8947 |
0.9474 |
5.28 |
0.159 |
32.56 |
|
zirconia |
2 |
0.4344 |
0.4344 |
0.2172 |
1.21 |
0.453 |
7.46 |
|
silica |
2 |
3.1294 |
3.1294 |
1.5647 |
8.72 |
0.103 |
53.79 |
|
Residual Error |
2 |
0.3590 |
0.3590 |
0.1795 |
|
|
6.17 |
|
Total |
8 |
5.8175 |
|
|
|
|
100 |
Table 5. (ANOVA) results for Flexural strength & compressive strength of dental composite
D. Confirmation Test
Taguchi strongly suggested a confirmation test for confirming the results [11;14]. The experiments are conducted with the ideal conditions and the strength is found. This compressive & flexural strength is compared with that calculated value using the relation enumerated above. We had obtained optimum filler volume as A2B2C3, A2B1C2 and the compressive strength and flexural strength found experimentally was.
|
|
Optimal Condition |
|
|
Prediction |
Experimental |
|
|
Level |
A2B2C3 |
A2B2C3 |
|
compression strength |
130 |
132 |
.
|
|
Optimal Condition |
|
|
Prediction |
Experimental |
|
|
Level |
A2B1C2 |
A2B1C2 |
|
flexural strength |
47.66 |
49 |
Conclusion
A. In our study, we have prepared a experimental dental composite. We have used three Nano fillers namely, hydroxyapatite, zirconia and silica in combination. B. It is observed that the influence hydroxyapatite of as a filler material on experimental dental composite is very significant and highest in our study, effect of hydroxyapatite on compressive strength being 66.52%, effect of silica on flexural strength being 53.79%. Statistical results (at a 95%tconfidencetlevel) show that the hydroxyapatite, zirconia, silica affect the compressive strength tbyt66.62%, 9.50% and 22.92%, flexural strength by 32.56%,7.46% and 53.79% of the experimental dental composites, r C. Statistically\\ designed experiments based on L9 orthogonal arrays by using Taguchi methods to evaluate the compressive & flexural strength as a response variable. Conceptual S/N ratio and ANOVA approaches for data analysis drew similar conclusions. D. In this study, the analysis of the confirmation experiment for compressive & flexural strength has shown that Taguchi parameter design can successfully verify the optimum filler volume percentages of compressive strength (A2B2C3), which are hydroxyapatite = 11% (A2), zirconia = 9.6% (B2) and silica = 12.7% (C3) and flexural strength which are hydroxyapatite = 11% (A2), zirconia = 4.7% (B1) and silica = 7.8% (C2) E. The confirmatory experimental tests results are matching with the optima value of flexural strength & compressive strength calculated.
References
[1] Wu YR, Chang CW, Ko CL, Wu HY, Chen WC. The morphological effect of calcium phosphates as reinforcement in methacrylate-based dental composite resins on mechanical strength through thermal cycling. Ceram Int 2017;43: 14389e94. [2] Wille S, Holken I, Haidarschin G, Adelung R, Kern M. Biaxial flexural strength of new BisGMA/TEGDMA based composites with different fillers for dental applications. Dent Mater 2016;32:1073e8. [3] Ai M, Du Z, Zhu S, Geng H, Zhang X, Cai Q, et al. Composite resin reinforced with silver nanoparticleseladen hydroxyapatite nanowires for dental application. Dent Mater 2017;33:12e22 [4] RamkumarYadav,MukeshKumar.Dental restorative composite materials: A review Journal of Oral Biosciences 61 (2019) 78e83 [5] ASTM D 695-08, Standard test method for compressive properties of rigid plastics, 2008 [6] Atai M, Nekoomanesh M, Hashemi S A and Amani S 2004 Dent. Mater. 20 663 [7] Bowen, R L 1964 J. Am. Dent. Assoc. 69 482 [8] Eliseu A M et al 2012 J. Contemp. Dent. Practice 13 299 [9] Manhart J, Kunzelmann K H, Chen H Y and Hickey R Dent. Mater. 2000 16 33 [10] Mitra S B, Dong W U and Holmes B N 2003 J. Am. Dent. Assoc. 134 1382 [11] Ross P J 1996 Taguchi techniques for quality engineering (Singapore: McGraw-Hill International Editions) [12] Ruddell D E, Maloney M M and Thompson J Y 2002 Dent. Mater. 18 72 [13] Soh S, Sellinger M, Alan U J and Adrian Y 2006 Curr. Nanosci. 2 373 [14] Taguchi G 1990 Introduction to quality engineering (Tokyo: Asian Productivity Organisation [15] Taira Miyasaka 1996 Dent. Mater. J. 15 98
Copyright
Copyright © 2022 Shubham Padmaker Thakur, Dr. Umesh Vishnu Hambire. This is an open access article distributed under the Creative Commons Attribution License, which permits unrestricted use, distribution, and reproduction in any medium, provided the original work is properly cited.

Download Paper
Paper Id : IJRASET39691
Publish Date : 2021-12-29
ISSN : 2321-9653
Publisher Name : IJRASET
DOI Link : Click Here
 Submit Paper Online