

Ijraset Journal For Research in Applied Science and Engineering Technology
A Novel Functional Machine Learning Approaches on Prostate Cancer
Authors: K. Ramakrishna Reddy, Dr. G. N. K. Suresh Babu
DOI Link: https://doi.org/10.22214/ijraset.2022.41598
Certificate: View Certificate
Abstract
Cancer registries are collections of curated data about malignant tumor diseases. The amount of data processed by cancer registries increases every year, making manual registration more and more tedious.This research work finds Bayes Net classifier gives an optimal results. The Sequential Minimal Optimization of functional machine learning approach is having highest accuracy level which is 85% of accuracy level. The Sequential Minimal Optimization of functional machine learning approach is having highest precision level which is 0.85 of precision level. The least precision value is 0.80 of precision value which is having Quadratic Discriminant Analysis of functional machine learning classifier approach. The Sequential Minimal Optimization of functional machine learning approach is having highest recall level which is 0.85 of recall level. The least recall value is 0.79 which is produced by Quadratic Discriminant Analysis functional machine learning classification approach. The Sequential Minimal Optimization of functional machine learning approach is having highest F- Measure level which is 0.85 of F-Measure level. The Fisher’s Discriminant Analysis algorithm of functional machine learning classifier and Linear Discriminant Analysis classification algorithm of functional machine learning classifier are having same receiver operating characteristic curve value which is 0.90 of receiver operating characteristic curve value.The maximum precision recall curve value is 0.90 of precision recall curve value which is produced by Linear Discriminant Analysis of functional machine learning classifier. This system recommends that the Sequential Minimal Optimization of functional machine learning approach produces optimal results compare with other models.
Introduction
I. INTRODUCTION
Cancer registries have been established to generate the systematic collection of data about malignant tumor diseases. Population-based cancer registries can be used to monitor the incidence of cancer cases or to study cancer survival [ 1,3 ]. The oldest French cancer registry is settled in Bas-Rhin department—a French administrative region, located in eastern France. The Bas-Rhin cancer registry exhaustively collects all new incident cases of cancer among people living in this territory.
Notifications of potential new cancer cases from local hospitals, health insurance, or medical pathologists are processed by cancer registry technicians who capture relevant information about the tumors, including their anatomical topography and morphology [4]. To harmonize data collection, registered cases are coded according to the International Classification of Diseases for Oncology, 3 rd edition (ICDO3) [5].
Some information, such as the TNM Classification of Malignant Tumors (TNM) or biological markers, is also extracted.Seven people are working full time on this registration task.[6,7,8]Automating part of the registration process may reduce delays in data production and allow technicians to devote more time to complex tasks, such as complementary data collection (e.g., disease stage or treatment) and analysis.
Recent and advanced machine learning algorithms for processing text and sequences found in pathology reports could find useful applications in this context [9-14]. However, the amount of data processed by the registry increases each year, making manual registration more and more tedious and time consuming. The Bas-Rhin registrars currently receive about 70,000 notifications yearly, resulting in the addition of 6000 new cancers to the database, including about 700 cases of prostate adenocarcinoma [15-19 ]. In this research work, section 2 contains related works; in section 3 has materials and methods; in section 4 presents results and discussions and finally section 5 presents conclusion of this research work.
II. LITERATURE SURVEY
Various authors have used supervised, semi-supervised, and even unsupervised data mining techniques to analyze the survival in different types of cancers [20-24].An ANN model to predict the survival of pancreatic cancer patients by collecting data from a teaching hospital. The authors used quality of life attributes (SF-36 attributes) along with other clinical characteristics for predicting survival[23-25]. They raised the sensitivity levels to 90% to reduce the commission regret in clinicians and patients.The results were compared with the Cox-regression method, and ANN gave better sensitivity levels. Several other researchers also used ANN and analyzed with statistical or machine learning techniques. While ANN performed better than statistical techniques in some studies [28], its significance compared to other machine learning techniques was not commendable in survival prediction [26-27]. Some supervised and statistical methods to analyze the performance of cancer survival prediction when data is trained separately for each stage. The authors found that the essential predictors changed with each stage and performed better compared to the whole dataset when stage was used as just a feature.
III. MATERIALS AND METHODS
This section focuses on the materials and methods of research work. Here, the prostate cancer dataset borrowed from one of the leading dataset repository such as kaggle repository. The dataset contains 100 patients’ records. Such as 100 observations and 10 variables which are as follows:
Table 1:Meta data of Prostate Cancer dataset
|
S.No |
Label |
Data type |
|
1 |
Id |
Integer |
|
2 |
Radius |
Integer |
|
3 |
Texture |
Integer |
|
4 |
Perimeter |
Integer |
|
5 |
Area |
Integer |
|
6 |
Smoothness |
Float |
|
7 |
Compactness |
Float |
|
8 |
Symmetry |
Float |
|
9 |
Fractal dimension |
Float |
|
10 |
Diagnosis_result |
Character |
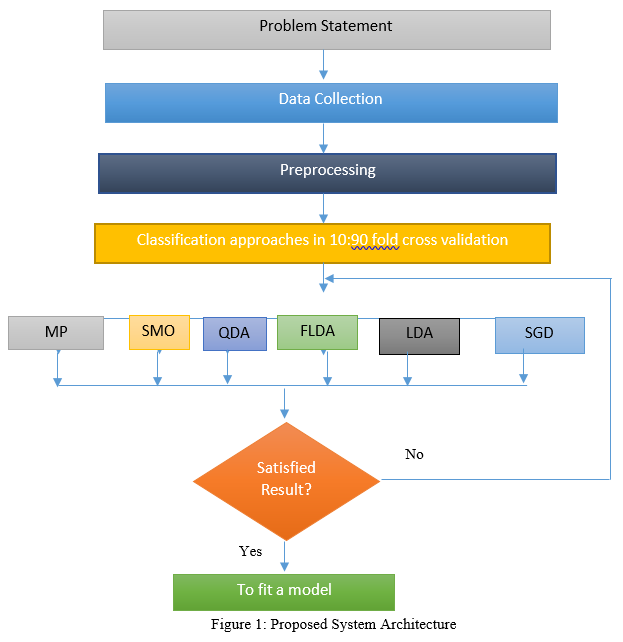
A. Methodology
Here this research work focuses on the above mentioned dataset using following statistical machine learning algorithms in 10 cross fold validation in one of the leading open source data mining tool namely Weka 3.9.5.
- Multilayer Perceptron(MP)
- Sequential Minimal Optimization(SMO/SVM)
- Quadratic Discriminant Analysis(QDA)
- Fisher's linear discriminant analysis(FLDA)
- Linear Discriminant Analysis(LDA)
- Stochastic Gradient Descent (SGD)
I V. RESULTS AND DISCUSSIONS
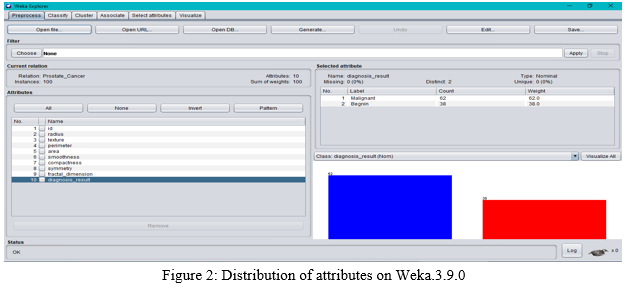
This section focuses on the results and discussions of this research work. The below image displays that the attribute distribution of Prostate cancer datasetfrom Kaggle data repository.[2]
The below table shows that the various outcomes of statistical machine learning algorithms in 10:90 fold cross validation.
Table 2: Various Bayes Classifiers and their measurements
|
Classifiers |
Accuracy |
Precision |
Recall |
F- Measure |
ROC |
PRC |
Time taken to build model (In Sec.) |
|
Multilayer Perceptron |
83% |
0.83 |
0.83 |
0.83 |
0.89 |
0.87 |
0.34 |
|
Sequential Minimal Optimization |
85% |
0.85 |
0.85 |
0.85 |
0.85 |
0.80 |
0.08 |
|
Quadratic Discriminant Analysis |
79% |
0.80 |
0.79 |
0.79 |
0.82 |
0.77 |
0.01 |
|
Fisher's Linear Discriminant Analysis |
83% |
0.84 |
0.83 |
0.83 |
0.90 |
0.89 |
0.19 |
|
Linear Discriminant Analysis |
82% |
0.82 |
0.82 |
0.82 |
0.90 |
0.90 |
0.02 |
|
Stochastic Gradient Descent |
84% |
0.84 |
0.84 |
0.84 |
0.82 |
0.78 |
0.05 |
The Multilayer Perceptron produces 83% of accuracy value,0.83 of precision value, 0.83 of recall value, 0.83 of F-Measure value, 0.89 of receiver operating characteristic curve value, 0.87 of precision recall value and it takes 0.34 time consumption to build a model. The Sequential Minimal Optimization produces 85% of accuracy value, 0.85 of precision value, 0.85 of recall value, 0.85 of F-Measure value, 0.85 of receiver operating characteristic curve value, 0.80 of precision recall value and it takes 0.08 time consumption to build a model. The Quadratic Discriminant Analysis produces 79% of accuracy value, 0.80 of precision value, 0.79 of recall value, 0.79 of F-Measure value, 0.82 of receiver operating characteristic curve value, 0.77 of precision recall value and it takes 0.01 time consumption to build a model. The Fisher's Linear Discriminant Analysis produces 83% of accuracy value, 0.84 of precision value, 0.83 of recall value, 0.83 of F-Measure value, 0.90 of receiver operating characteristic curve value, 0.89 of precision recall value and it takes 0.19 time consumption to build a model. The Linear Discriminant Analysis produces 82% of accuracy value, 0.82 of precision value, 0.82 of recall value, 0.82 of F-Measure value, 0.90 of receiver operating characteristic curve value, 0.90 of precision recall value and it takes 0.02 time consumption to build a model.The Stochastic Gradient Descent Analysis produces 84% of accuracy value, 0.84 of precision value, 0.84 of recall value, 0.84 of F-Measure value, 0.82 of receiver operating characteristic curve value, 0.78 of precision recall value and it takes 0.05 time consumption to build a model.
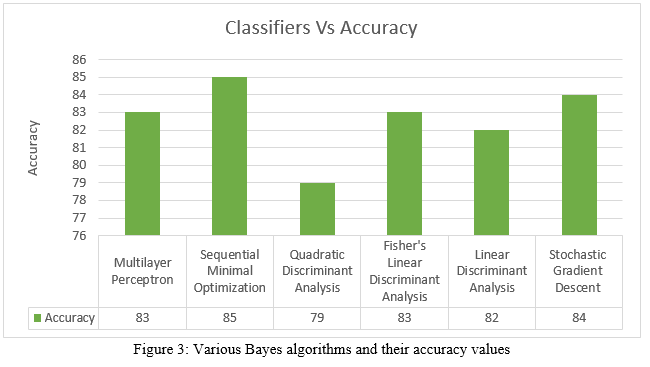
The above diagram shows that the various functional classifiers and their accuracy levels. The Sequential Minimal Optimization of functional machine learning approach is having highest accuracy level which is 85% of accuracy level. The least accuracy value is 79% which is having Quadratic Discriminant Analysis classifier.
The Fisher’s Discriminant Analysis classifier and Multilayer Perceptron classifier are having same accuracy level which is 83% of accuracy level. The linear Discriminant Analysis classifier is having 82% of accuracy and Stochastic Gradient Descent classifier is having 84% of accuracy level.
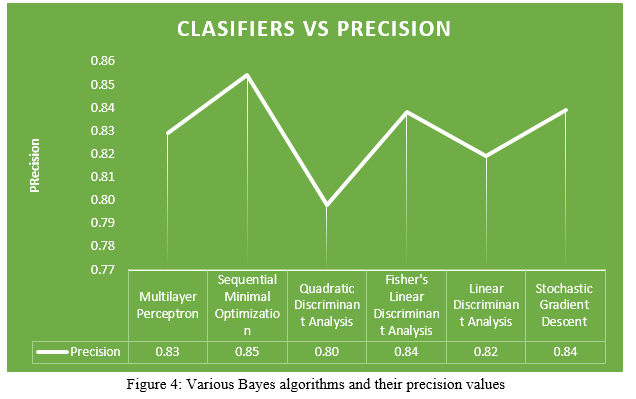
The above diagram shows that the various functional classifiers and their precision levels. The Sequential Minimal Optimization of functional machine learning approach is having highest precision level which is 0.85 of precision level. The least precision value is 0.80 of precision value which is having Quadratic Discriminant Analysis of functional machine learning classifier approach. The Fisher’s Discriminant Analysis classifier and Stochastic Gradient Descent classifier are having same precision value which is 0.84 of precision value. The Multilayer Perceptron classifier is having 0.83 of precision level and the linear Discriminant Analysis classifier is having 0.82 of precision level.
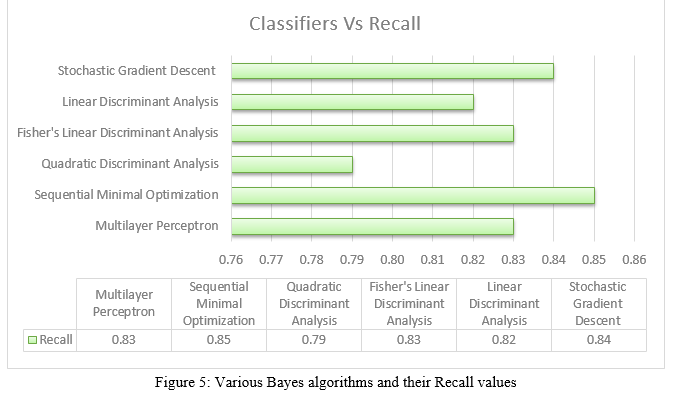
The above diagram shows that the various functional classifiers and their recall levels.The Sequential Minimal Optimization of functional machine learning approach is having highest recall level which is 0.85 of recall level. The least recall value is 0.79 which is produced by Quadratic Discriminant Analysis functional machine learning classification approach. The Fisher’s Discriminant Analysis classifier and Multilayer Perceptron classifier are having same recall value level which is 0.83 of recall value level. The Linear Discriminant Analysis classifier is having 0.82 of recall level value and Stochastic Gradient Descent classifier is having 0.84 of recall value level.
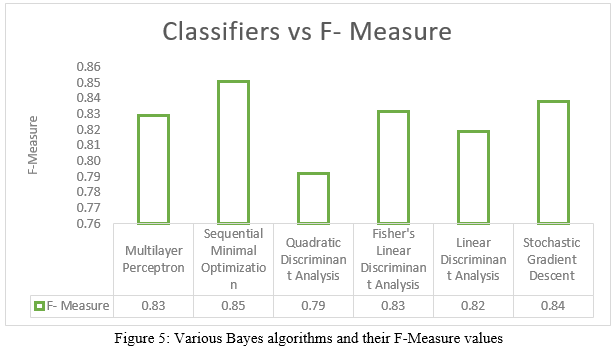
The above diagram shows that the various functional classifiers and their F-Measure levels. The Sequential Minimal Optimization of functional machine learning approach is having highest F- Measure level which is 0.85 of F-Measure level. The least F-Measure value is 0.79 which is produced by Quadratic Discriminant Analysis functional machine learning classification approach. The Fisher’s Discriminant Analysis classifier and Multilayer Perceptron classifier are having same F-Measure level which is 0.83 of F-Measure value level. The Linear Discriminant Analysis classifier is having 0.82 of F-Measure level value and Stochastic Gradient Descent classifier is having 0.84 of F-Measure value level.
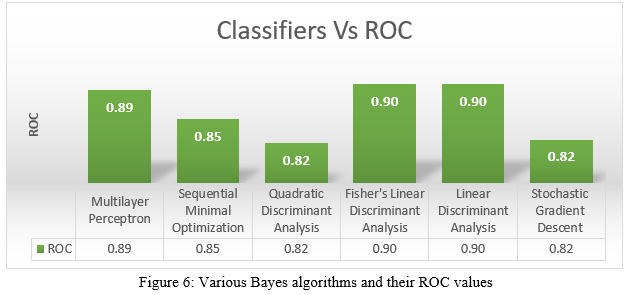
The above diagram shows that the various functional classifiers and their ROC values. The Fisher’s Discriminant Analysis algorithm of functional machine learning classifier and Linear Discriminant Analysis classification algorithm of functional machine learning classifier are having same receiver operating characteristic curve value which is 0.90 of receiver operating characteristic curve value. This is the highest receiver operating characteristic curve value compare with other classifiers.
The least receiver operating characteristic curve value is 0.82 which is produced by Quadratic Discriminant Analysis functional machine learning classification approach and Stochastic Gradient Descent algorithm of functional machine learning classification approach. The Sequential Minimal Optimization classification algorithm of functional machine learning approach is having 0.85 of receiver operating characteristic curve value and the Multilayer Perceptron classifier of functional machine learning classification approach is having 0.89 of receiver operating characteristic curve value.
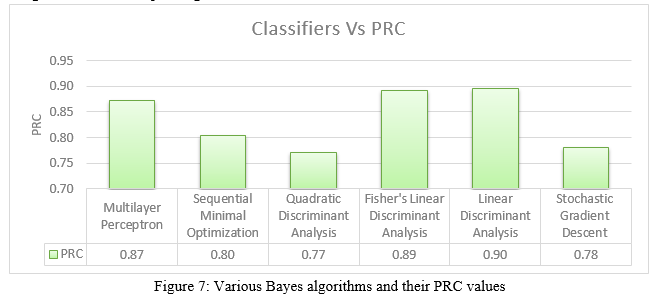
The above diagram shows that the various functional classifiers and their PRC values. The maximum precision recall curve value is 0.90 of precision recall curve value which is produced by Linear Discriminant Analysis of functional machine learning classifier. The lowest precision recall curve value is 0.77 which is produced by Quadratic Discriminant Analysis of functional machine learning classification approach. The Fisher’s Discriminant Analysis of functional machine learning classifier is having 0.90 of precision recall curve value. The Stochastic Gradient Descent functional machine learning classification approach is having 0.78 of precision recall characteristic curve value. The Multilayer Perceptron classifier is having 0.87 of precision recall characteristic curve value and the Sequential Minimal Optimization of functional machine learning approach is having 0.80 of precision recall characteristic curve value.
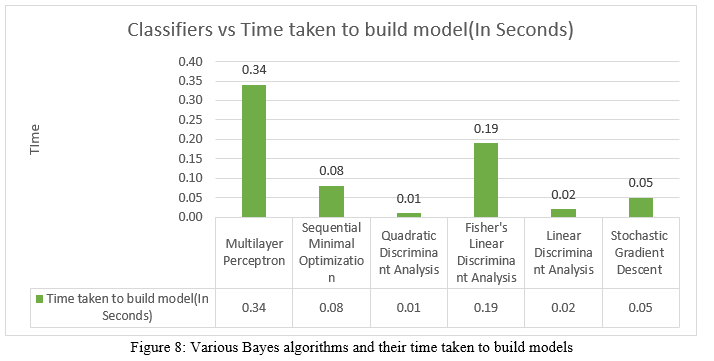
The above diagram shows that the various functional classifiers and their time consumption to build the models. The minimum time consumption to make a model is 0.01 seconds which is produced by Quadratic Discriminant Analysis of functional machine learning classification approach.
The maximum time consumption to make a model is 0.34 seconds which is produced by Multilayer Perceptron of functional machine learning classification approach. The Fisher’s Linear Discriminant Analysis classification algorithm, Sequential Minimal Optimization Algorithm, Stochastic Gradient Descent algorithm and Linear Discriminant Analysis algorithm are taking the time consumption to build the models are 0.19 seconds,0.08 seconds, 0.05 seconds and 0.02 seconds respectively.
Conclusion
This research work concludes that the Sequential Minimal Optimization of functional machine learning approach is having highest accuracy level which is 85% of accuracy level. The least accuracy value is 79% which is having Quadratic Discriminant Analysis classifier. The Sequential Minimal Optimization of functional machine learning approach is having highest precision level which is 0.85 of precision level. The least precision value is 0.80 of precision value which is having Quadratic Discriminant Analysis of functional machine learning classifier approach. The Sequential Minimal Optimization of functional machine learning approach is having highest recall level which is 0.85 of recall level. The least recall value is 0.79 which is produced by Quadratic Discriminant Analysis functional machine learning classification approach. The Sequential Minimal Optimization of functional machine learning approach is having highest F- Measure level which is 0.85 of F-Measure level. The least F-Measure value is 0.79 which is produced by Quadratic Discriminant Analysis functional machine learning classification approach.The Fisher’s Discriminant Analysis algorithm of functional machine learning classifier and Linear Discriminant Analysis classification algorithm of functional machine learning classifier are having same receiver operating characteristic curve value which is 0.90 of receiver operating characteristic curve value. This is the highest receiver operating characteristic curve value compare with other classifiers. The least receiver operating characteristic curve value is 0.82 which is produced by Quadratic Discriminant Analysis functional machine learning classification approach and Stochastic Gradient Descent algorithm of functional machine learning classification approach. . The maximum precision recall curve value is 0.90 of precision recall curve value which is produced by Linear Discriminant Analysis of functional machine learning classifier. The lowest precision recall curve value is 0.77 which is produced by Quadratic Discriminant Analysis of functional machine learning classification approach. This system recommends that the Sequential Minimal Optimization of functional machine learning approach produces optimal results compare with other models.
References
[1] Ishleen Kaur, M.N. Doja, Tanvir Ahmad,Time-range based sequential mining for survival prediction in prostate cancer,Journal of Biomedical Informatics, Volume 110,2020,103550,ISSN 1532-0464,https://doi.org/10.1016/j.jbi.2020.103550. [2] https://www.kaggle.com/sajidsaifi/prostate-cancer [3] Fabacher T, Godet J, Klein D, Velten M, Jegu J., Machine learning application for incident prostate adenocarcinomas automatic registration in a French regional cancer registry.,nt J Med Inform. 2020 Jul;139:104139. doi: 10.1016/j.ijmedinf.2020.104139. Epub 2020 Apr 9. [4] Binder-Foucard F., Bossard N., Delafosse P., Belot A., Woronoff A.-S., Remontet L., et. al.: Cancer incidence and mortality in France over the 1980-2012 period: solid tumors. Rev. Epidemiol. SantePublique 2014; 62: pp. 95-108. [5] Boyle P., Parkin D.M.: Cancer registration: principles and methods. Statistical methods for registries. IARC Sci. Publ. 1991; pp. 126-158. [6] Fritz A.G.International Classification of Diseases for Oncology: ICD-O.2000.World Health OrganizationGeneva: [7] Löpprich M., Krauss F., Ganzinger M., Senghas K., Riezler S., Knaup P.: Automated classification of selected data elements from free-text diagnostic reports for clinical research. Methods Inf. Med. 2016; 55: pp. 373-380. [8] Oleynik M., Patrão D.F.C., Finger M.: Automated classification of semi-structured pathology reports into ICD-O using SVM in Portuguese. Stud. Health Technol. Inform. 2017; 235: pp. 256-260. [9] AAlAbdulsalam A.K., Garvin J.H., Redd A., Carter M.E., Sweeny C., Meystre S.M.: Automated extraction and classification of cancer stage mentions from unstructured text fields in a central cancer registry. AMIA Summits Transl. Sci. Proc. 2018; 2018: pp. 16-25. [10] Kavuluru R., Hands I., Durbin E.B., Witt L.: Automatic extraction of ICD-O-3 primary sites from cancer pathology reports. AMIA Jt Summits Transl. Sci. Proc. 2013; 2013: pp. 112-116. [11] Organization W.H.: ICD-10: International Statistical Classification of Diseases and Related Health Problems : Tenth Revision.2004.World Health Organization [12] Feinerer I., Hornik K., Meyer D.: Text mining infrastructure in r. J. Stat. Softw. 2008; 25: pp. 1-54. [13] Hsu C., Chang C., Lin C.-J.: A Practical Guide to Support Vector Classification Chih-Wei Hsu, Chih-Chung Chang, and Chih-Jen Lin.2003. [14] Hornik K., Buchta C., Zeileis A.: Open-source machine learning: R meets weka. Comput. Stat. 2009; 24: pp. 225-232. [15] Witten I.H., Frank E.: Data Mining: Practical Machine Learning Tools and Techniques.2nd ed.2005.Morgan KaufmannSan Francisco [16] Meyer D., Dimitriadou E., Hornik K., Weingessel A., Leisch F.: e1071: Misc Functions of the Department of Statistics, Probability Theory Group (Formerly: E1071), TU Wien.2019. [17] Sebastiani F.: Machine learning in automated text categorization. ACM Comput. Surv. 2002; 34: pp. 1-47. [18] Ikonomakis E., Kotsiantis S., Tampakas V.: Text classification using machine learning techniques. WSEAS Trans. Comput. 2005; 4: pp. 966-974. [19] Kim B.J., Merchant M., Zheng C., Thomas A.A., Contreras R., Jacobsen S.J., et. al.: A natural language processing program effectively extracts key pathologic findings from radical prostatectomy reports. J. Endourol. 2014; 28: pp. 1474-1478. [20] Jouhet V., Defossez G., Burgun A., Beux le P., Levillain P., Ingrand P., et. al.: Automated classification of free-text pathology reports for registration of incident cases of cancer. Methods Inf. Med. 2012; 51: pp. 242-251. [21] N. Shukla, M. Hagenbuchner, K.T. Win, J. YangBreast cancer data analysis for survivability studies and predictionComput. Methods Programs Biomed., 155 (2018), pp. 199-208 [22] K. Park, A. Ali, D. Kim, Y. An, M. Kim, H. ShinRobust predictive model for evaluating breast cancer survivabilityEng. Appl. Artif. Intell., 26 (9) (2013), pp. 2194-2205 [23] P.J. García-Laencina, P.H. Abreu, M.H. Abreu, N. AfonosoMissing data imputation on the 5-year survival prediction of breast cancer patients with unknown discrete valuesComput. Biol. Med., 59 (2015), pp. 125-133 [24] S. Walczak, V. VelanovichImproving prognosis and reducing decision regret for pancreatic cancer treatment using artificial neural networksDecis. Support Syst., 106 (2018), pp. 110-118 [25] H.M. Zolbanin, D. Delen, A. Hassan ZadehPredicting overall survivability in comorbidity of cancers: A data mining approachDecis. Support Syst., 74 (2015), pp. 150-161. [26] R.J. Kate, R. NadigStage-specific predictive models for breast cancer survivabilityInt. J. Med. Inf., 97 (2017), pp. 304-311 [27] M. Jajroudi, T. Baniasadi, L. Kamkar, F. Arbabi, M. Sanei, M. AhmadzadePrediction of survival in thyroid cancer using data mining techniqueTechnol. Cancer Res. Treat., 13 (4) (2014), pp. 353-359 [28] W.-T. Tseng, W.-F. Chiang, S.-Y. Liu, J. Roan, C.-N. LinThe application of data mining techniques to oral cancer prognosisJ. Med. Syst., 39 (5) (2015)
Copyright
Copyright © 2022 K. Ramakrishna Reddy, Dr. G. N. K. Suresh Babu. This is an open access article distributed under the Creative Commons Attribution License, which permits unrestricted use, distribution, and reproduction in any medium, provided the original work is properly cited.

Download Paper
Paper Id : IJRASET41598
Publish Date : 2022-04-19
ISSN : 2321-9653
Publisher Name : IJRASET
DOI Link : Click Here
 Submit Paper Online