

Ijraset Journal For Research in Applied Science and Engineering Technology
Study of Wear Behaviour of Titanium Grade 2 Using Application of Taguchi Method
Authors: Ajay K Kahale, S. B. Chikalthankar, K. S. Wasankar
DOI Link: https://doi.org/10.22214/ijraset.2021.39707
Certificate: View Certificate
Abstract
Titanium Grade 2 sample piece were subjected to wear on standard linear reciprocating tribometer machine for dry sliding condition in the constant temperature. Taguchi method were use to predict the wear rate against parameter such as Load, Frequency, and time. Signal to noise ratio and ANOVA were used study the impact of these three parameter on the wear rate. In conclusion, the major statistical factor affecting wear rate is load, followed by frequency and duration. Multiple linear regression equations are developed.
Introduction
I. INTRODUCTION
Wear measurement in tribological testing usually involves measurement of mass loss. The amount of these can be desired in the terms of loss of mass (g). The observation of mass loss can be measured the initial and final weight of sample. Titanium is light in weight and having highly corrosion resistance. [1] It have an excellence balance of strength and ductility. Due to various mechanical application of titanium there is a need to continuously monitor wear sliding. There has been a lot of study done to improve its wear resistance and the only way to get significant improvement is to use any proven surface treatment that involves changes in surface chemistry. [1, 2] The use of titanium in the purest form such as medical implants for bones and joints, which had to be created with the influence of various process parameter as per the service condition. The statistical method is used to understand the behaviour titanium wear and to predicts the wear against service condition. In this study, a statistical approach based on taguchi [3-5] and ANOVA approaches was used to assess the degree of impact of each process parameter on the variation of the titanium grade 2 wear loss, as well as a mathematical model linking the variable and its wear behaviour.
II.EXPERIMENTAL AND STATISTICAL PROCEDURE
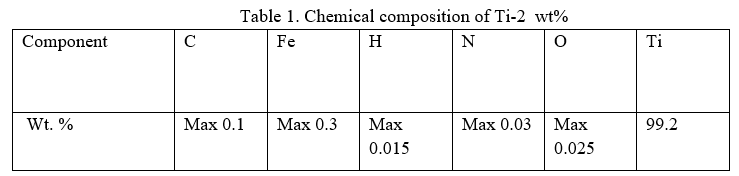
- Material Selection: The study subject is titanium and its alloy which is widely used in industry. Table 1 show the chemical composition of titanium grade 2 and its alloy. Ti grade for industrial used with exceptional resistance to mildly reducing to extensively oxidising, with or without chloride, sample was cut 40*40*5mm square plate, which approvan for sour service used under NACE-MR-1-75 standard.
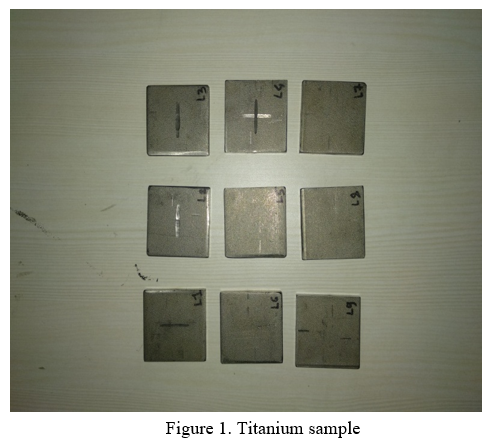
At 882.5 ? pure titanium undergoes an allotrope change from the hexagonal closed packed alpha phase to the body centre cubic beta phase. Its popular because it has good formability and moderate strength as well as good corrosion resistance. Ti 2 is employed marine, aerospace and medical. The specimen shown in fig 1.
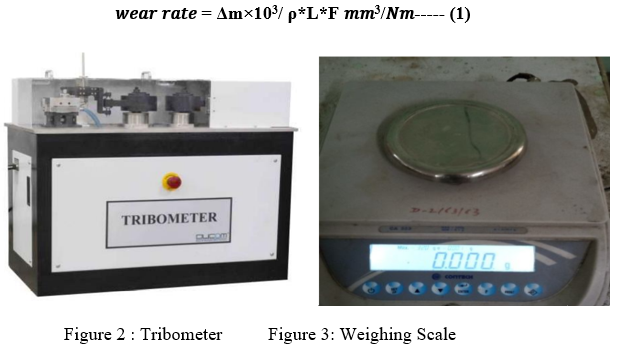
2. Wear test on Tribometer (LRT): The following component are included in the wear test measurement equipment: Tribometer, weighing scale, data acquisition system and computer. On the LRT setup, tribological test are performed under sliding condition. Figure 2 shows the DUCOM tribometer. EN31 is clamped and held against the specimen. Through the loading pin the load is applied to the specimen. During the test the weight loss is measured for the variable of load, frequency and time. As per standard following formula used to calculate wear rate.
3. Plant of Experiment: The control factor and its level were determined using an orthogonal array shown in table 2. Three variable are being tested at three distinct level in this experiment. A full factorial experiment would neccessiated as many trial as possible. The orthogonal array used in this study is provided in table 3.
Table 2. Process parameter with their ranges and values at three levels
|
Level |
Load (N) |
Frequency (Hz) |
Time (s) |
|
1 |
10 |
2 |
900 |
|
2 |
25 |
6 |
1350 |
|
3 |
40 |
10 |
1800 |
Table 3.Taguchi L9 orthogonal array
|
Test Run |
Load (N) |
Frequency (Hz) |
Time (s) |
|
1 |
10 |
2 |
900 |
|
2 |
10 |
6 |
1350 |
|
3 |
10 |
10 |
1800 |
|
4 |
25 |
2 |
1350 |
|
5 |
25 |
6 |
1800 |
|
6 |
25 |
10 |
900 |
|
7 |
40 |
2 |
1800 |
|
8 |
40 |
6 |
900 |
|
9 |
40 |
10 |
1350 |
III. RESULT AND DISCUSSION
A statistical analysis of wear loss was carried out using software MINITAB -18 specifically is use for design of experiment application. The result using L9 orthogonal array as shown in table 4.
Table 4. L9 orthogonal array mean wear loss and S/N ratio
|
Load (N) |
Frequency (Hz) |
Time (s) |
Wear Rate (mm3/Nm) |
SNRA1 |
MEAN1 |
|
10 |
2 |
900 |
0.0123 |
38.2019 |
0.01230 |
|
10 |
6 |
1350 |
0.0048 |
46.3752 |
0.00480 |
|
10 |
10 |
1800 |
0.00554 |
45.1298 |
0.00554 |
|
25 |
2 |
1350 |
0.00903 |
40.8862 |
0.00903 |
|
25 |
6 |
1800 |
0.00328 |
49.6825 |
0.00328 |
|
25 |
10 |
900 |
0.00518 |
45.7134 |
0.00518 |
|
40 |
2 |
1800 |
0.00429 |
47.4732 |
0.00423 |
|
40 |
6 |
900 |
0.00616 |
44.2084 |
0.00616 |
|
40 |
10 |
1350 |
0.00277 |
51.1504 |
0.00277 |
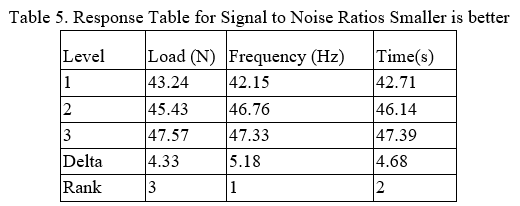
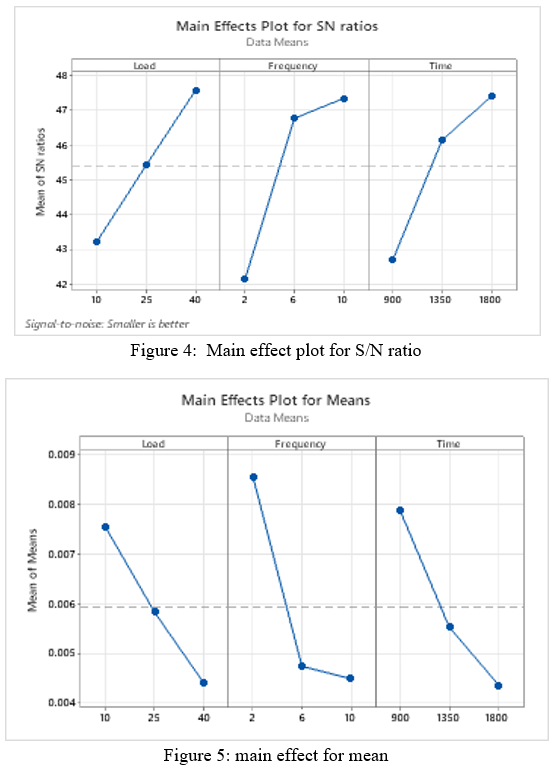
A. S/N Ratio Analysis
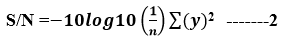
Considering the different factor the S/N ratio was computed for the wear loss of sample as per the response. The S/N ratio was calculated using the equation 2 for smaller is better quality characteristic.
All the responses and S/N ratio were plotted for each factor against its level with a smaller is better condition as shown in figure 4 and figure. The analysis of the result leads to the conclusion that the factors in the consideration shown in increase in mean wear loss the sample due to the increasing abrasion level of the factor. With increasing load, frequency and time, wear loss increases linearly. In terms of minimizing wear the combination of A3, B3, C3 results in the least amount of wear, analysis of variance is carried out in order to comply or justify the factor and relevance. Table 5 shows the response for signal to noise ratio for smaller is better.
B. Analysis of Variance
A statistical analysis of variance is conducted along with the Taguchi technique to find the contribution of each of the parameter for the wear loss. ANOVA can estimate the contribution of various process parameters to selected performance characteristics. The table 5 shows the result of the ANOVA is analyzed for a confidence level of 95%. Sources with a p-value of less than 0.07 were considered to have a statistically significant contribution and it can be observed that the load has the highest influence of 36.11% on the wear loss followed by frequency and duration considering the S/N ratio ; the frequency and time have an influence of 25% and 29.167% respectively. Hence load is most important parameter to be considered during calculating wear rate of titanium grade 2. [6, 7
Table 5: Analysis of Variance for S/N ratio, using Adjusted SS for tests
|
Source |
DF |
Adj SS |
Adj MS |
F- Value |
P-Value |
% of contribution |
|
Load (N) |
2 |
0.000026 |
0.000018 |
5.28 |
0.070 |
36.11 |
|
Frequency (Hz) |
2 |
0.000018 |
0.000026 |
8.56 |
0.033 |
25 |
|
Time (s) |
2 |
0.000021 |
0.000021 |
6.59 |
0.050 |
29.167 |
|
Error |
2 |
0.000007 |
0.000003 |
|
|
9.722 |
|
Total |
8 |
0.000072 |
|
|
|
|
C. Multiple Linear Regression Model Analysis
In order to establish the correlations between wear parameter i.e. load, frequency and time with the wear loss, multiple linear regression model was used.

The confirmation test is carried out by to test the accuracy of the model by selecting different variables given in table 6 shows comparison obtain mathematical and experimental value. The result obtained by comparing the equation correlate the evaluation of the wear rate in the titanium with the degree of approximation. It can be observed from table that the calculated error varied 5.0% for wear.
Table 6. Parameter used in the Confirmation Test
|
Sr. No. |
Parameter |
Optimum Level |
|
1 |
Load (N) |
40 N |
|
2 |
Frequency (Hz) |
10 Hz |
|
3 |
Time (s) |
1800s |
D. Taguchi Confirmation Experiment
Taguchi confirmation test is performed to validate the experiment results and to evaluate and to evaluate the accuracy of the analysis. In table 7, the experimental and predicted values are compared.
Table 7: Comparison of confirmation test
|
Parameter |
Predicted Value |
Experimental Value |
Error % |
|
Wear Rate |
0.0044 |
0.00418 |
5% |
IV. ACKNOWLEDGEMENTS
The author wish to acknowledge the resources provides by the research lab, Department of mechanical engineering, Government College of Engineering Aurangabad, MH.
Conclusion
This study covers the observation about the wear rate of titanium grade2 for the different parameter like load, frequency and time to thoroughly study the effects of these parameter on the wear rate. The major finding of this study are as below. A. It is observed that wear rate of the titanium grade 2 is moderate gives good wear properties. B. The optimal value obtained from Taguchi study is combination of input parameter which affect on the wear rate; Load at 40N Frequency at 10Hz and Time at 1800s C. Load and frequency are most significant parameter affecting the wear rate whereas the time is less significant. D. Multiple linear regression equation has been developed with value 95%. Confirmation experiment shoes the error associated with the wear loss of specimen varies from 0% to 5%
References
[1] Gerd Lütjering, James C. Williams. Titanium. 2nd edition, Springer, 2007. [2] Blau, P.J. (1992). “Friction, Lubrication, and Wear Technology” ASM Handbook 10th edition, ASM International, Materials Park, OH. [3] Rachit Marwaha, Mr. Rahul Dev Gupta, Dr. Vivek Jain and Er. Krishan Kant Sharma., 2013, “Experimental Investigation & Analysis of Wear Parameters on Al/Sic/Gr - Metal Matrix Hybrid Composite by Taguchi Method,” Global Journal of Researches in Engineering, 13(09), 15-21. [4] M.R. Shivakumar, N.V.R. Naidu., 2013, “Taguchi’s Orthogonal Array Approach to Study the Wear Behavior of Aluminium Alloy/Soda Lime Glass Composites,” International Journal of Engineering Research & Technology, 02(08), 2328-2334. [5] H. Unal, F. Ficici, A. Mimaroglu, A. Demirkol, and A. K?rdar., 2015, “Prediction and optimization of tribological behavior of nylon composites using Taguchi analysis method,” Journal of the Brazilian Society of Mechanical Sciences and Engineering, doi:10.1007/s40430-015-0398-1. (Accepted manuscript, published online on 13th August 2015 and yet to be assigned to an issue) [6] N. Naresh, K. Rajasekhar and P. Vijaya Bhaskara Reddy., 2013, “Parametric analysis of GFRP Journal of Mechanical and Civil Engineering, e-ISSN: composites in CNC milling machine using Taguchi method,” IOSR 2278-1684 Vol 6, Issue 1, 102-111. [7] M. S. Sukumar, P. Venkata Ramaiah and A. Nagarjuna., 2014, “Optimization and Prediction of Parameters in Face Milling of Al-6061 Using Taguchi and ANN Approach,” Procedia Engineering, 97, 365 – 37
Copyright
Copyright © 2022 Ajay K Kahale, S. B. Chikalthankar, K. S. Wasankar. This is an open access article distributed under the Creative Commons Attribution License, which permits unrestricted use, distribution, and reproduction in any medium, provided the original work is properly cited.

Download Paper
Paper Id : IJRASET39707
Publish Date : 2021-12-30
ISSN : 2321-9653
Publisher Name : IJRASET
DOI Link : Click Here
 Submit Paper Online