

Ijraset Journal For Research in Applied Science and Engineering Technology
Techniques for Detecting Malware Traffic: A Comprehensive Approach to Feature Selection and Classification
Authors: Harsha A K, Thayagaraja Murthy A
DOI Link: https://doi.org/10.22214/ijraset.2021.39088
Certificate: View Certificate
Abstract
Since the advent of encryption, there has been a steady increase in malware being transmitted over encrypted networks. Traditional approaches to detect malware like packet content analysis are inefficient in dealing with encrypted data. In the absence of actual packet contents, we can make use of other features like packet size, arrival time, source and destination addresses and other such metadata to detect malware. Such information can be used to train machine learning classifiers in order to classify malicious and benign packets. In this paper, we offer an efficient malware detection approach using classification algorithms in machine learning such as support vector machine, random forest and extreme gradient boosting. We employ an extensive feature selection process to reduce the dimensionality of the chosen dataset. The dataset is then split into training and testing sets. Machine learning algorithms are trained using the training set. These models are then evaluated against the testing set in order to assess their respective performances. We further attempt to tune the hyper parameters of the algorithms, in order to achieve better results. Random forest and extreme gradient boosting algorithms performed exceptionally well in our experiments, resulting in area under the curve values of 0.9928 and 0.9998 respectively. Our work demonstrates that malware traffic can be effectively classified using conventional machine learning algorithms and also shows the importance of dimensionality reduction in such classification problems.
Introduction
I. INTRODUCTION
The transport layer security (TLS) cryptographic protocol is used to safeguard a growing proportion of web, messaging, and application data transmission on the Internet. Hypertext transfer protocol secure (HTTPS), the Tor anonymizing network, and virtual private networks based on the OpenVPN protocol already use TLS to encrypt and encapsulate their contents, prohibiting them from being observed or manipulated in transit. According to Google browser data, HTTPS usage has increased from just over 40% of all web page views in 2014 to 98% in March 2021. [1].Malware operators have also been using TLS for effectively the same reasons: to prevent defenders from discovering and blocking malware delivery and data theft. In the last year alone, there was a significant increase in malware that utilizes TLS to disguise its communications. In 2020, TLS was being used by 23% of malware identified. Currently, it is approximately 46% [1]. As a result, it is imperative for network monitoring devices to identify malicious traffic disguised behind TLS encryption.
Early conventional traffic classification models depended on port numbers and deep packet inspection (DPI) [2]. Analysis of uniform resource locators (URL) and TLS fingerprinting are two more kinds of conventional traffic analysis. However, these methods are inadequate in identifying malicious communications in traffic employing TLS. Other characteristics, such as inter-packet arrival intervals, transmission control protocol (TCP) headers and flow direction can be used to identify malicious packets encrypted using TLS in the absence of the payload content. The integration of these characteristics with machine learning algorithms is at the heart of modern traffic analysis approaches. The main objective of our work was to utilize such packet metadata in order to accurately classify malware in a stream of encrypted communication. In this paper, we present an effective malware classification technique using multiple machine learning classifiers. We use an extensive feature selection and elimination process to improve our classification process. The number of features from the benchmark dataset selected is reduced to make our classification models perform better and make it more efficient.
The rest of the paper is arranged as follows. Section II describes related studies on encrypted traffic analysis. Section III covers the proposed methodology for our research study. We describe the dataset that has been chosen for this project. We also go through the process of feature selection and elimination. The findings of the experiments are presented in Section IV. In Section V, we summarize our work and suggest future research possibilities.
II. RELATED WORK
Traditional traffic classification approaches, such as techniques based on port numbers and payloads, are typically based on packet content analysis. However, as the security awareness of the general public grows, use of encryption protocols for communication is also increasing by the day. The payloads of the packets are now encrypted, rendering previous approaches obsolete. As a result, ways to properly detect encrypted malware has become a research focus in the realm of network security.
Shhadata et al. [3] developed approaches for detecting unknown malware by employing machine learning techniques. They applied the random forest classifier to choose features, and their accuracy ranged from 98.2% to 81.8%. They did not give importance to feature engineering which could have improved their model performance. Yoo et al. [4] developed a hybrid technique to detect benign and malicious files by using a random forest model and a deep learning model with twelve hidden layers. The model they proposed also gave insights into attaining effective detection even with a limited training dataset. But their model resulted in a very high false positive rate. Gao et al. [5] developed a unique malware detection model for the cloud based on semi-supervised transfer learning, which included detection, prediction, and transfer components. Prasse et al. [6] put forward a method to classify malware in HTTPS traffic by making use of neural language model and a long short-term memory (LTSM) network. Their mechanism was able to identify malware in traffic which was recorded a couple of months after the training data were recorded and even malware which was previously unseen.
Lucia et al. [7] presented a technique to detect malicious communication using convolution neural networks (CNN) and also support vector machines (SVM). Their SVM model outperformed the CNN model and their method required very little feature engineering. Shen et al. [8] presented a structured method to refine the feature selection process for effective encrypted traffic classification. Yu et al. [9] proposed an encrypted malicious traffic detection model using neural networks. During their research, they found that the problem of imbalance in the dataset had an impact on the encrypted traffic detection. Thaseen et al. [10] put forward a system using machine learning algorithms which could detect network intrusion. Singh et al. [11] published a comparative study detailing the analysis of HTTPS traffic and detection of malware. They proposed that TLS metadata and domain name system (DNS) flow should be thoroughly investigated in order to improve malware detection and analysis.
Agarwal et al. [12] published a study in which they evaluated various machine learning classifiers to detect android malware. They were able to achieve a classification accuracy of 93.15% percent using the CatBoost classifier. Susanto et al. [13] proposed an Internet of Things (IoT) botnet malware classification method using the weka tool along with scikit-learn machine learning libraries. Their results showed that Scikit-learn provided lower false positive rates as compared to weka in such classification problems. Goyal et al. [14] performed malware detection on two kinds of datasets, balanced and imbalanced. Their work showed how class imbalance can affect model performance. They were able to achieve an accuracy of 90.38% on the balanced dataset and 98.94% on the imbalanced dataset using the random forest classifier.
A significant amount of work has also been done in other related scenarios. For example, Zhu et al. [15] proposed a reverse remote access trojan (RAT) detection method using machine learning algorithms. In their approach, they extracted four features from TCP headers which were then used to detect RAT in real time. Priya et al. [16] put forward a framework to identify browsers and also applications of users by analyzing network traffic in real time using unsupervised machine learning techniques. Hou et al. [17] used support vector machine to create a detection system for smart home systems based on edge computing. Shen et al. [18] developed a technique for fingerprinting webpages based solely on packet length information, when all webpages are from the same source. Using the k-Nearest neighbor method, they attained an accuracy of up to 91.6%. Dong et al. [19] suggested utilizing the k-Nearest Neighbor algorithm for video traffic categorization. Conti et al. [20] presented a technique for identifying user behaviors by examining the encrypted network of an Android device. They calculated the sequence of data packets and extracted features using the dynamic time warping technique. For classifying, a random forest model was employed. In order to accomplish website fingerprinting, Wang et al. [21] devised a method for calculating the distance between packet sequences.
A major drawback in most of the work previously carried out in this area is that the researchers have performed negligible feature engineering on the datasets. Without employing any dimensionality reduction techniques, the classification models tend to be very complex, resulting in high variance. Due to this, the model ‘overfits’ on the training dataset. Some researchers have even opted to use deep learning algorithms on datasets without feature engineering resulting in computationally resource intensive algorithms. The research carried out previously also have some other major drawbacks like high false positive rates and inadequate model performances. In most of the papers we reviewed, the authors tend to show the model performance using a single performance metric like the accuracy score, but this is inadequate. In order to properly evaluate a classifier, multiple metrics must be employed so as to present a complete picture of the classification algorithm developed. In our work, we have tackled all of these drawbacks and this is presented in the following sections.
III. METHODOLOGY
This section provides a description of our work. Figure 1 shows the block diagram of the proposed methodology. We began with the cleaning and preprocessing of the dataset. We then performed feature selection and reduced the dimensionality of the dataset. The dataset is then split into training and testing sets. Five different machine learning models are developed to classify malware in the training dataset. These models are then evaluated against the testing set in order to assess their respective performances. Based the performance metrics, we summarize which model is best suited for malware classification in encrypted traffic.
We assess classifier performance using several measures such as area under the curve (AUC), precision, accuracy, F1-Score and recall. These measures are based on the confusion matrix, which in turn represents the number of predicted cases and actual cases generated by any classification algorithm.
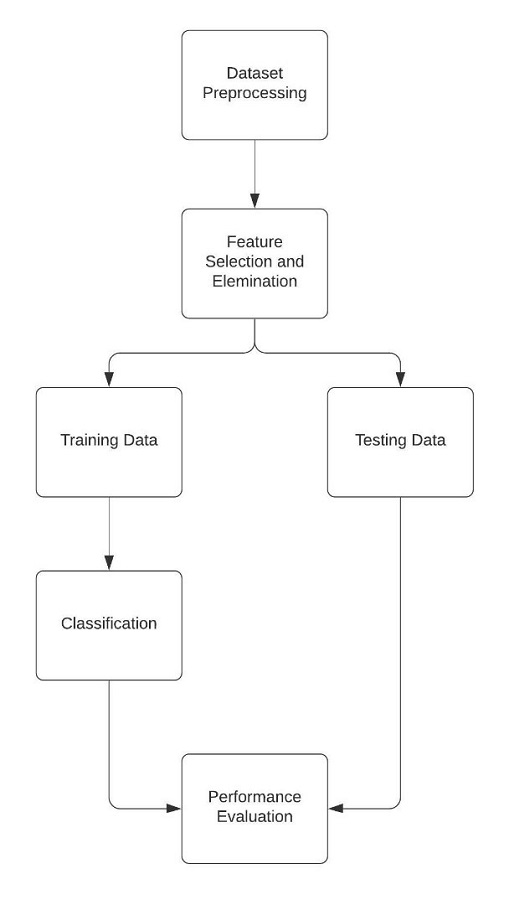
Figure 1 Block diagram of the proposed methodology
- Dataset
To conduct this research, we used the MTA-KDD’19 Dataset created by Ivan Letteri et al. [22]. This dataset was produced by combining packets with the same source address in each packet capture (pcap) in segments, even if they are not consecutive in time. As a result, this dataset enables us to see traffic from a different viewpoint, one that considers the hosts involved in the connection rather than just the packets themselves.
This dataset has a total of 33 features. Each of these features were carefully chosen by the authors of the dataset. The authors presented valid and detailed reasons for the selection of each feature in the dataset. Features related to the TCP flags were chosen because presence of multiple packets in which such flags are set may indicate malware [23]. Features related to DNS, TCP and user datagram protocol (UDP) protocols were chosen because certain attacks exploit specific characteristics of these protocols [24]. Features related to the packet number, size and inter-arrival times were chosen because they are helpful in detecting flooding attacks [25]. The packet ratio feature helps in detecting distributed denial of service (DDoS) attacks as the number of packets received will be much lower than packets sent [26]. The first packet length is an important feature since it reveals useful characteristics of the traffic [27]. As it is possible to see sequential transmissions of a significant number of tiny packets in DDoS attacks, characteristics relating to packet ratio are chosen [27]. In addition, during a DDoS attack, all of the attackers are linked to one single victim, but that victim will open connections with a huge set of other hosts, most of which are the attackers. This is why features related to port number and destination address are present in the dataset [28].
- Feature Selection and Elimination
We explore the effect of keeping only essential features that can improve prediction accuracy and discarding those features which are irrelevant and could impair the performance of the model. By reducing the number of features, we also reduce the model complexity. This can help in preventing overfitting.
Bias and Variance are measurements that assist us to understand how the function's deviance varies. Bias is a measure of the function's departure or inaccuracy from its true value. Variance quantifies the variation in the response variable function if it was calculated using other training samples from the same dataset. If bias is reduced, the model will fit well on that particular training data sample. But it will not be able to detect any previously unseen underlying patterns in the data. As a result, it becomes extremely likely that the model's output performance will change when another sample is used for training. A high variance is a result of this. Similarly, if we seek lower variance while using different samples, the learning model will not be able fit perfectly on the data points, which results in significant bias. Feature selection may be seen as a variance reduction approach that trades off the benefits of lower variance (due to dimensionality reduction) with the disadvantage of increased bias (due to the elimination of some of the important features) [29].
In our work, we first check to see if there are any missing values and categorical features in the dataset. Since there are no categorical features, there was no need for any feature encoding. We then check the distribution of the dependent variable.
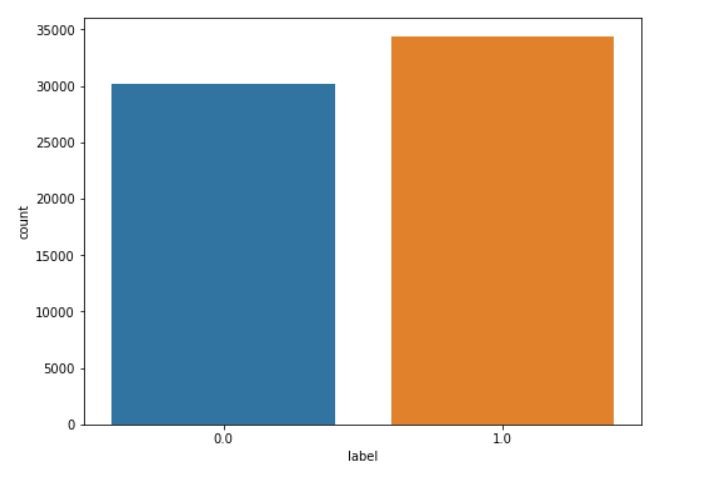
Figure 2 Distribution of the dependent variable
Figure 2 shows that the data is slightly imbalanced. The class with label ‘0.0’ has comparatively lesser number of data points as compared to the label ‘1.0’. Here label ‘0.0.’ represents benign data packets and the label ‘1.0’ represents malicious data packets. Based on this, the performance measure which we used is the area under the ROC curve. Then we checked to see if there were any features with zero variance or if there were any duplicated features. There were none. Next, we move into the feature elimination phase.
A critical stage in the feature removal phase is identifying the correlation between the features in the dataset. A positive correlation indicates the presence of a distinct association. As a result, features with high correlation are dependent and have a significant impact on the development of a machine learning model. Correlation coefficient is represented by r, with its value ranging from -1.0 to +1.0. The average value of positive correlation coefficient is between 0.5 and 0.7. A value of 0 implies that there is no correlation.
In order to remove the highly correlated features from our dataset, we set a correlation threshold of +0.8. There were multiple groups of correlated features as tabulated in table 1. We observe that there are 13 groups of highly correlated features. Some features like AvgLen has high correlation with multiple other features. In such cases we used the concept of feature importance to select just one feature from the group. Using this process we eliminated a total of 11 features from our dataset.
TABLE I
Features with high correlation and their respective correlation values
|
S. No |
Feature 1 |
Feature 2 |
Correlation |
|
1. |
UDPoverIP |
TCPoverIP |
0.985633 |
|
2. |
UDPoverIP |
DNSoverIP |
0.877538 |
|
3. |
AckFlagDist |
FlowLEN |
0.957587 |
|
4. |
AckFlagDist |
PshFlagDist |
0.931598 |
|
5. |
AckFlagDist |
SynFlagDist |
0.810665 |
|
6. |
AvgLen |
AvgWinFlow |
0.947299 |
|
7. |
AvgLen |
MaxLen |
0.858070 |
|
8. |
AvgLen |
FlowLen |
0.850807 |
|
9. |
AvgLen |
StdDevLen |
0.837223 |
|
10. |
DeltaTimeFlow |
MaxIAT |
0.945212 |
|
11. |
NumCon |
NUmIPdst |
0.930952 |
|
12. |
AvgIAT |
AvgIATrx |
0.875336 |
|
13. |
FinFlagDist |
SynFlagDist |
0.827972 |
The next step was the look at the mutual information among all the 22 remaining features. From the plot in figure 3, we can see that there are no features with zero mutual information.
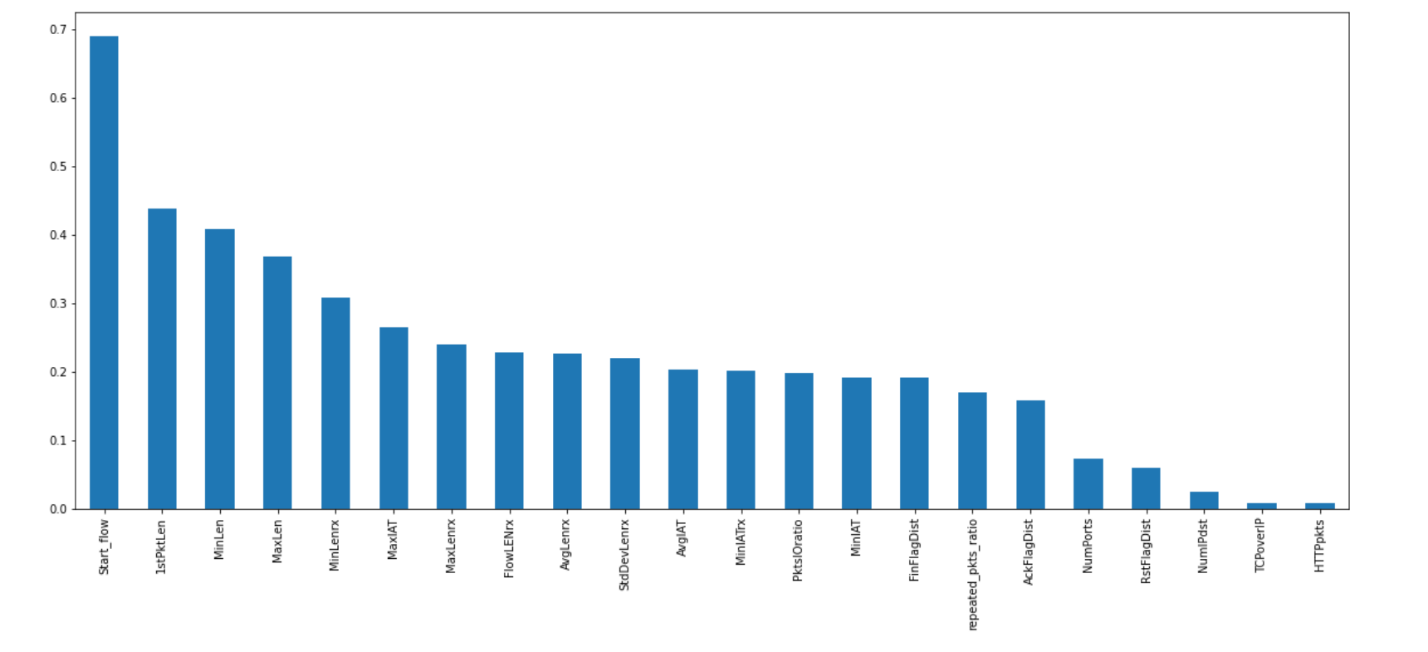 Figure 2 Mutual information present in the features
We then leveraged the random forest algorithm to rate features in order to select only the most important features. The random forest technique uses tree-based algorithms to rank a node's Gini impurity. The largest impurity occurs near the root, whereas the lowest impurity shows at the branches' ends. Furthermore, once trained, a tree can compute how much of the observed impurity in the tree is reduced by each feature. Thus we can produce a subset of the most important features by pruning the tree. Figure 4 shows the top 10 features in our dataset based on feature importance as calculated by the random forest algorithm.
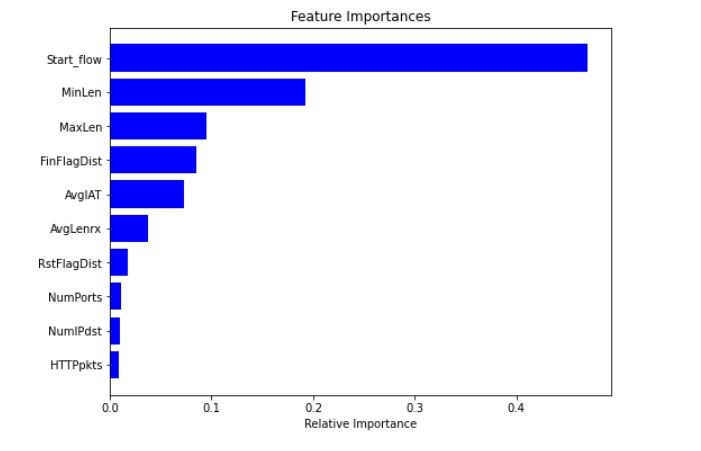
Figure 3 Top 10 features based on feature importance
- Evaluation Metrics
Performance of machine learning classifiers can be evaluated on the basis of multiple evaluation metrics. As a primary evaluation metric, we have chosen the AUC score. Some of the other evaluation metrics are precision, accuracy, recall and F1-score. A receiver operating characteristic (ROC) curve is a graph that depicts a classification model's performance over all classification thresholds. The AUC score indicates the classifier's ability to correctly discriminate between the classification classes and is used to summarize the receiver operating characteristic curve. When AUC = 1, the classifier is capable of accurately distinguishing between all Positive and Negative class points. When the AUC = 0, the classifier would predict all Negatives as Positives and all Positives as Negatives. The greater a classifier's AUC score, the better its ability to discriminate between positive and negative classifications.
- Classifiers Used
- Decision Trees: The decision tree algorithm is depicted as a tree in which each nodes represent individual features, branches of the tree represents decisions (rules), and leaf nodes indicate outcomes. At our first attempt at modelling a decision tree algorithm, we observed that our model was prone to overfitting. Thus, hyper parameter tuning was necessary. In order to tune the hyper parameters, we plot graphs depicting the variation of AUC score with the change in the value of the respective hyper parameter. The AUC of the training set plotted in blue and that of the test set is plotted in red. The following graphs help choose the right values of the hyper parameters for the decision tree classifier.
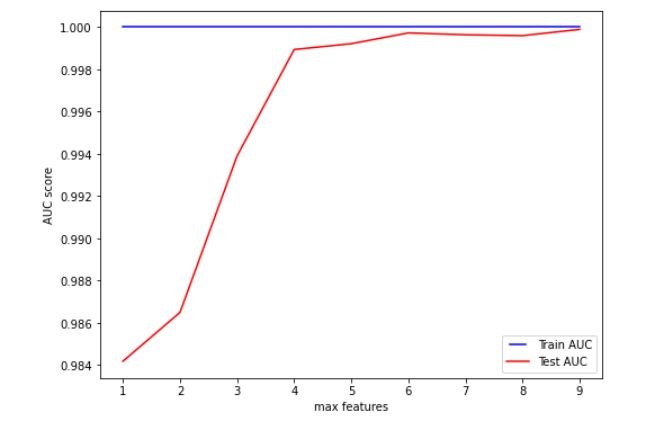
Figure 4 Variation on AUC score with the number of maximum features
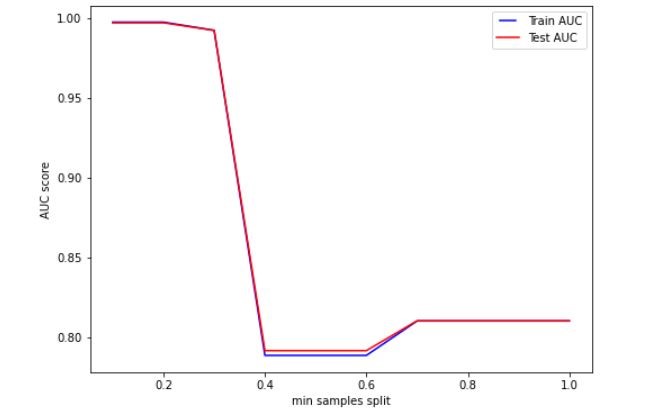
Figure 5 Variation on AUC score with minimum samples split
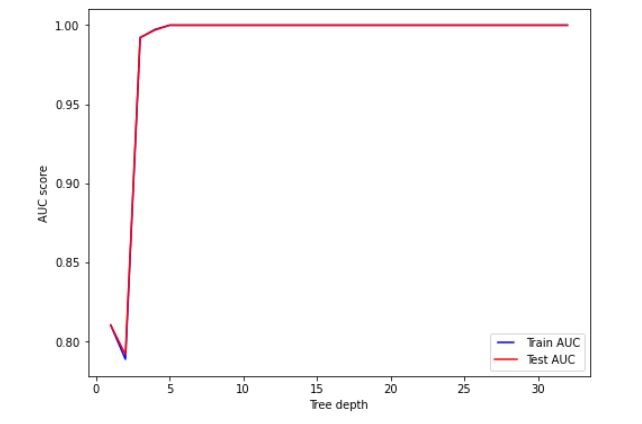
Figure 6 Variation on AUC score with tree depth
Based on the figures 5, 6 and 7, we set max features, minimum samples split and tree depth to 6, 0.2 and 5 respectively.
This hyper parameter tuning process resulted in a better performing model. The AUC of the training set was 0.8934 and that of the testing set was 0.8923.
- Naïve Bayes: This is a classification approach based on Bayes' Theorem. It makes the assumption of predictor independence. A Naive Bayes classifier assumes that the presence of a feature in a class has no bearing on the presence of any other feature. These models are simple to construct and they are helpful for very big data sets. It is named naive because it believes that the presence of one characteristic is unrelated to the occurrence of others. This classifier did not perform very well with our dataset as compared to the random forest model. The AUC of the training set was 0.8167 and that of the testing set was 0.8167
- Random forest: Random forest is an ensemble learning method which constructs numerous decision trees or weak learners and combines them to get a more accurate and reliable results. The hyper parameters of a random forest are virtually identical to those of a decision tree. While ‘growing’ these trees, Random Forest adds more unpredictability to the model. The following graphs help choose the right values of the hyper parameters for the Random Forest classifier.
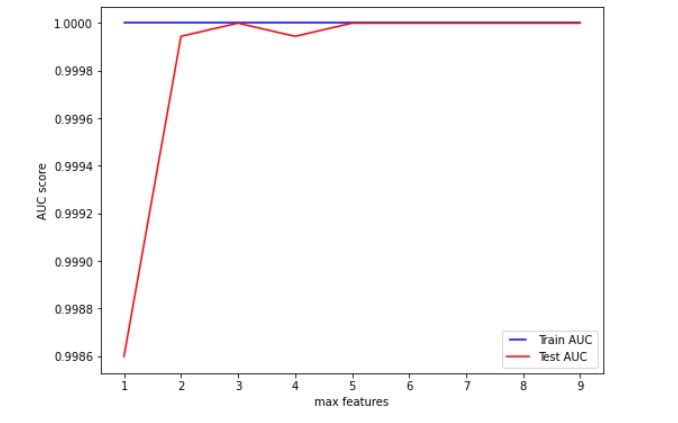
Figure 7 Variation on AUC score with maximum features
The number of trees to be created before calculating the maximum voting or prediction averages is denoted by N-estimator. A greater number of trees results in higher performance but consumes more resources.
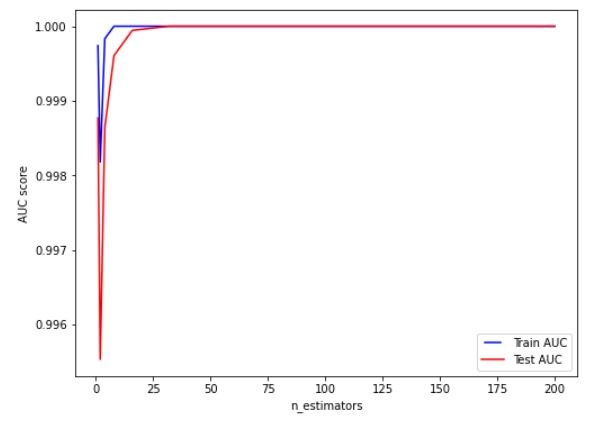
.Figure 9 Variation on AUC score with the value of n estimators
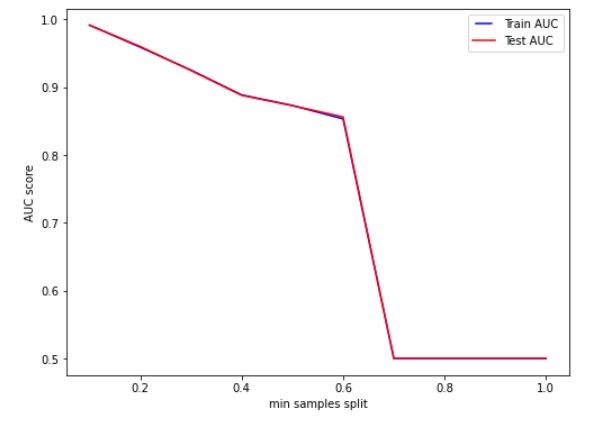
Figure 10 Variation on AUC score with minimum samples split
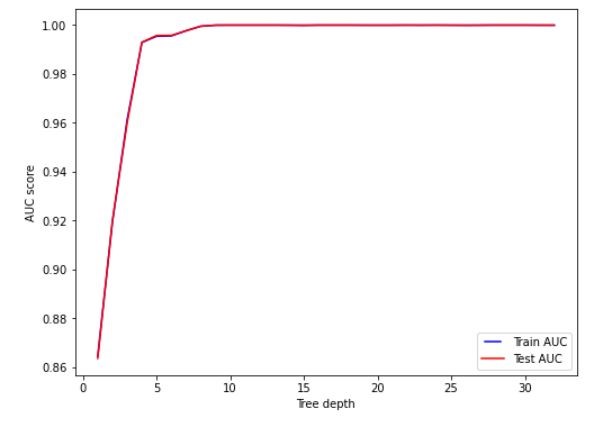
Figure 11 Variation on AUC score with tree depth
Based on the figures 8, 9, 10 and 11, we set the max features, n estimators, minimum samples split and tree depth as 5, 25, 0.2 and 10 respectively. Hyper parameter tuning further improved the classifier’s performance and the random forest classifier outperformed the decision tree classifier. The AUC of the training set was 0.9950 and that of the testing set was 0.9928.
- Support vector machine: The support vector machine algorithm seeks to find a hyperplane in an n-dimensional space, where n represents the number of characteristics that distinguishes the data points. Several such hyperplanes might be used to divide the groups of data points. The goal here is to locate the plane with the greatest distance between data points from both classes. Hyperplanes are the boundaries that aid in the classification of data items. Support vectors on the other hand, are data points which are nearest to the hyperplane and these data points impact the hyperplane's orientation and position. Grid search was used to tune the hyper parameters of the support vector machine classifier. Grid search attempts all possible combinations of the dictionary values and assesses the model for each one using the cross-validation approach. The resulting optimal values for ‘C’, ‘gamma’ and ‘kernel’ were 1000, 0.1, and ‘rbf’ respectively, where ‘rbf’ stands for the Radial Bias Function kernel. This classifier performed fairly well with our dataset as compared to the random forest model. The AUC of the training set was 0.9247 and that of the testing set was 0.9246.
- Extreme gradient boosting (XGBoost): Boosting is a method that combines many basic models into a single composite model. Gradient boosting considers boosting as a problem of numerical optimization with the goal of minimizing the loss function of the model. This is achieved by adding weak learners using gradient descent which is an iterative optimization technique for locating a differentiable function's local minima. XGBoost is a framework based on gradient boosting that is tuned to be versatile and efficient. XGBoost is used for two reasons: execution speed and model performance. XGBoost was the best performing model in our experiments. Without hyper parameter tuning, the AUC of the training set was 0.9972 and that of the testing set was 0.9968. We decided to further improve the performance of the classifier using grid search. The resulting optimal values for learning rate, number of estimators and maximum depth were 0.1, 140 and 2 respectively. This further improved our model performance and the AUC of the training set was 0.9998 and that of the testing set was 0.9998.
IV. RESULTS AND DISCUSSION
The findings of our experiment are summarized in this section. On the dataset, we used five different machine learning classifiers: Random Forest, Support Vector Machine with the radial bias function kernel, Naive Bayes classifier, Decision Tree, and XGBoost. Table 2 lists the comparative metrics of the algorithms that we utilized in this investigation. Performance of the five algorithms is compared using five different performance metrics. The XGBoost classifier produced an AUC score of 0.9998, clearly outperforming all the other models. The random forest and SVM classifiers also produced very good results with each of their performance metric values over 0.9. The Naïve Bayes model was the worst performing out of the five, with comparatively low values of AUC and precision.
Table 2
Final Results
|
S. No. |
Algorithm |
AUC |
Accuracy |
Precision |
Recall |
F1 Score |
|
1 |
Decision Tree |
0.8923 |
0.8874 |
0.9811 |
0.8018 |
0.8824 |
|
2 |
Naïve Bayes |
0.8167 |
0.8212 |
0.7889 |
0.9021 |
0.8417 |
|
3 |
Random Forest |
0.9928 |
0.9927 |
0.9941 |
0.9921 |
0.9931 |
|
4 |
SVM |
0.9246 |
0.9264 |
0.9075 |
0.9580 |
0.9321 |
|
5 |
XGBoost |
0.9998 |
0.9998 |
1 |
0.9997 |
0.9998 |
Our work has a few limitations which need to be addressed in future studies. Our models were developed in order to classify malicious packets from benign packets. We did not implement any method to classify or detect the specific type of malware which was encountered. Another drawback in our work is that we did not choose to resample the dataset even though there was class imbalance as shown in figure 2. Under sampling of the majority class could have helped in improving the performance of classifiers like SVM but it would have led to data loss.
Conclusion
As the volume of encrypted communication increases rapidly, detecting malware in traffic which is encrypted has become a difficult and complex challenge. Traditional content-based network traffic categorization is becoming difficult due to the rising use of encryption. In this paper we propose a malware classification technique by using multiple machine learning classifiers. We use an extensive feature selection and elimination process to further help in classification. We removed features based on the correlation between them and finally selected only ten best features using the random forest algorithm. The number of features from the dataset is reduced to make our classification models perform better and make it more efficient. From the results we obtained, we conclude that the extreme gradient boosting algorithm performed the best compared to the other algorithms used for the classification of data packets as malicious or benign. The XGBoost classifier produced an AUC score of 0.9998 outperforming all the other classifiers in our study. Future work will include models to classify the different types of specific malware in encrypted traffic. In future studies, we also plan to generalize our findings by utilizing datasets that we intend to develop ourselves. Finally, we recommend that these approaches be extended to other forms of encrypted traffic, such as the categorization of malicious traffic in DNS over HTTPS tunnels.
References
[1] Gallagher S. Nearly half of malware now use TLS to conceal communications. Sophos News. https://news.sophos.com/en-us/2021/04/21/nearly-half-of-malware-now-use-tls-to-conceal-communications. Accessed 17 May 2021. [2] Song W, Beshley M, Przystupa K, Beshley H, Kochan O, Pryslupskyi A, et al. A Software deep packet inspection system for network traffic analysis and anomaly detection. Sensors 20. 2020; 6: 1637. [3] Shhadat I, Bataineh B, Hayajneh A, Ziad A. The use of machine learning techniques to advance the detection and classification of unknown malware. Procedia Computer Science. 2020; 170: 917-922. [4] Yoo S, Kim S, Kim S, Kang BB. AI-HydRa: Advanced hybrid approach using random forest and deep learning for malware classification. Information Sciences. 2021; 546: 420-435. [5] Gao X, Hu C, Shan C, Liu B, Niu Z, Xie H. Malware classification for the cloud via semi-supervised transfer learning. Journal of Information Security and Applications. 2020; 55:102661. [6] Prasse P, Machlica L, Pevný T, Havelka J and Scheffer T. Malware detection by analysing network traffic with neural networks. IEEE Security and Privacy Workshops 2017 (pp. 205-210). IEEE. [7] Lucia MJ, Cotton C. Detection of encrypted malicious metwork traffic using machine learning. IEEE Military Communications Conference 2019 (pp. 1-6). IEEE. [8] Shen M, Liu Y, Zhu L, Xu K, Du X, N. Guizani N. Optimizing feature selection for efficient encrypted traffic classification: A systematic approach. IEEE Network. 2020; 34(4):20-27. [9] Yu T, Zou F, Li L, Yi P. An encrypted malicious traffic detection system based on neural network. International Conference on Cyber-Enabled Distributed Computing and Knowledge Discovery 2019 (pp. 62-70). IEEE. [10] Thaseen IS, Poorva B, Ushasree PS. Network intrusion detection using machine learning techniques. International Conference on Emerging Trends in Information Technology and Engineering 2020 (pp. 1-7). IEEE. [11] Singh AP, Singh M. A comparative review of malware analysis and detection in HTTPs traffic. International Journal of Computing and Digital Systems. 2021; 10(01):111-23. [12] Agrawal P, Trivedi B. Evaluating Machine Learning Classifiers to detect Android Malware. IEEE International Conference for Innovation in Technology (INOCON) 2020 (pp. 1-6). IEEE. [13] Susanto DS, Arifin MAS, Idris MY, Budiarto R. IoT Botnet Malware Classification Using Weka Tool and Scikit-learn Machine Learning. 7th International Conference on Electrical Engineering, Computer Sciences and Informatics (EECSI) 2020 (pp. 15-20). IEEE. [14] Goyal M, Raman K. Machine Learning for Malware Detection on Balanced and Imbalanced Datasets. International Conference on Decision Aid Sciences and Application (DASA) 2020 (pp. 867-871). IEEE. [15] Zhu H, Wu Z, Tian J, Tian Z, Qiao H, Li X, et al. A network behavior analysis method to detect reverse remote access trojan. International Conference on Software Engineering and Service Science 2018 (pp. 1007-1010). IEEE. [16] Priya A, Nandi S, Goswami RS. An analysis of real-time network traffic for identification of browser and application of user using clustering algorithm. International Conference on Advances in Computing, Communication Control and Networking 2018 (pp. 441-445). IEEE. [17] Hou S, Huang X. Use of machine learning in detecting network security of edge computing system. International Conference on Big Data Analytics 2019 (pp. 252-256). IEEE. [18] Shen M, Liu Y, Chen S, Zhu L, Zhang Y. Webpage fingerprinting using only packet length information. International Conference on Communications 2019 (pp. 1-6). IEEE. [19] Dong Y, Zhao J, Jin J. Novel feature selection and classification of internet video traffic based on a hierarchical scheme. Computer Networks. 2017; 119:102–11. [20] Conti M, Mancini LV, Spolaor R, Verde NV. Analyzing Android encrypted network traffic to identify user actions. IEEE Transactions on Information Forensics and Security. 2016; 11(1):114-25. [21] Wang T, Cai X, Nithyanand R, Johnson R, Goldberg I. Effective attacks and provable defenses for website fingerprinting. Proceedings of the 23rd USENIX Conference on Security Symposium 2014 (pp. 143–57). ACM. [22] Letteri I, Penna G, Vita L, Grifa M. (2020). MTA-KDD\\\\\\\\\\\\\\\'19: A dataset for malware traffic detection. Proceedings of the Fourth Italian Conference on Cyber Security 2020 (pp. 153-65). CEUR-WS. [23] Abdullah R, Masud Z, Abdollah M, Sahib S, Robiah Y. Recognizing p2p botnets characteristic through tcp distinctive behavior. International Journal of Computer Science and Information Security. 2011; 9(12): 7-11. [24] Nadler A, Aminov A, Shabtai A. Detection of malicious and low throughput data exfiltration over the dns protocol. Computers & Security. 2017; 80:36-53. [25] Venkatesh GK, Nadarajan RA. Http botnet detection using adaptive learning rate multilayer feed-forward neural network. Proceedings of the 6th IFIP WG 11.2 international conference on Information Security Theory and Practice: security, privacy and trust in computing systems and ambient intelligent ecosystems 2012 (pp.38-48). Springer. [26] Thakur M, Khilnani D, Gupta K, Jain S, Agarwal V, Sane S, et al. Detection and prevention of botnets and malware in an enterprise network. International Journal of Wireless and Mobile Computing. 2012; 5(2):144-153. [27] Hung CH, Sun HM. A botnet detection system based on machine-learning using flow-based features. The Twelfth International Conference on Emerging Security Information, Systems and Technologies 2018 (pp. 122-7). IARIA. [28] Mahjabin T, Xiao Y, Sun G, Jiang W. A survey of distributed denial-of- service attack, prevention, and mitigation techniques. International Journal of Distributed Sensor Networks. 2017; 13(12):11-33. [29] Munson MA, Caruana R. On feature selection, bias-variance, and bagging. Joint European Conference on Machine Learning and Knowledge Discovery in Databases 2009 (pp.144-59) Springer.
Copyright
Copyright © 2021 Harsha A K, Thayagaraja Murthy A. This is an open access article distributed under the Creative Commons Attribution License, which permits unrestricted use, distribution, and reproduction in any medium, provided the original work is properly cited.

Download Paper
Paper Id : IJRASET39088
Publish Date : 2021-11-25
ISSN : 2321-9653
Publisher Name : IJRASET
DOI Link : Click Here
 Submit Paper Online